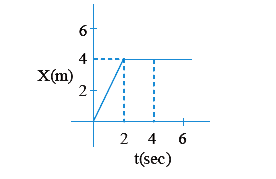
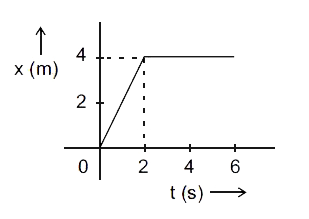
In the figure given below, the position time graph of a particle of mass 0.1kg is shown. The impulse at t=2 sec is
A
B
C
D
Video Solution
Text Solution
The correct Answer is:a
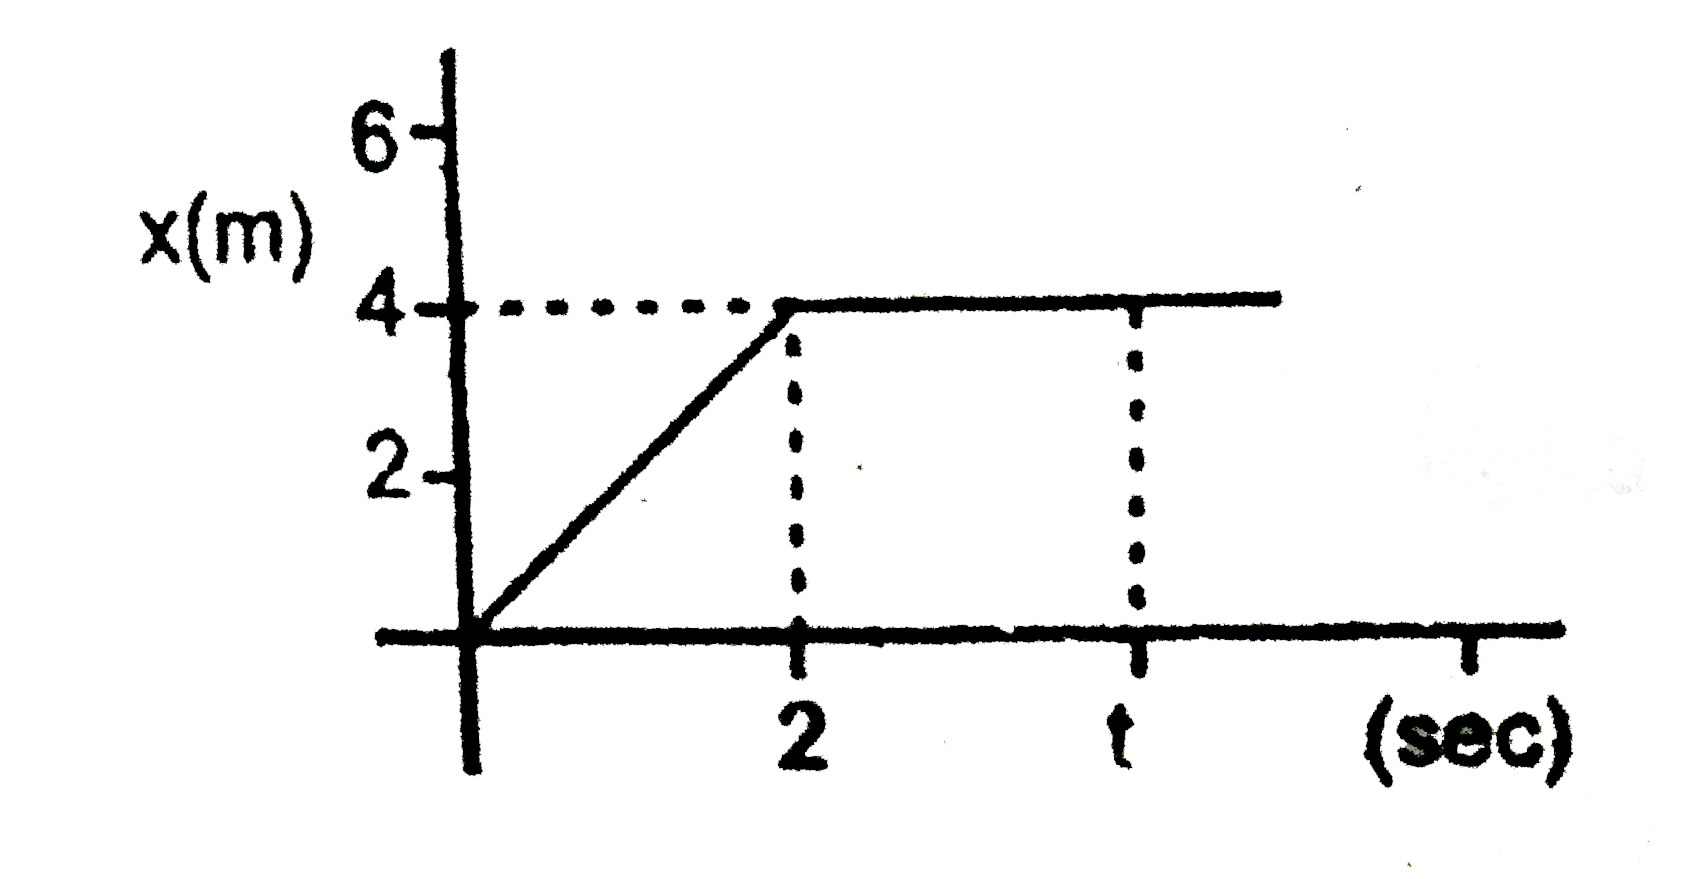
From the graph it is clear that upto the body moves with a constant velocity = slope of
position time graph After
position time graph is parallel to time axis which means that the body comes to rest
Change in velocity
Impulse = change in momentum
.
|
Updated on:21/07/2023
Topper's Solved these Questions
- BOOK - PRADEEPCHAPTER - LAWS OF MOTIONEXERCISE - Integer Type Questions7videos
LAWS OF MOTION
- BOOK - PRADEEPCHAPTER - LAWS OF MOTIONEXERCISE - Assertion- Reason Type Questions17videos
LAWS OF MOTION
- BOOK - PRADEEPCHAPTER - LAWS OF MOTIONEXERCISE - Problems for practice112videos
LAWS OF MOTION
- BOOK - PRADEEPCHAPTER - KINEMATICSEXERCISE - 1 NCERT Comprehension4videos
KINEMATICS
- BOOK - PRADEEPCHAPTER - MATHEMATICAL TOOLSEXERCISE - Fill in the blanks5videos
MATHEMATICAL TOOLS
Similar Questions
Knowledge Check
- Question 1 - Select One
In the figure given below, the position-time graph of a particle of mass 0.1kg is shown. The impuslse at t=2 sec is
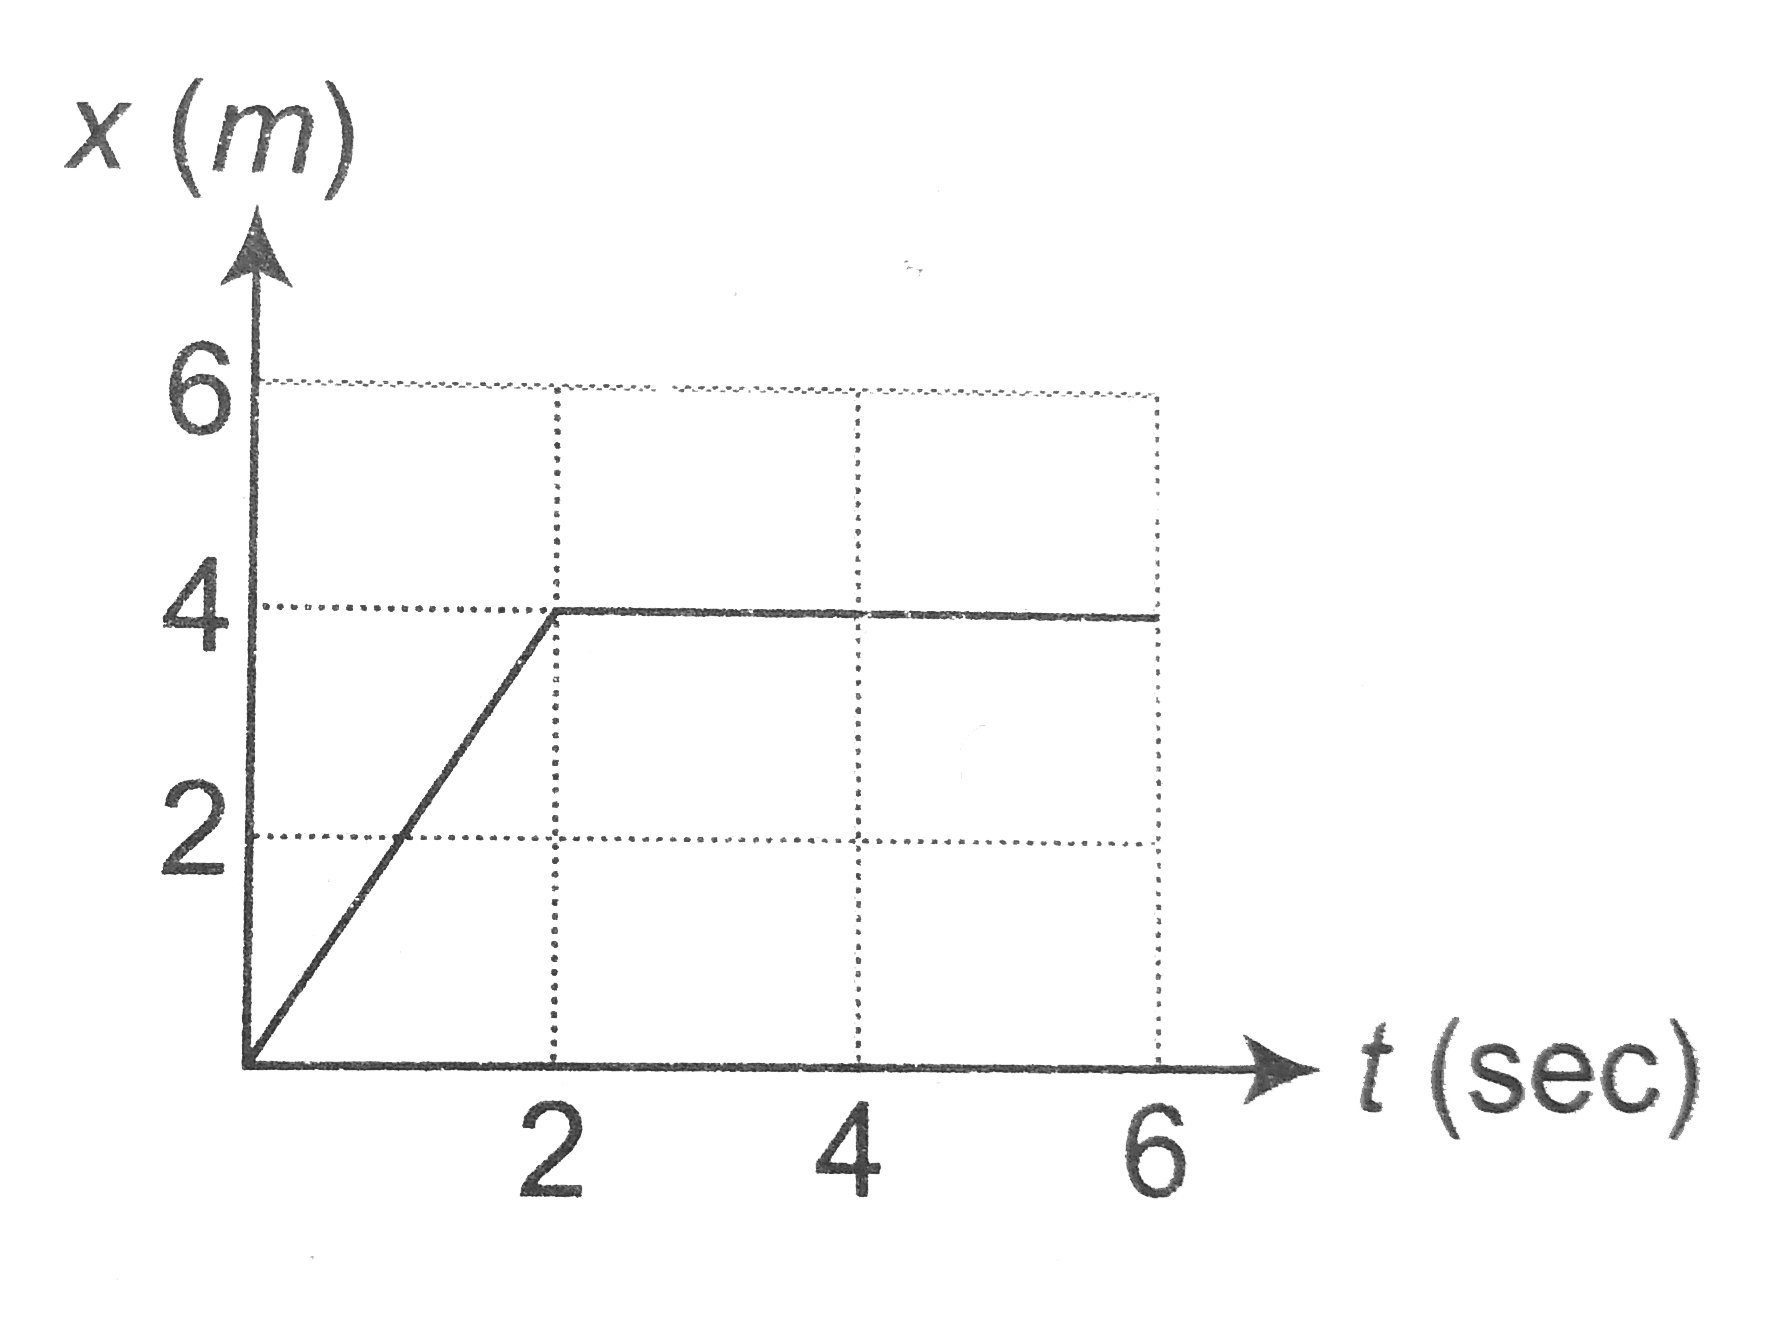 A0.2kgm/secB−0.2kgm/secC−0.1kgm/secD−0.4kgm/sec
 - Question 2 - Select One
In the figure given below, the position–time graph of a particle of mass 0·1 kg is shown. The impulse at t=2sec is
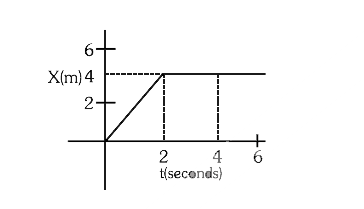 A0⋅2 kgmsec −1B−0⋅2 kgmsec −1C0⋅1 kgmsec −1D−0⋅4 kgmsec −1
 - Question 3 - Select One
In the figure given, the position-time graph of a particle of mass 0.1 kg is shown the impulse at t = 2s is
 A0.2 kg m/sB−0.2 kg m/sC0.1 kg m/sD−0.4 kg m/s
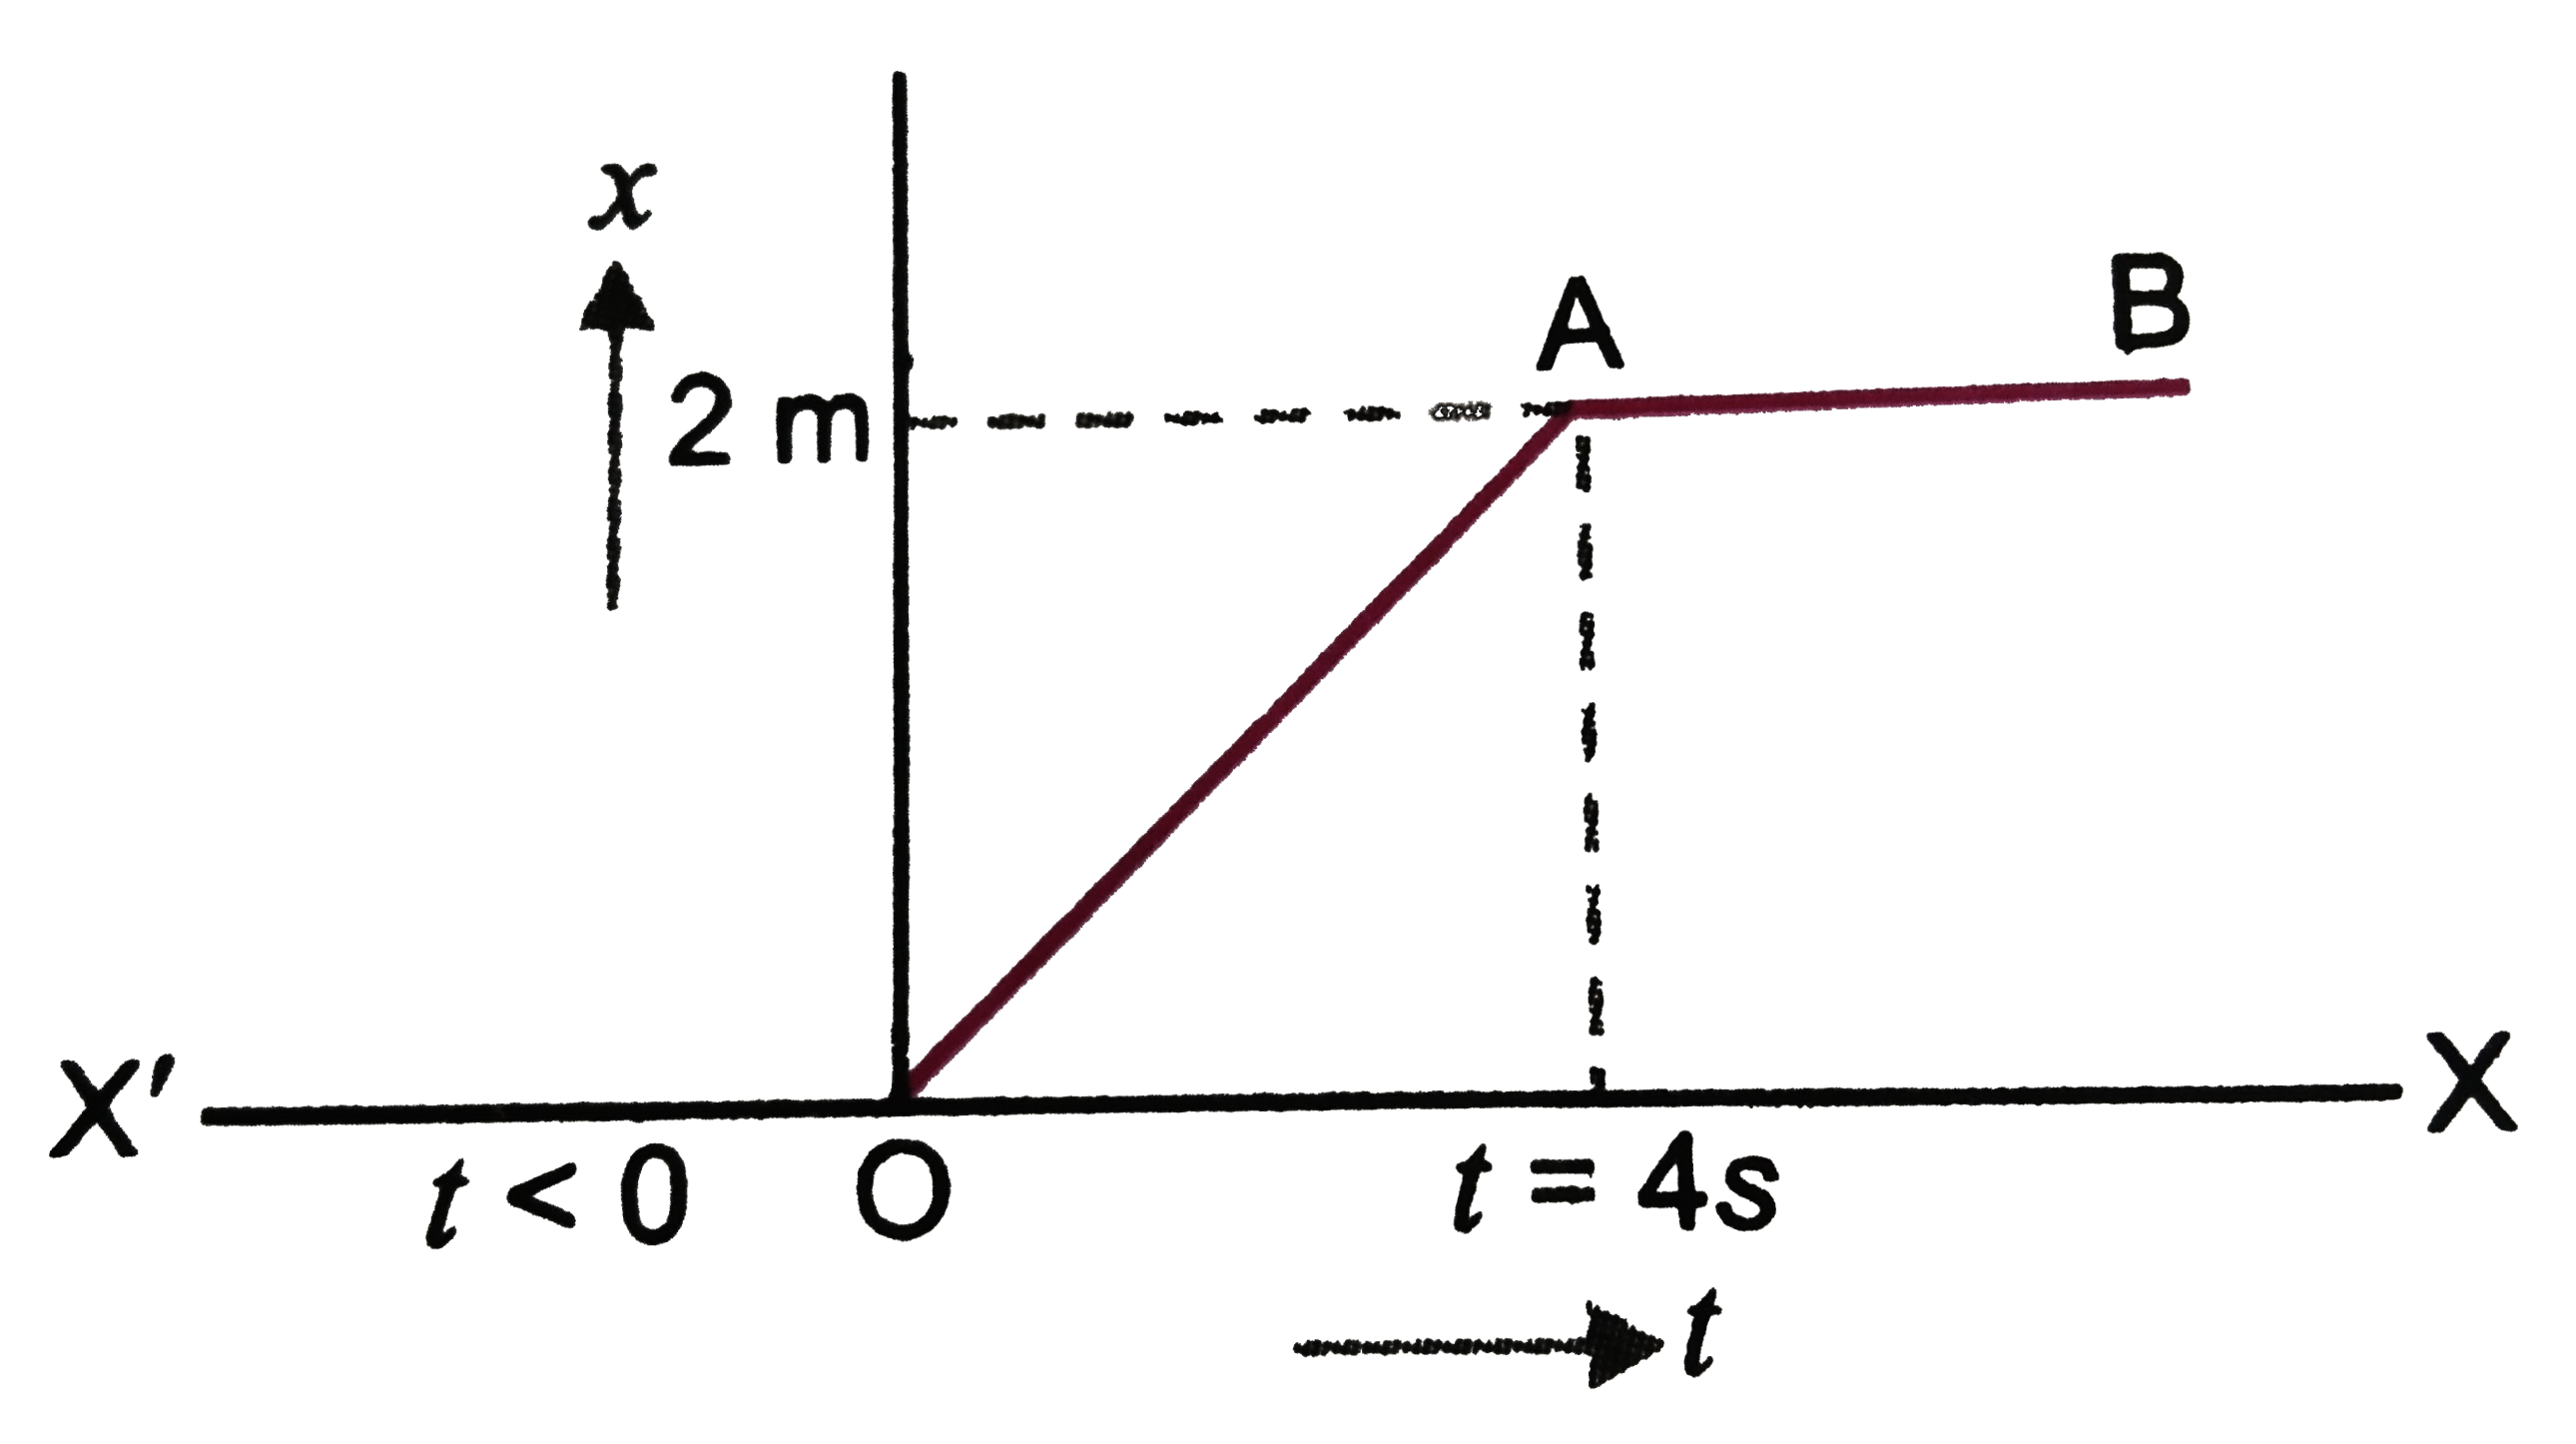
Shows position time graph of a particle of mass 100g Find the impulse at t=0 and at t=4s
 .View Solution
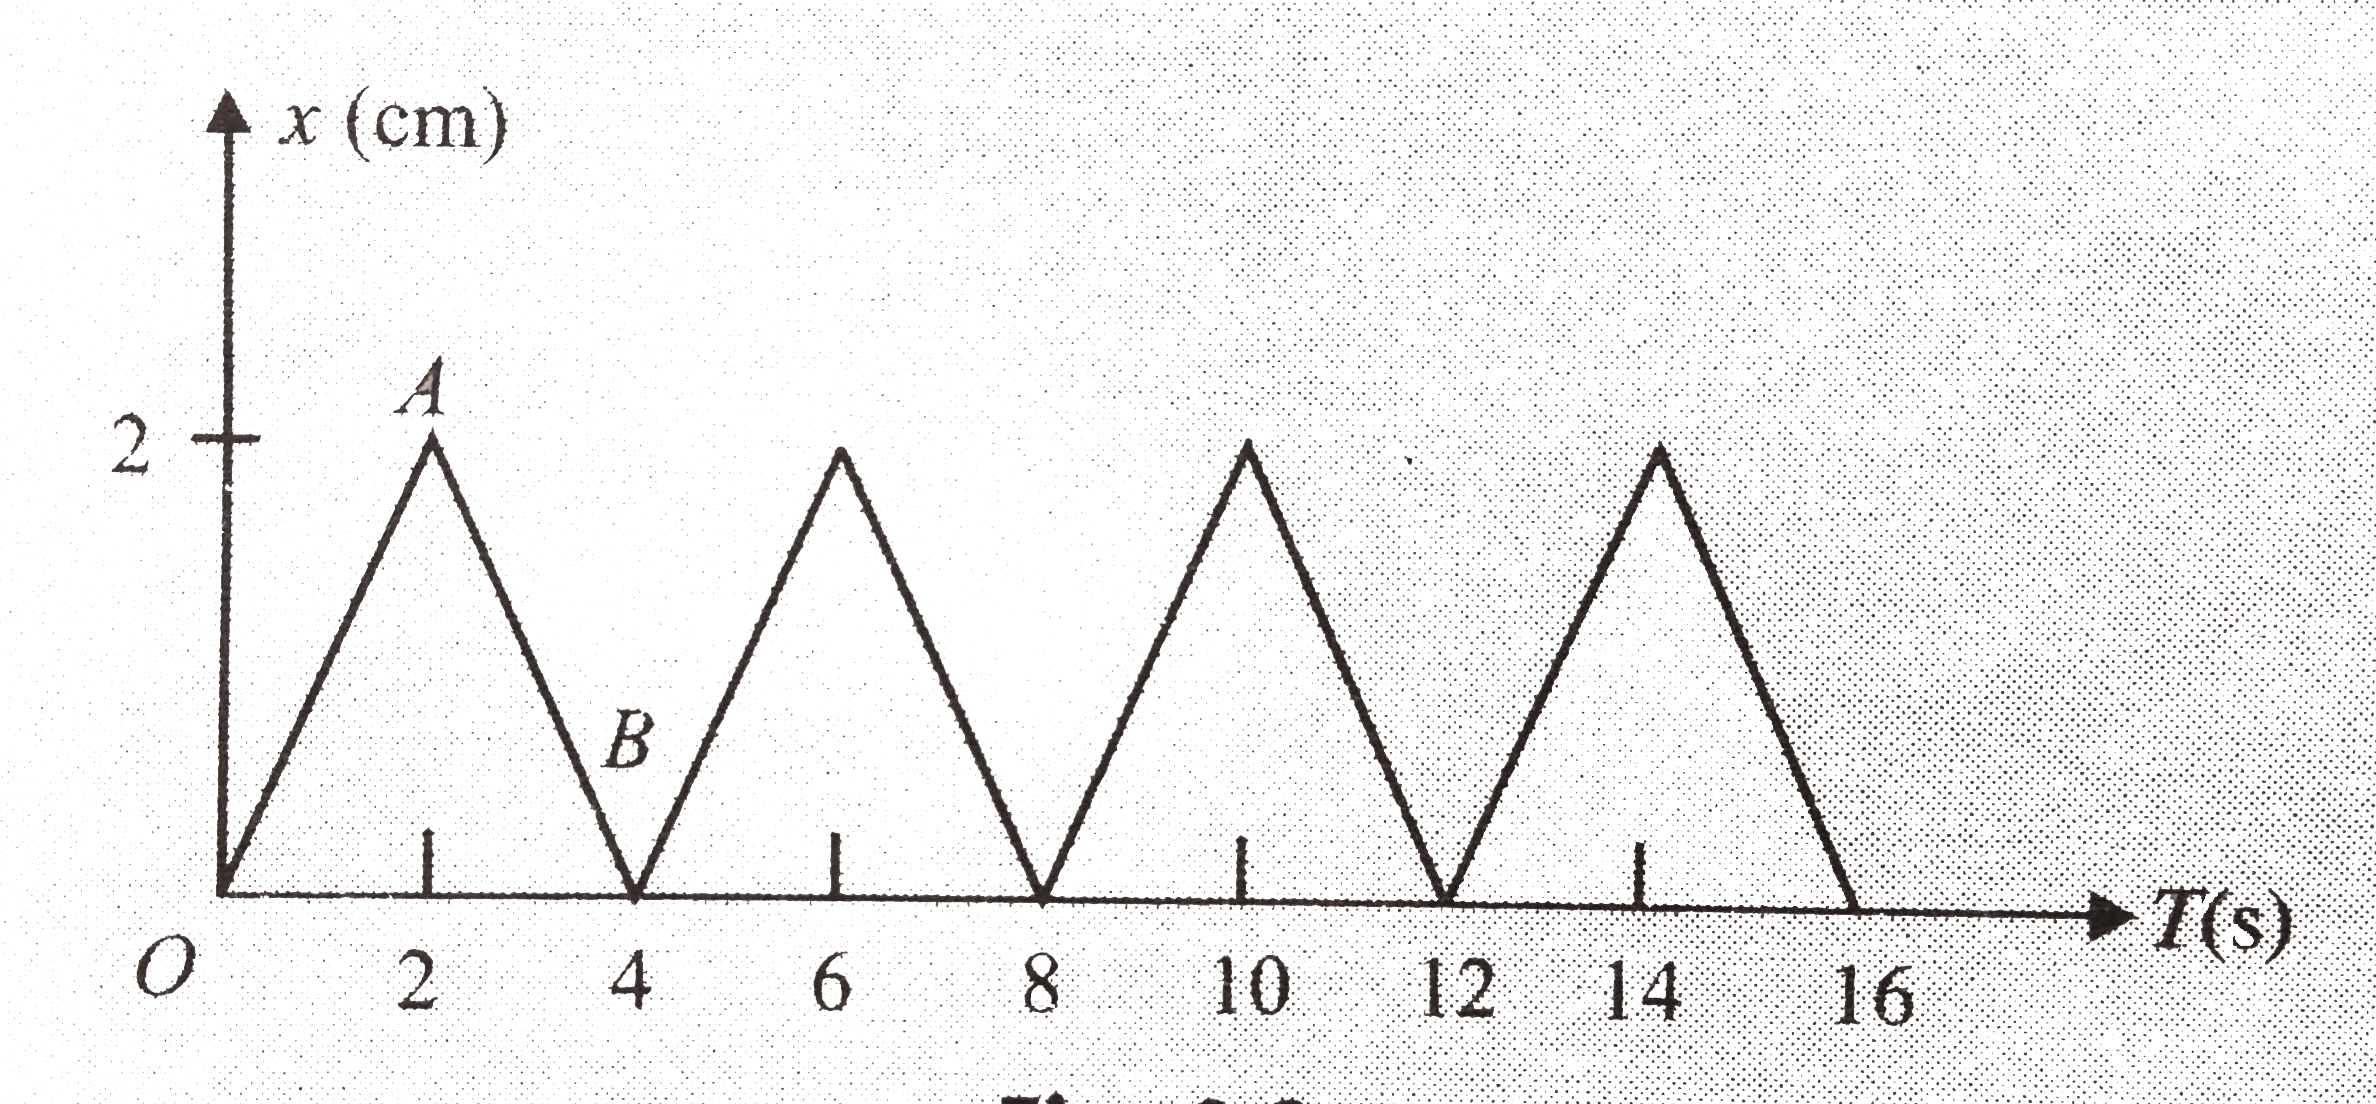
Figure shows the position-time graph of a particle of mass 0.04kg. Suggest a suitable physical context for this motion. What is the time between two consecutive impulses received by the particle? What is the magnitude of each impluse?
 View Solution
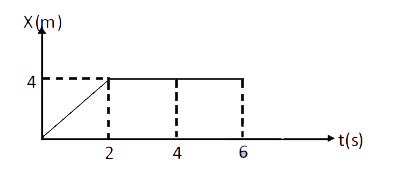
The position-time graph of a particle of mass 0.1 kg is shown. The impulse at t = 2s is :
 View Solution
The velocity − time graph of a particle is as shown in figure
 View Solution
Figure shows the position time graph of a particle of mass 5kg. The force acting on the particle for 0<t<4s and 8s<t<12s respectively are,
 View Solution


