Show graphically the variation of potential energy of an object thrown vertically upwards w.r.t. its height.
To show graphically the variation of potential energy of an object thrown vertically upwards with respect to its height, we can follow these steps:
Step 1: Understand the Concept of Potential Energy
Potential energy (PE) of an object at a height h is given by the formula:
PE=mgh
where:
- m is the mass of the object,
- g is the acceleration due to gravity (approximately 9.81m/s2 near the surface of the Earth),
- h is the height above the reference point (usually ground level).
Step 2: Set Up the Graph
To create the graph:
- Label the x-axis as "Height (h)".
- Label the y-axis as "Potential Energy (PE)".
Step 3: Determine the Relationship
From the formula PE=mgh, we can see that:
- The potential energy is directly proportional to the height h.
- As the height increases, the potential energy also increases linearly.
Step 4: Plot the Points
1. Choose a mass m (for example, 1kg).
2. Calculate the potential energy at various heights:
- At h=0m: PE=0
- At h=1m: PE=mg⋅1=9.81J
- At h=2m: PE=mg⋅2=19.62J
- At h=3m: PE=mg⋅3=29.43J
- Continue for other heights as needed.
Step 5: Draw the Graph
- Plot the calculated points on the graph.
- Connect the points with a straight line since the relationship is linear.
Step 6: Analyze the Graph
- The graph will show a straight line starting from the origin (0,0) and rising upwards.
- The slope of the line represents mg, which is constant for a given mass and gravitational field.
Conclusion
The graph illustrates that as the height increases, the potential energy of the object increases linearly, indicating a direct relationship between height and potential energy.
---
Potential energy (PE) of an object at a height h is given by the formula:
PE=mgh
where:
- m is the mass of the object,
- g is the acceleration due to gravity (approximately 9.81m/s2 near the surface of the Earth),
- h is the height above the reference point (usually ground level).
To create the graph:
- Label the x-axis as "Height (h)".
- Label the y-axis as "Potential Energy (PE)".
From the formula PE=mgh, we can see that:
- The potential energy is directly proportional to the height h.
- As the height increases, the potential energy also increases linearly.
1. Choose a mass m (for example, 1kg).
2. Calculate the potential energy at various heights:
- At h=0m: PE=0
- At h=1m: PE=mg⋅1=9.81J
- At h=2m: PE=mg⋅2=19.62J
- At h=3m: PE=mg⋅3=29.43J
- Continue for other heights as needed.
- Plot the calculated points on the graph.
- Connect the points with a straight line since the relationship is linear.
- The graph will show a straight line starting from the origin (0,0) and rising upwards.
- The slope of the line represents mg, which is constant for a given mass and gravitational field.
The graph illustrates that as the height increases, the potential energy of the object increases linearly, indicating a direct relationship between height and potential energy.
Topper's Solved these Questions
- WORK, ENERGY AND POWERBOOK - PRADEEPCHAPTER - WORK, ENERGY AND POWEREXERCISE - Short Answer Question
52 Videos
- WORK, ENERGY AND POWERBOOK - PRADEEPCHAPTER - WORK, ENERGY AND POWEREXERCISE - Long Answer Question
24 Videos
- WORK, ENERGY AND POWERBOOK - PRADEEPCHAPTER - WORK, ENERGY AND POWEREXERCISE - Conceptual Problems
27 Videos
- THERMODYNAMICSBOOK - PRADEEPCHAPTER - THERMODYNAMICSEXERCISE - Assertion- Reason Type Questions
19 Videos
Similar Questions
Knowledge Check
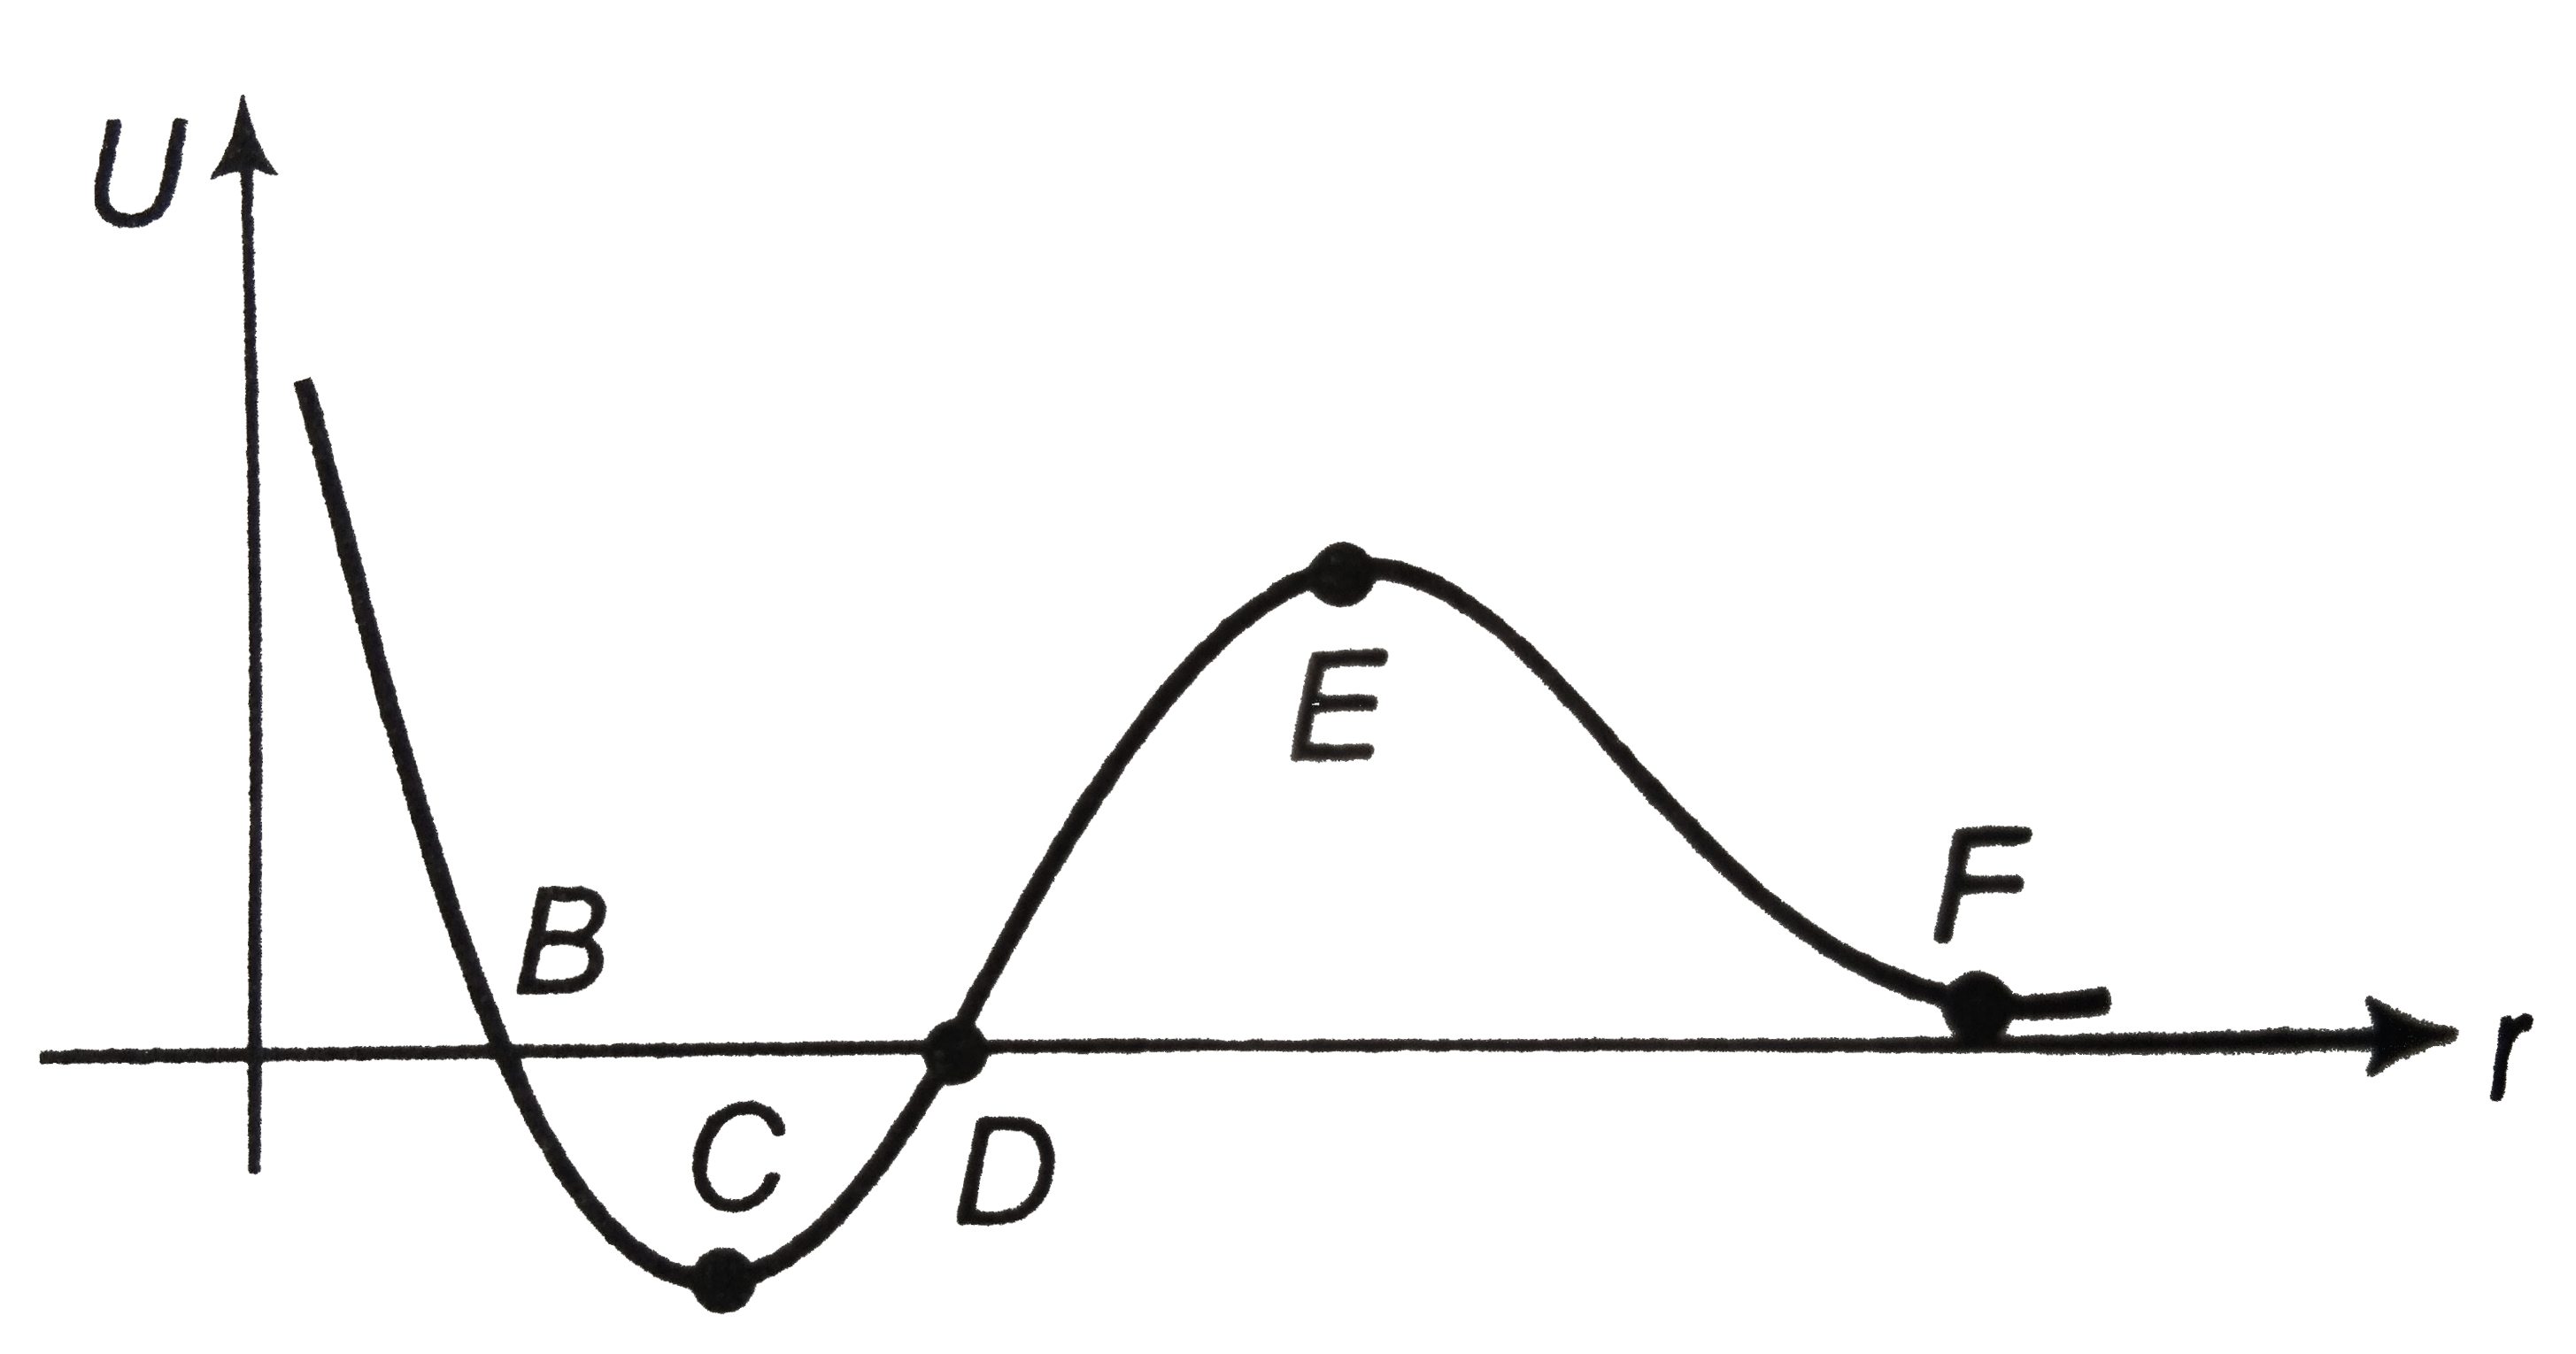
The given plot shows the variation of U, the potential energy of interaction between two particles with the distance separating them r,
 AB and D are equilibrium pointsBC is a point of stable equilibriumCThe force of stable equilibrium between the two particles is attracive between points C and D and repulsive between D and E .DThe force of interaction between particles is repulsive between points E and F.
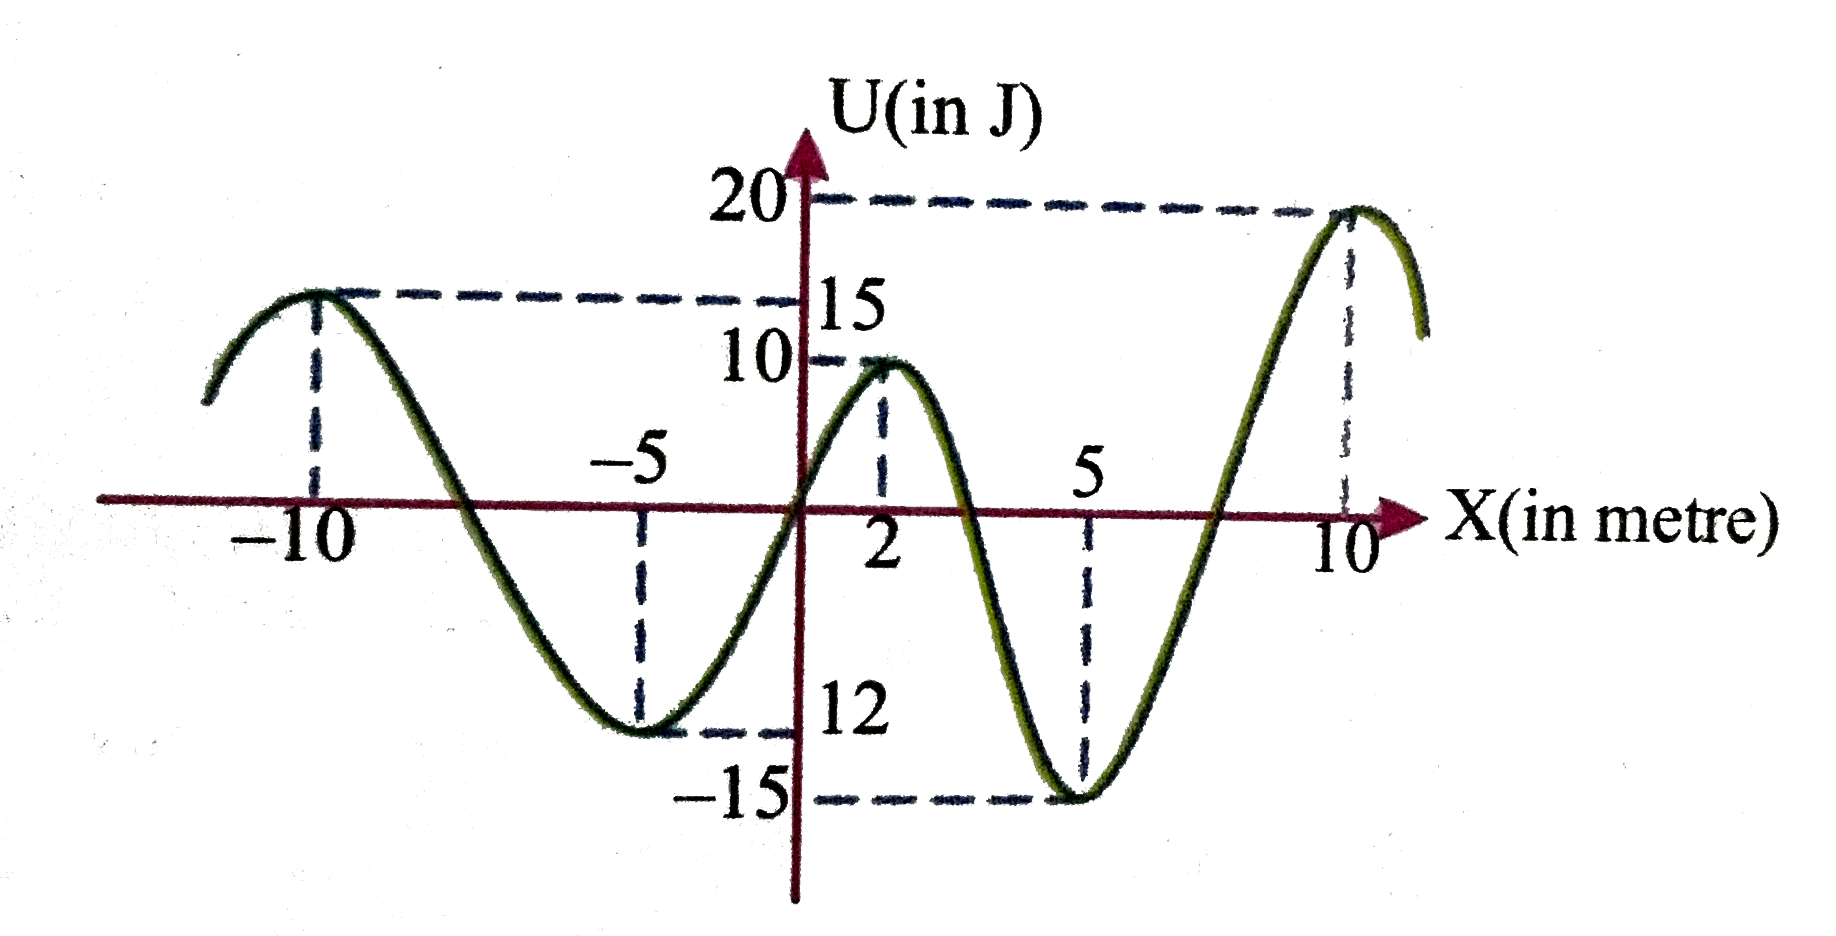
In the figure the variation of potential energy of a particle of mass m=2kg is represented w.r.t. its x-coordinate. The particle moves under the effect of this conservative force along the x-axis.

If the particle is released at the origin thenAit will move towards positive x-axis.Bit will move towards negative x-axis.Cit will remain stationary at the origin.Dits subsequent motion cannot be decided due to lack of information.An object of mass m is thrown vertically upwards. At what rate will its momentum change?
AmgBmg2C1mg2D1mg
Prove the law of conservation of energy for a particle performing simple harmonic motion. Hence graphically show the variation of kinetic energy and potential energy w.r.t. instantaneous displacement.
Two sound notes have wavelengths 83170mand83172m in the air. These notes when sounded together produce 8 beats per second. Calculate the velocity of sound in the air and frequencies of the two notes.
View SolutionWhat will be the instaneous acceleration of an object thrown upward, when it reaches maximum height?
View SolutionRepresent graphically the variation of kinetic energy (Ek), potential energy (Ek) and total energy (E ) of a body falling freely from a height h. At what height is Ep=Ek?
View SolutionShow graphically, the variation of the de-Broglie wavelength (λ) with the potential (V) through which an electron is accelerated from rest.
View SolutionShow graphically, the variation of the de-Broglie wavelength (λ) with the potential (V) through which an electron is accelerated from rest.
View Solution