At a constant pressure, of the following graphs that one which represents the variation of the density of an ideal gas with the absolute temperature T, is
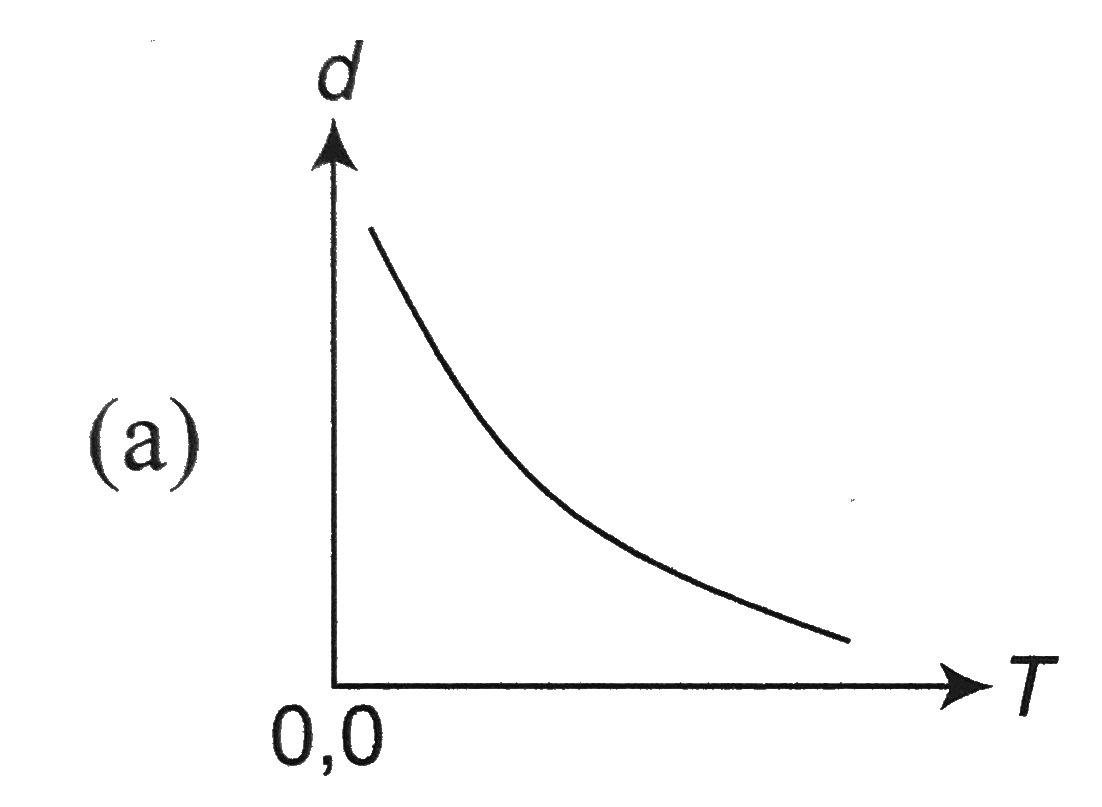
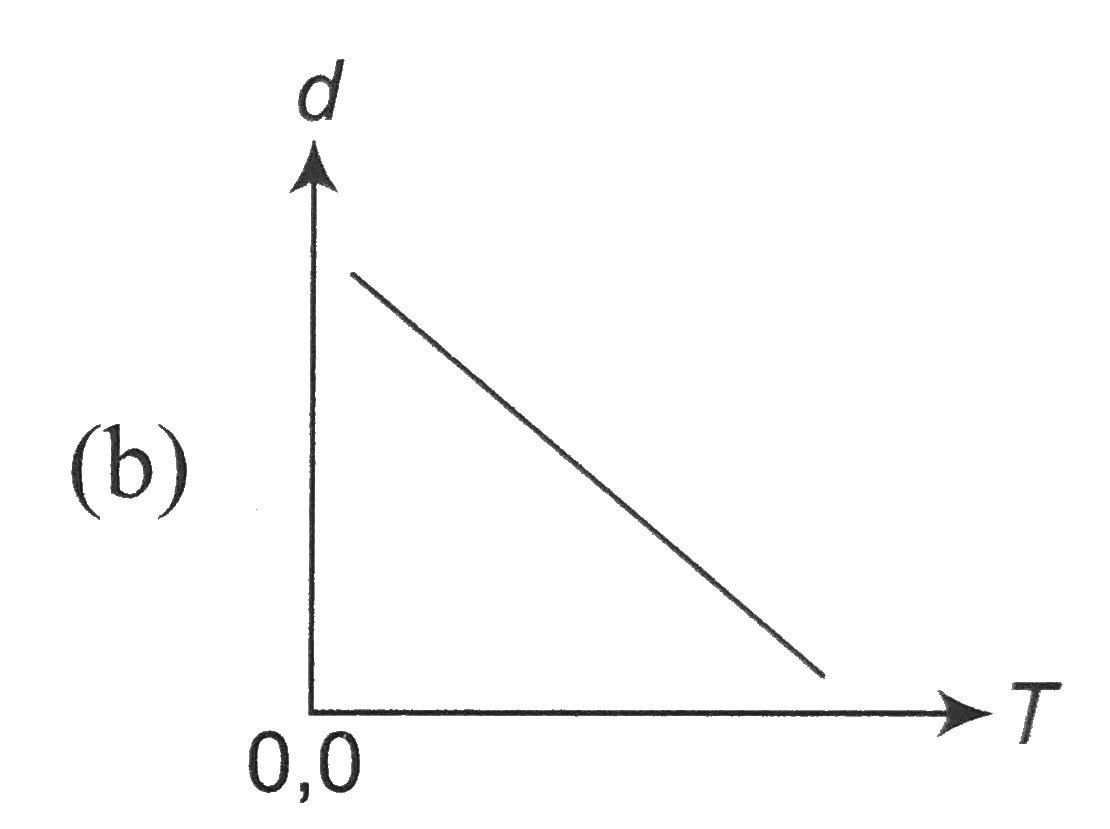
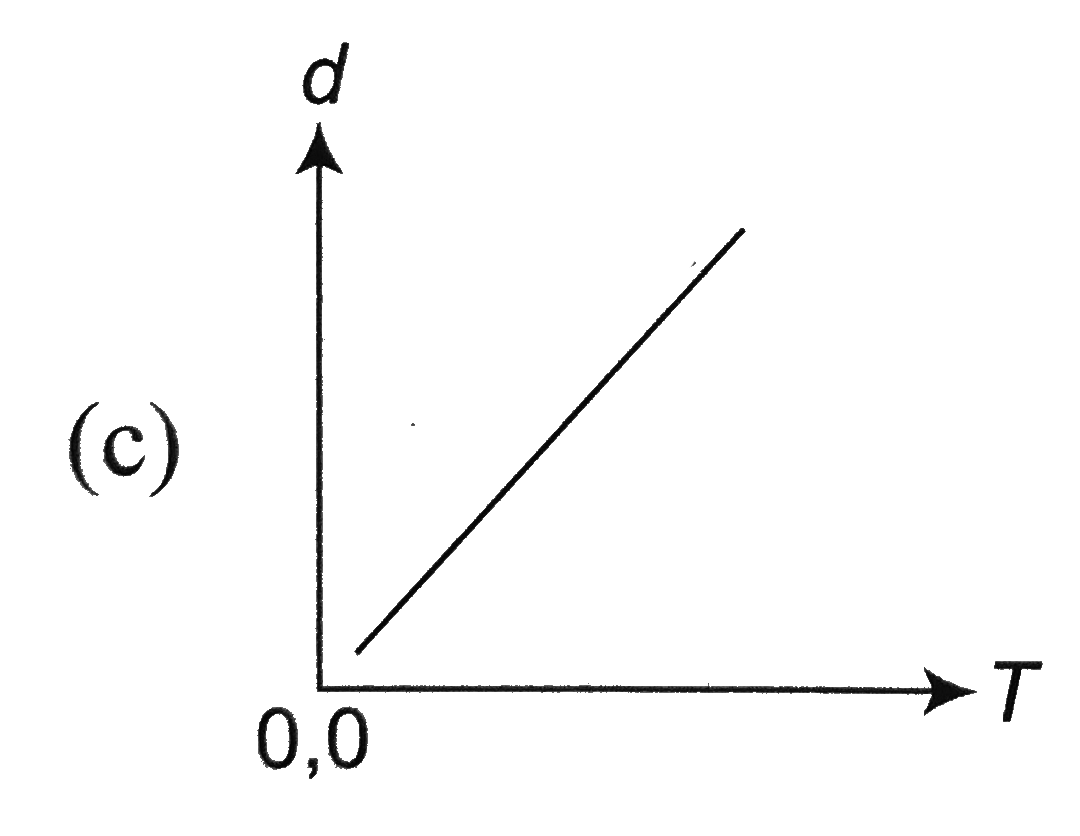
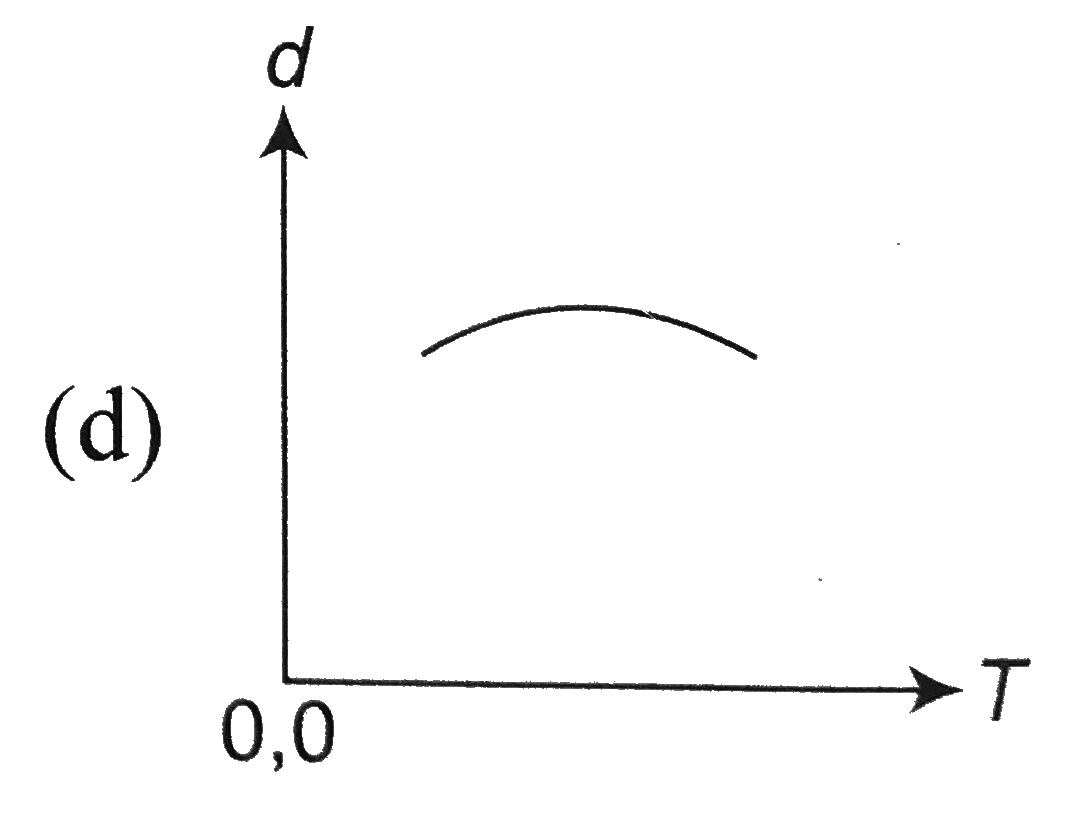
The correct Answer is:A
To solve the problem of how the density of an ideal gas varies with absolute temperature at constant pressure, we can follow these steps:
Step 1: Understand the Ideal Gas Law
The ideal gas law is given by the equation:
PV=nRT
Where:
- P = pressure
- V = volume
- n = number of moles
- R = universal gas constant
- T = absolute temperature
Step 2: Relate Density to the Ideal Gas Law
We can express the number of moles n in terms of density ρ and molar mass M:
n=mM
Where m is the mass of the gas. The volume V can be expressed in terms of density:
V=mρ
Substituting these into the ideal gas law gives:
P(mρ)=mMRT
Step 3: Simplify the Equation
Rearranging the equation, we can eliminate m (assuming it is not zero):
P=RTρM
From this, we can express density ρ:
ρ=PMRT
Step 4: Analyze the Relationship Between Density and Temperature
At constant pressure P:
ρ∝1T
This indicates that density ρ is inversely proportional to the absolute temperature T.
Step 5: Determine the Graphical Representation
Since density is inversely proportional to temperature, the graph of density ρ versus temperature T will be a hyperbolic curve that decreases as temperature increases. This is characteristic of an inverse relationship.
Conclusion
The correct graph representing the variation of density with absolute temperature at constant pressure will show a downward curve, indicating that as temperature increases, density decreases.
---
The ideal gas law is given by the equation:
PV=nRT
Where:
- P = pressure
- V = volume
- n = number of moles
- R = universal gas constant
- T = absolute temperature
We can express the number of moles n in terms of density ρ and molar mass M:
n=mM
Where m is the mass of the gas. The volume V can be expressed in terms of density:
V=mρ
Substituting these into the ideal gas law gives:
P(mρ)=mMRT
Rearranging the equation, we can eliminate m (assuming it is not zero):
P=RTρM
From this, we can express density ρ:
ρ=PMRT
At constant pressure P:
ρ∝1T
This indicates that density ρ is inversely proportional to the absolute temperature T.
Since density is inversely proportional to temperature, the graph of density ρ versus temperature T will be a hyperbolic curve that decreases as temperature increases. This is characteristic of an inverse relationship.
The correct graph representing the variation of density with absolute temperature at constant pressure will show a downward curve, indicating that as temperature increases, density decreases.
Topper's Solved these Questions
- KINETIC THEORY OF GASES AND THERMODYNAMICSBOOK - A2ZCHAPTER - KINETIC THEORY OF GASES AND THERMODYNAMICSEXERCISE - First Law Of Thermodynamics , Internal Energy And Work Done
55 Videos
- KINETIC THEORY OF GASES AND THERMODYNAMICSBOOK - A2ZCHAPTER - KINETIC THEORY OF GASES AND THERMODYNAMICSEXERCISE - Application Of First Law Of Thermodynamics In Different Situations
25 Videos
- KINETIC THEORY OF GASES AND THERMODYNAMICSBOOK - A2ZCHAPTER - KINETIC THEORY OF GASES AND THERMODYNAMICSEXERCISE - Chapter Test
29 Videos
- GRAVITATIONBOOK - A2ZCHAPTER - GRAVITATIONEXERCISE - Chapter Test
29 Videos
- MOCK TESTBOOK - A2ZCHAPTER - MOCK TESTEXERCISE - Motion With Constant Acceleration
15 Videos
Similar Questions
Knowledge Check
Which of the following expression represents correctly the variation of density of an ideal gas with change in temperature ?
Ad2=P2T1d1P1T2Bd2=d1T1T2Cd2=d1T2T1Dd2=d1P2T2P1T1Which of the following graphs correctly represents the variation of β=−(dV/dP)/V with P for an ideal gas at constant temperature?
A B
B C
C D
D
Which of the following graphs correctly represents the variation of β=−(dVdP)/V with P for an ideal gas at constant temperature
A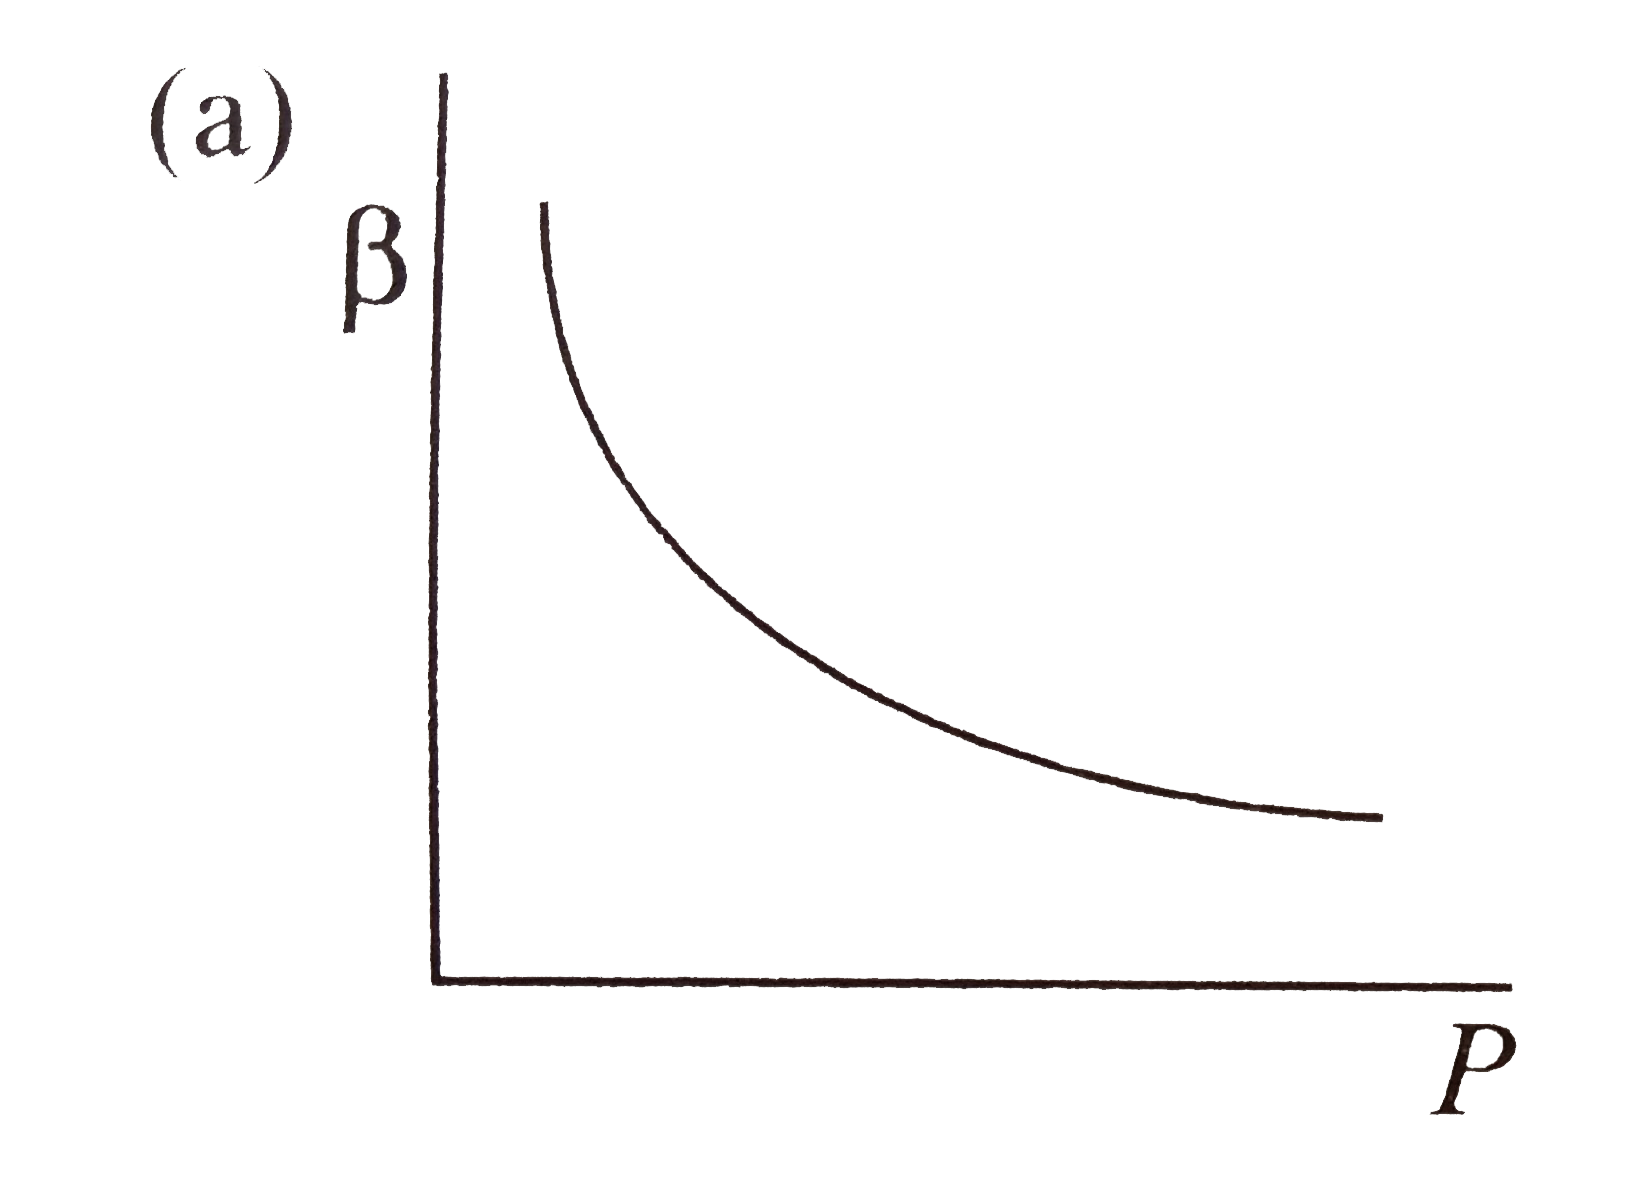 B
B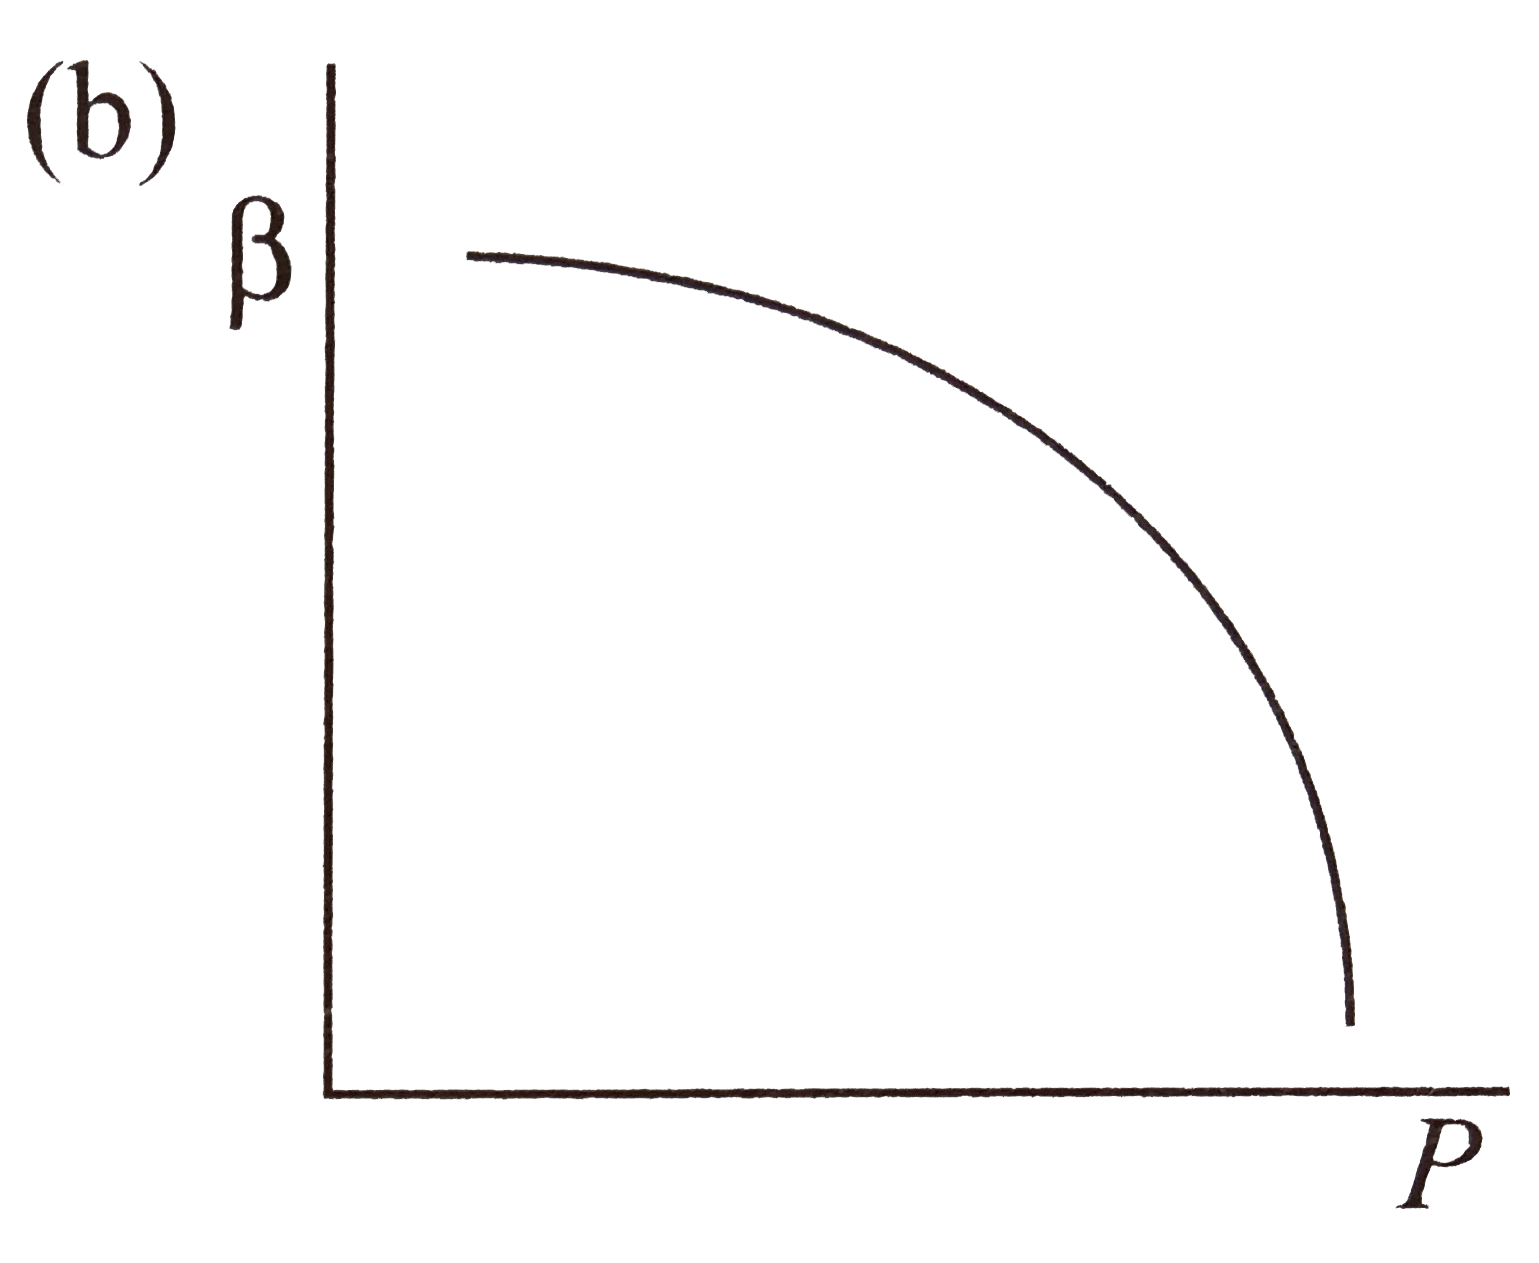 C
C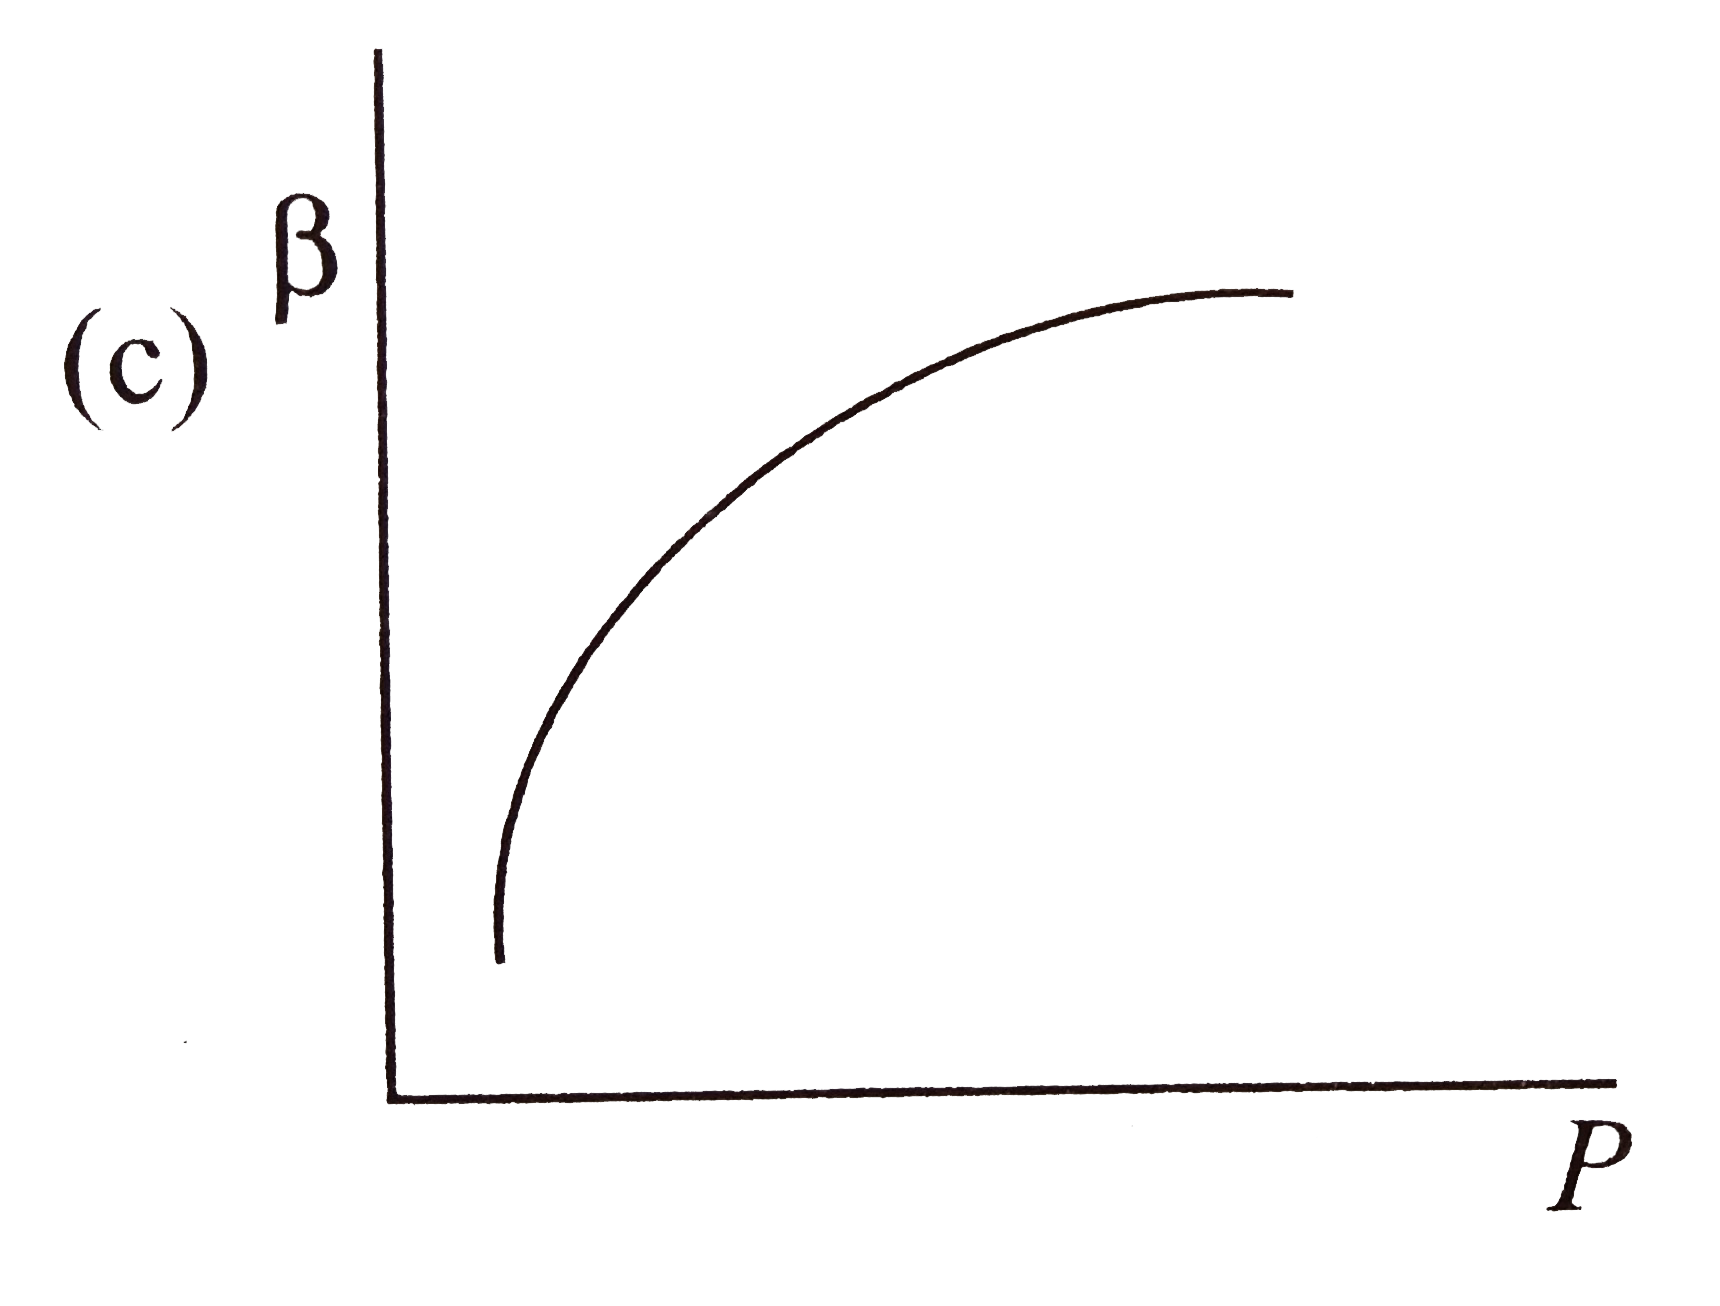 D
D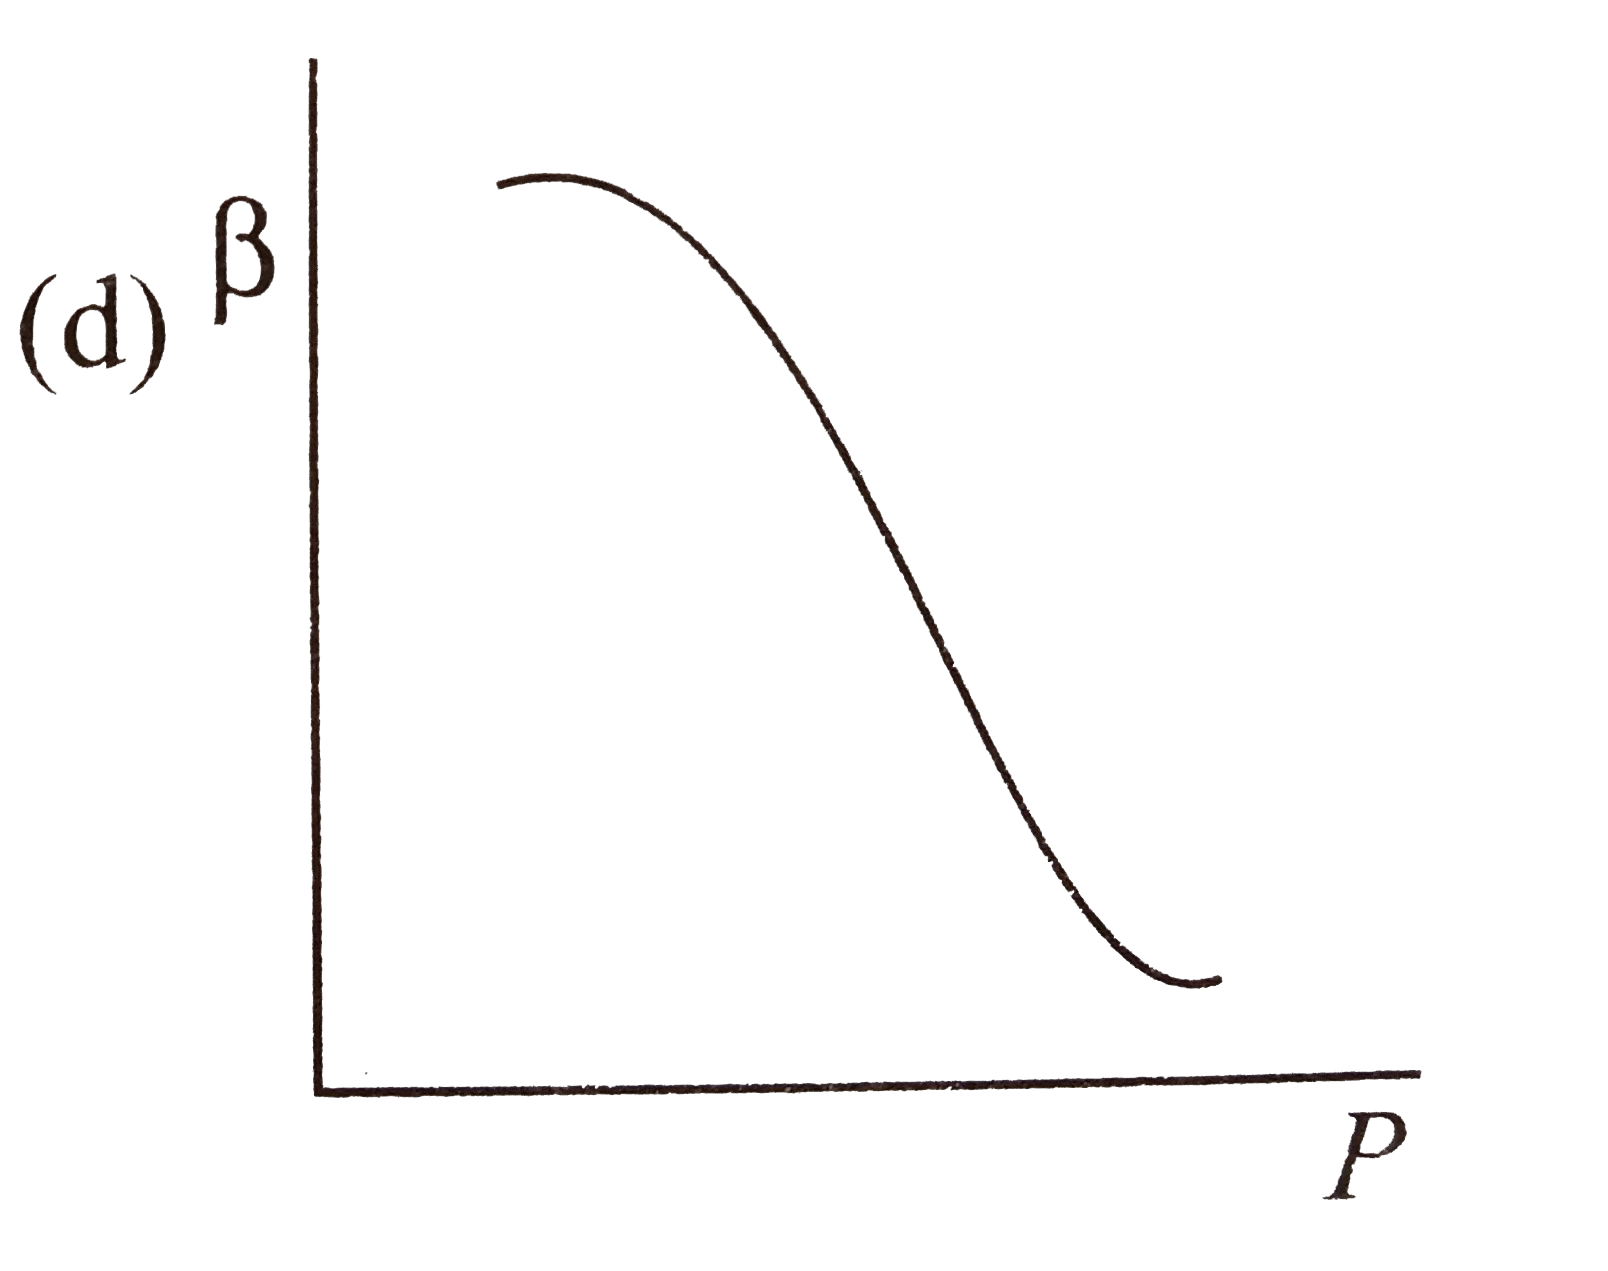
Which of the following graphs correctly represents the variation of β=−(dVdP)1V with P for an ideal gas at constant temperature ?
View Solutionwhich of the following graphs correctly represents the vatiation β=−(dVdP)T/V with P for an ideal gas at constant temperature ? .
View SolutionWhich of the following graphs represents the variation of activity (A) of a radioactive substance with time (t).
View SolutionWhich one of the following graphs represents the variation of surface tension of water with temperture for a small range of temperature ?
View SolutionWhich of the following is a graph of the relation of the density (ρ) of a gas sample to the absolute tempeature keeping constant pressure.
View Solution
