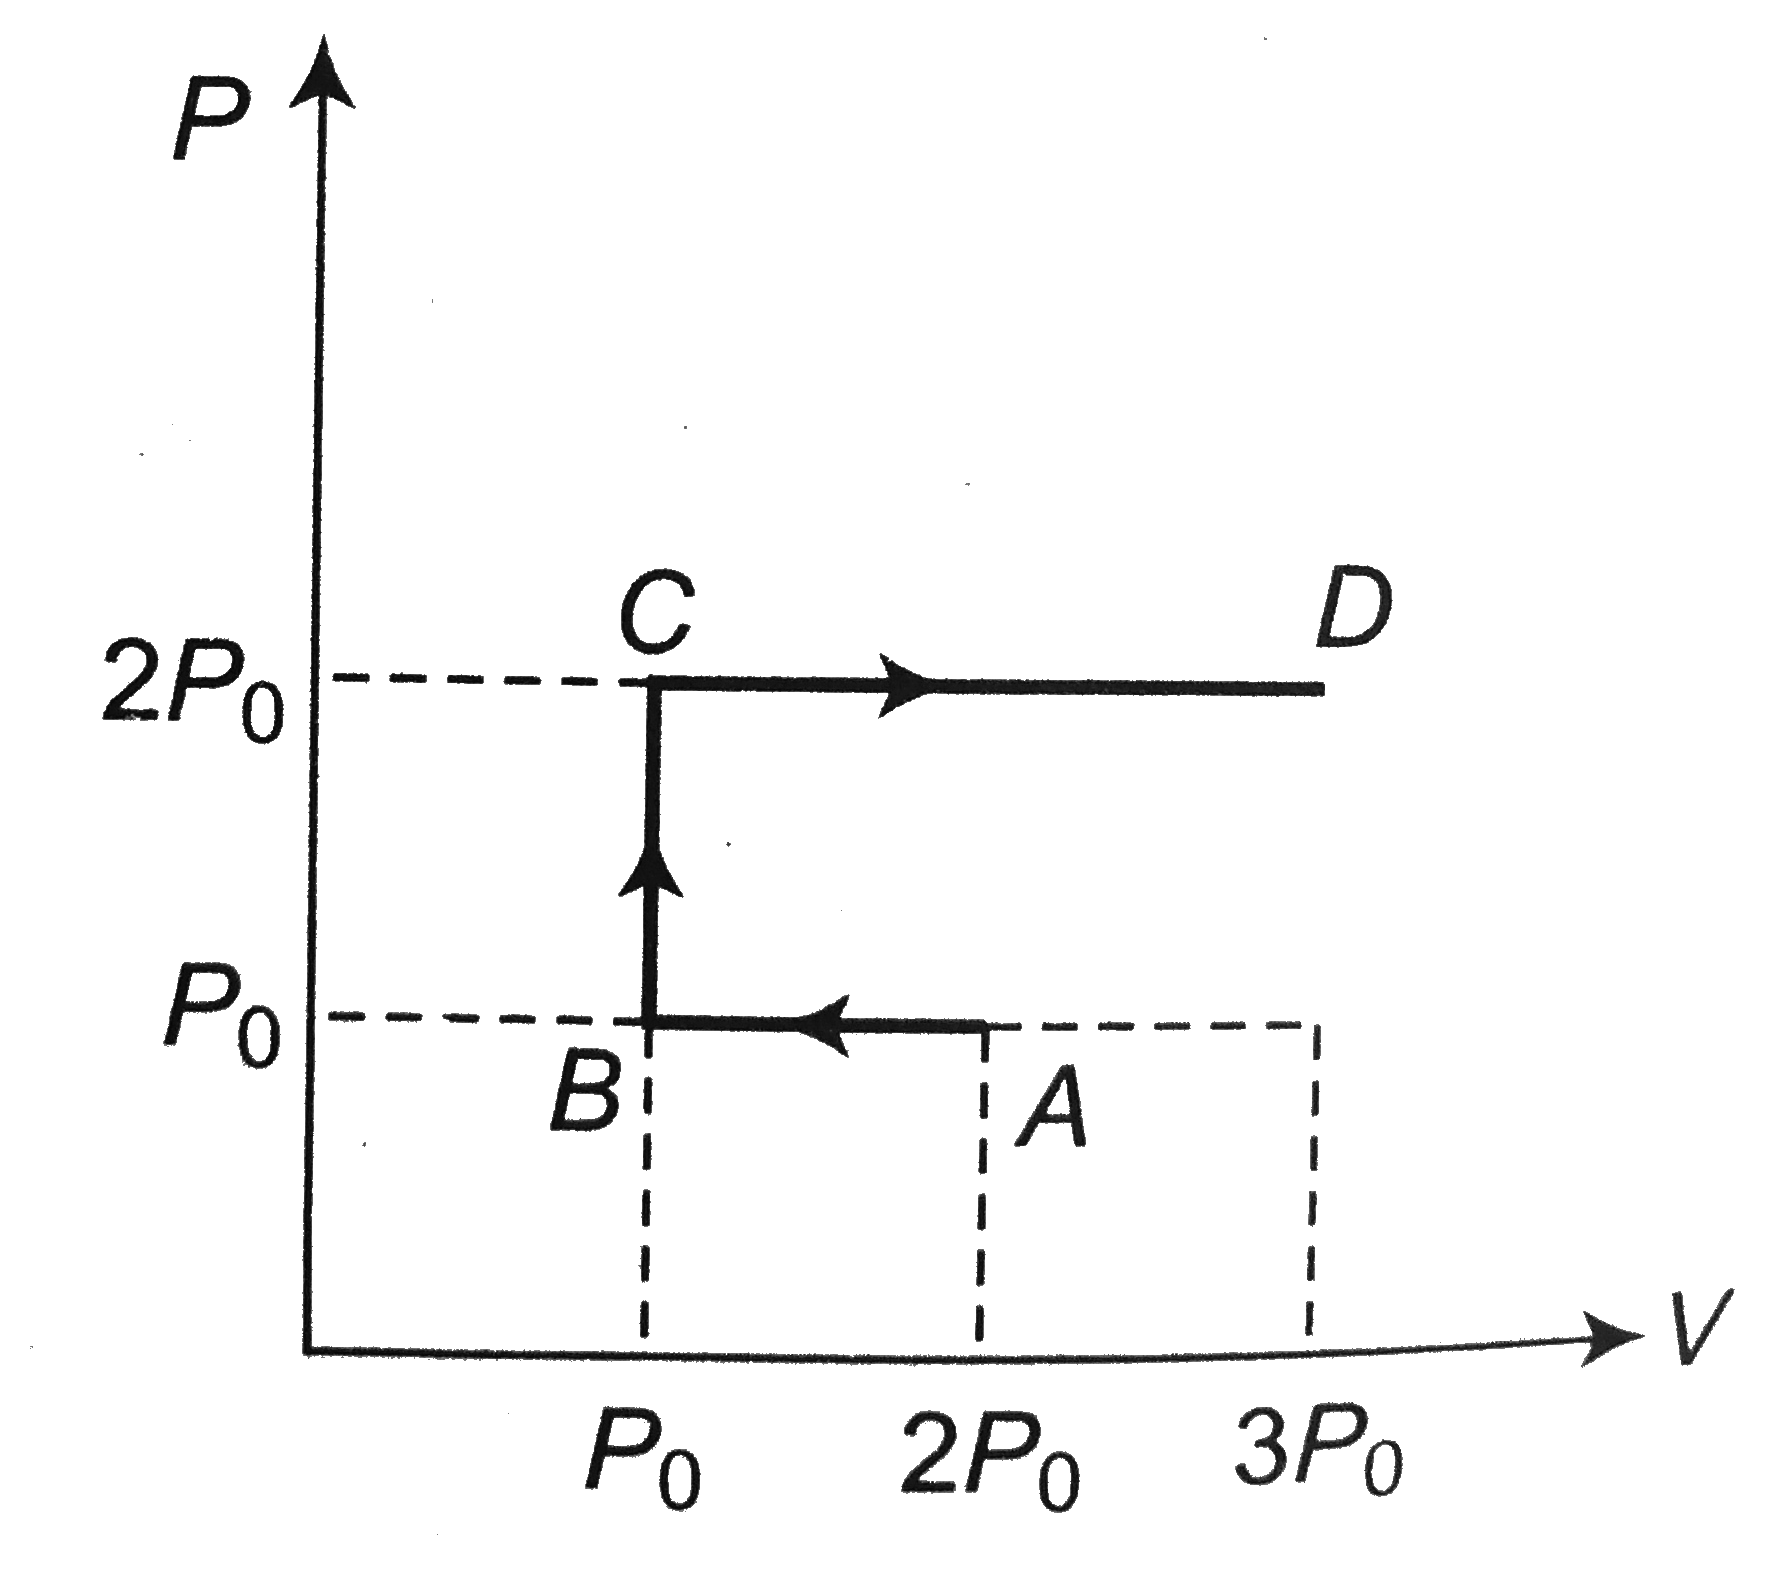
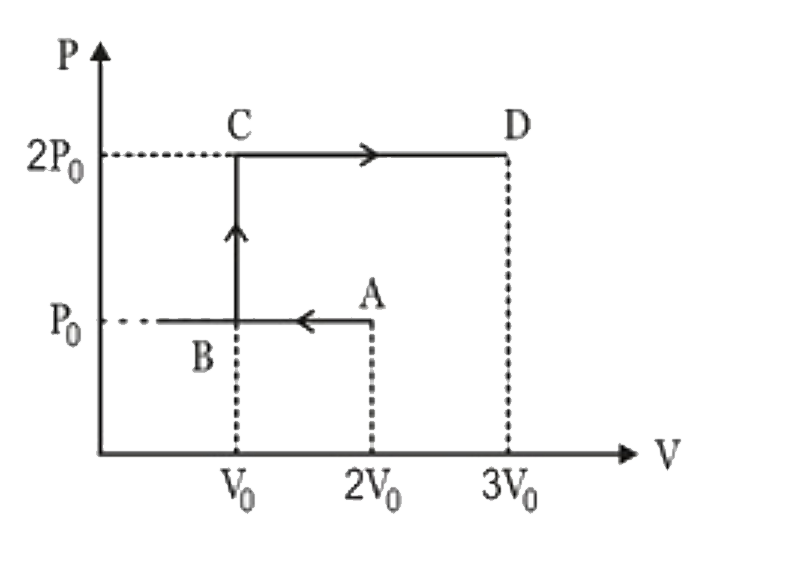
P−V diagram of an ideal gas is as shown in figure. Work done by the gas in process ABCD is
A
P0V0
B
2P0V0
C
3P0V0
D
P0V0
Video Solution
Text Solution
The correct Answer is:C
WAB=−P0V0
WBC=0
and WCD=4P0V0
∴WABCD=−P0V0+4P0V0
=3P0V0.
|
Updated on:21/07/2023
Topper's Solved these Questions
- BOOK - A2ZCHAPTER - KINETIC THEORY OF GASES AND THERMODYNAMICSEXERCISE - AIIMS Questions27videos
KINETIC THEORY OF GASES AND THERMODYNAMICS
- BOOK - A2ZCHAPTER - GRAVITATIONEXERCISE - Chapter Test29videos
GRAVITATION
- BOOK - A2ZCHAPTER - MOCK TESTEXERCISE - Motion With Constant Acceleration15videos
MOCK TEST
Similar Questions
Knowledge Check
- Question 1 - Select One
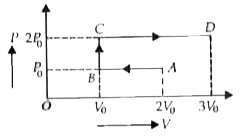
P-V diagram of an ideal gas is as shown in figure. Work done by the gas in the process ABCD is
 A4P0V0B2P0V0C3P0V0DP0V0
 - Question 2 - Select One
P−V diagram of an ideal gas is as shown in figure. Work done by the gas in process ABCD is
 A4p0V0B2p0V0C3p0V0Dp0V0
 - Question 3 - Select One
P – V graph of an ideal gas is as shown in the diagram . Work done by the gas in the process ABCD is
 A4P0V0B2P0V0C3P0V0DP0V0
graph of an ideal gas is as shown in figure.
Work done by the gas in complete cyclic process about isView SolutionThe process on an ideal gas, shown in figure,is <br><imga≤ocr_imageload∈g=lazysrc=https://d10lpgp6xz60nq.cloudfront.net/physics_imagesHCV_VOL2_C24_E01_027_Q01.pngwh=80%mx-autosty≤=background:white;>
View SolutionFind work done by the gas in the process shown in figure :
 View Solution
Find work done by the gas in the process shown in figure.
 View Solution
The P-V diagram for an ideal gas is shown in figure.
Out of the following diagrams which one represents the T-P diagram ?View Solution


