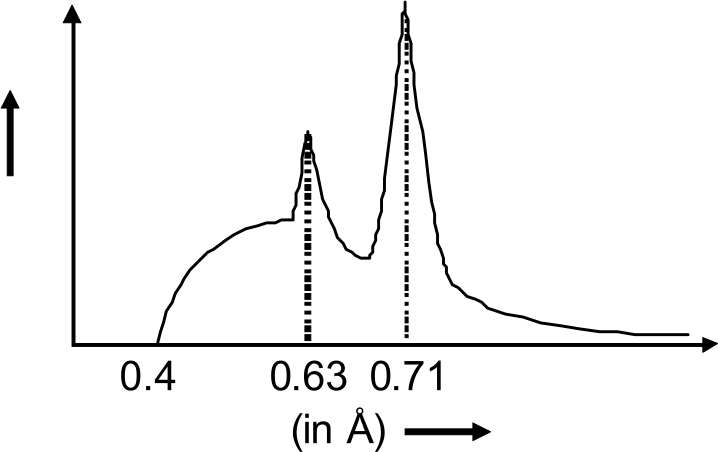
Figure shows intensity versus wavelength graph of X-rays coming from coolidge-tube with molybdenum as target element :

The two peaks shown in graph correspond to Kα and Kβ X-rays
Wavelength of Lα X-rays from Coolidge tube will be (approximatly)
A
5.60 Å
B
4.26 Å
C
0.33 Å
D
1.34 Å
Video Solution
Text Solution
NA
|
Updated on:21/07/2023
Topper's Solved these Questions
Similar Questions
Knowledge Check
- Question 1 - Select One
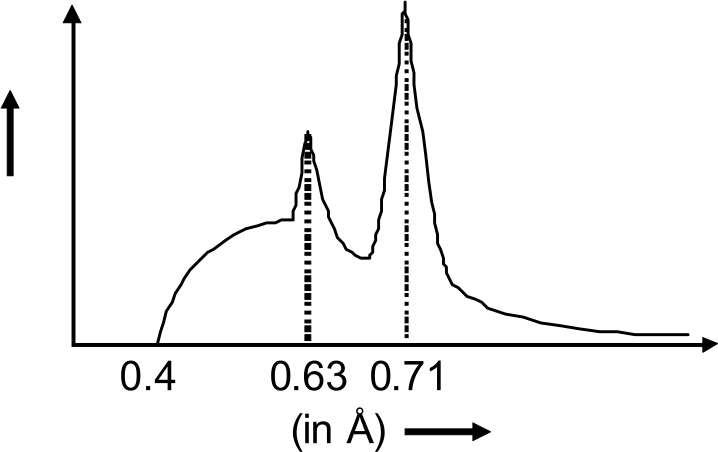
Figure shows intensity versus wavelength graph of X-rays coming from coolidge-tube with molybdenum as target element :

The two peaks shown in graph correspond to Kα and Kβ X-rays
Voltage applied across Coolidge tube is (approximatly)A20 kVB16 kVC31 kVD18 kV - Question 2 - Select One
The X- rays beam coming from an X- rays tube will be
AmonuchromaticBhaving all wavwlength smaller than a cortain maximum wavelengthChaving all wavwlength largest than a cortain maximum wavelengthDhaving all wavwlength lying between a minimum and a maximum wavelength - Question 3 - Select One
The X-ray beam coming from an X-ray tube
Ais monochromaticBhas all wavelengths smaller than a certain maximum wavelengthChas all wavelengths greater than a certain minimum wavelenthDhas all wavelengths lying between a minimum and a maximum wavelength
Consider a photon of continuous X-ray coming from a Coolidge tube. Its energy comes from
View SolutionIn X-ray experiment Kα,Kβ denotes
View SolutionThe energy of a photon of characteristic X-ray from a Coolidge tube comes from
View SolutionThe shorted wavelength of X- rays emitted from an X- rays tube depends on
View SolutionTo produce hard X-rays in Coolidge tube, we should increase
View Solution

