Which of the following diagrams represent the veriation of electric field vector with time for a circularly polarised light
A
(a) 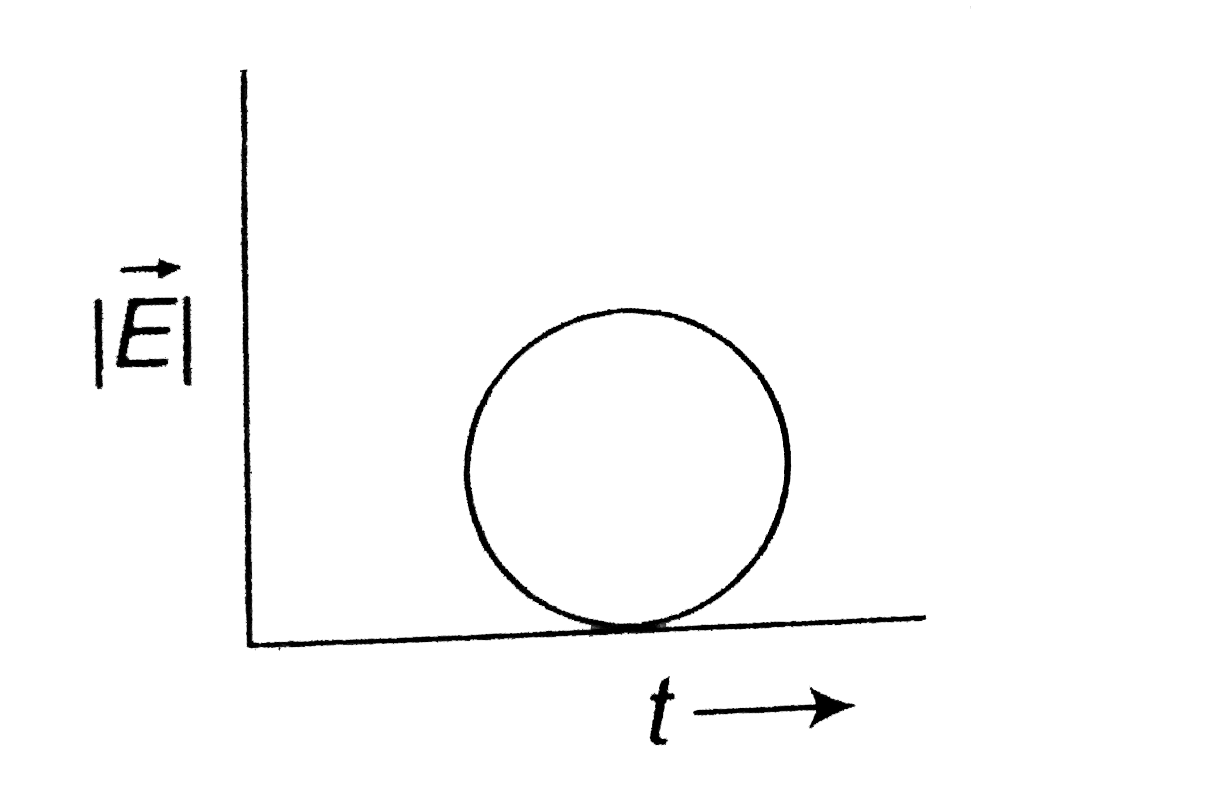
B
(b) 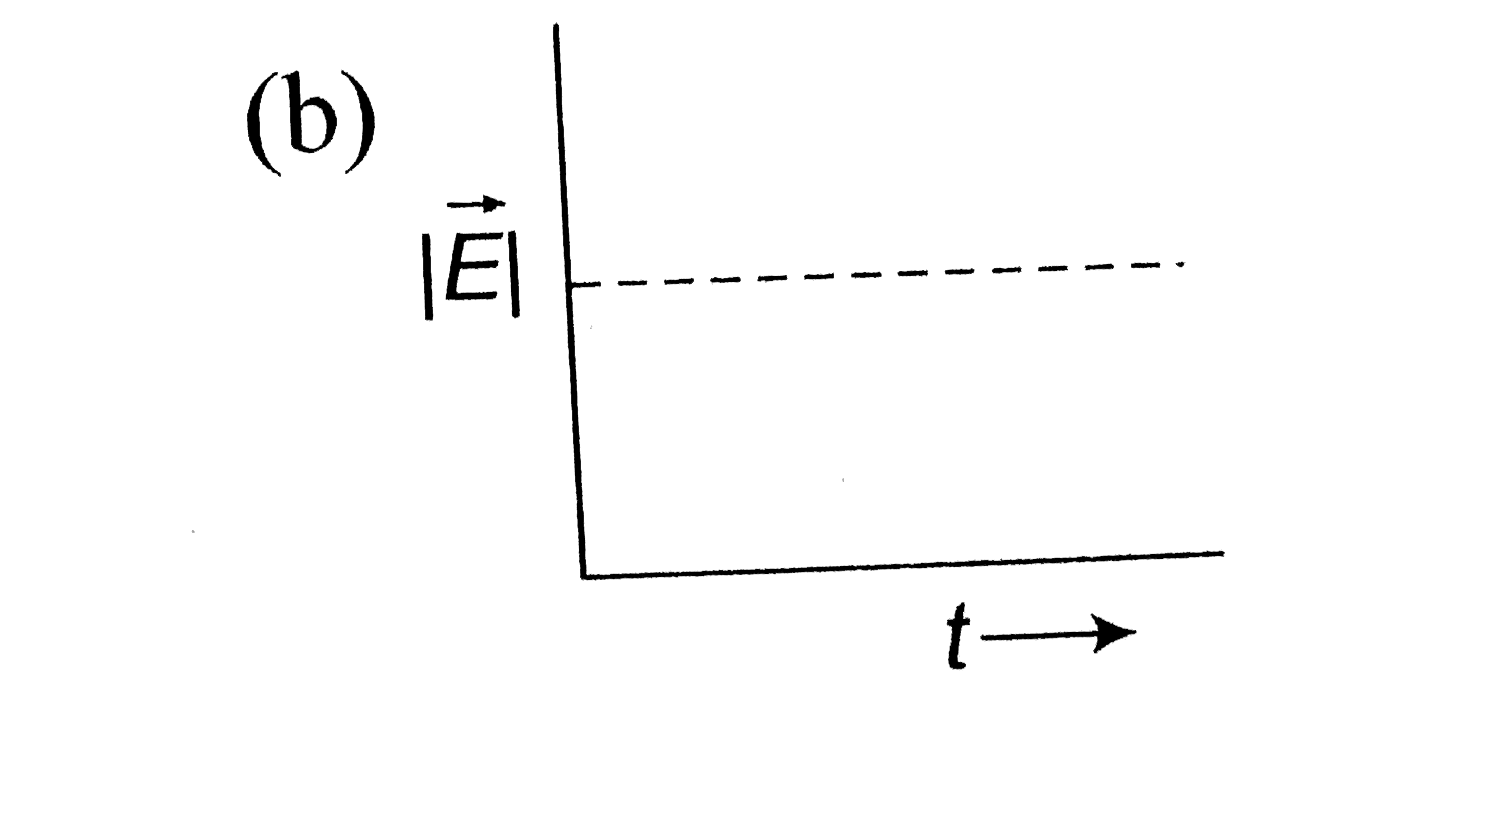
C
(c) 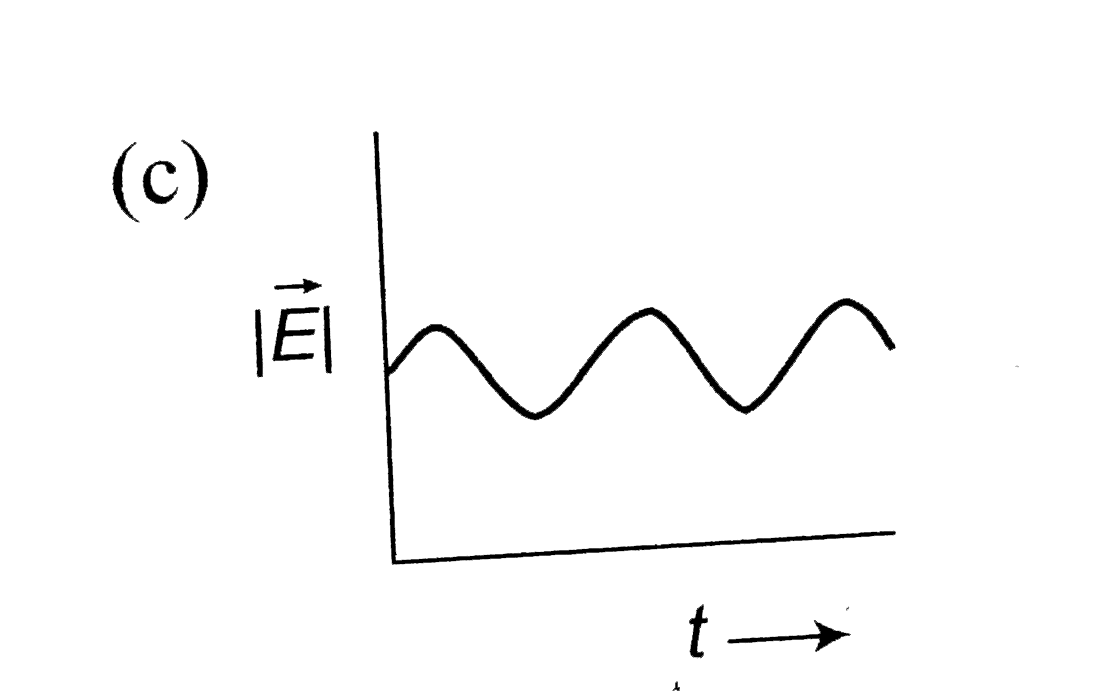
D
(d) 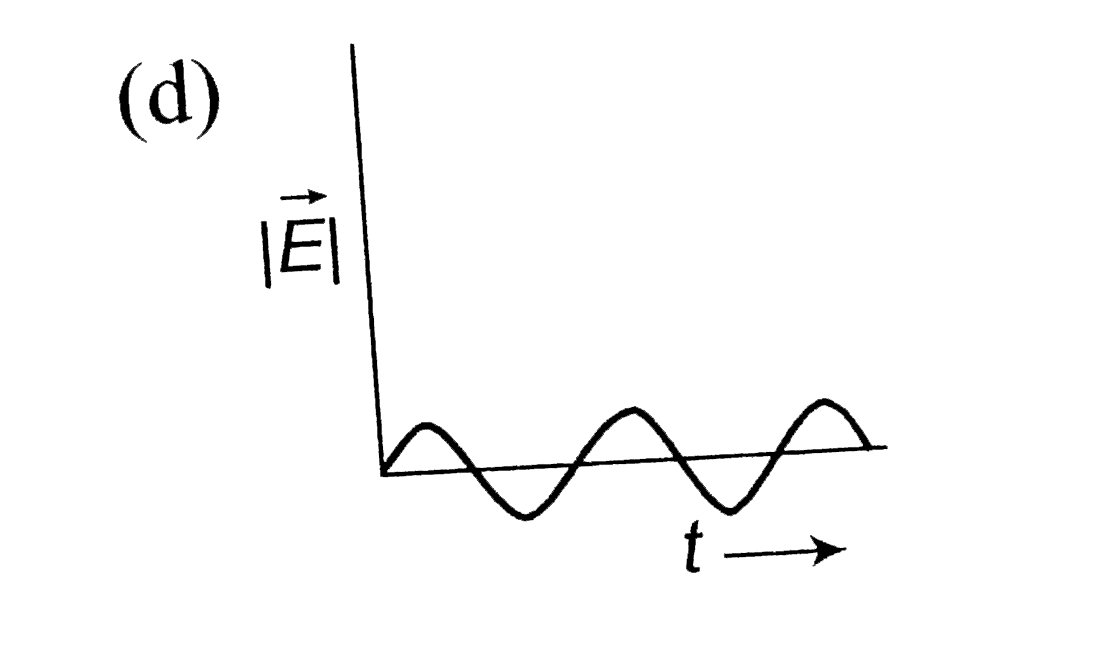
Video Solution
Text Solution
The correct Answer is:B
When two plane-polarised waves are superimposed, then under certain conditions, the resultant light vector rotates with a constant magnitude in a plane perpendicular to the direction of propagation. The tip of the vector traces a circle and the light is said to be circulary polarised.
To form circulary polarised that
Ex=E0sinωt
Ey=E0cosωt=E0sin(ωt+π2)
where E0 is amplitude.
Resultant amplitude
∣∣→E∣∣2=E0+E0+2E0.E0cosπ2
∣∣→E∣∣=E0√2=constant
Hence, the correct graph will be (a).
|
Updated on:21/07/2023
Topper's Solved these Questions
- BOOK - A2ZCHAPTER - WAVE OPTICSEXERCISE - Assertion Reason16videos
WAVE OPTICS
- BOOK - A2ZCHAPTER - WAVE OPTICSEXERCISE - Section D - Chapter End Test29videos
WAVE OPTICS
- BOOK - A2ZCHAPTER - WAVE OPTICSEXERCISE - AIPMT/NEET Questions22videos
WAVE OPTICS
- BOOK - A2ZCHAPTER - SOURCE AND EFFECT OF MAGNETIC FIELDEXERCISE - Section D - Chapter End Test30videos
SOURCE AND EFFECT OF MAGNETIC FIELD
Similar Questions
Knowledge Check
- Question 1 - Select One
Which of the following diagrams represent the variation of electric field vector with time for a circularly polarised light ?
A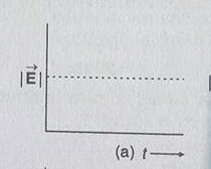 B
B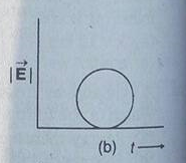 C
C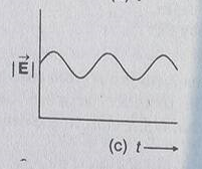 D
D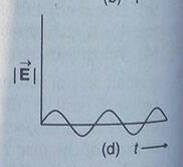
- Question 2 - Select One
Which of the following diagrams represent the variation of electric field vector with time for a circularly polarised light ?
A B
B C
C D
D
- Question 3 - Select One
Which of the following diagram represents the variation of electric field vector with time for a circularly polarised light?
A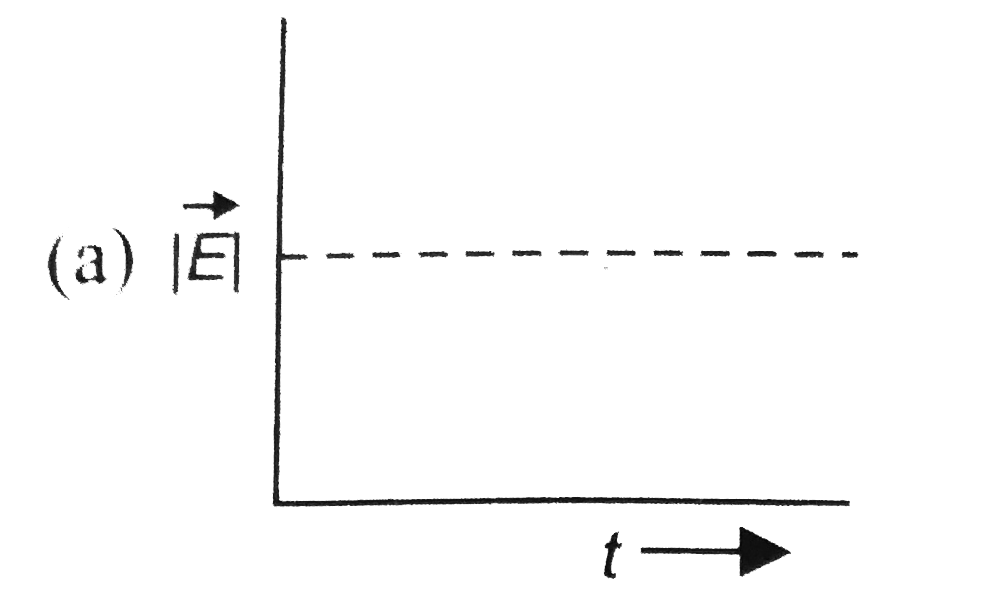 B
B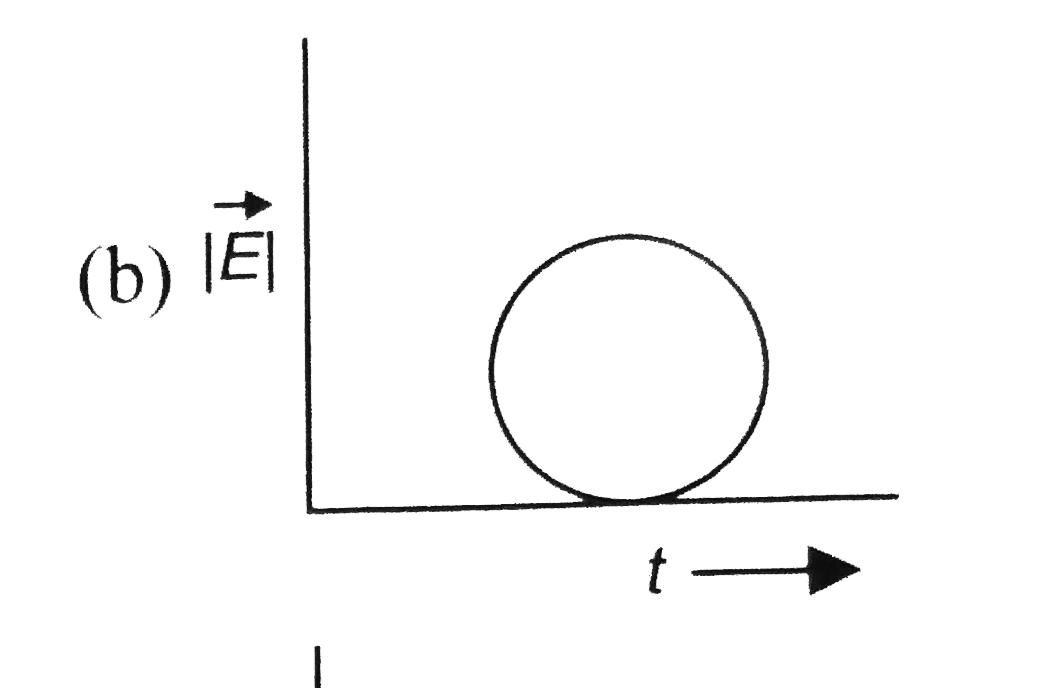 C
C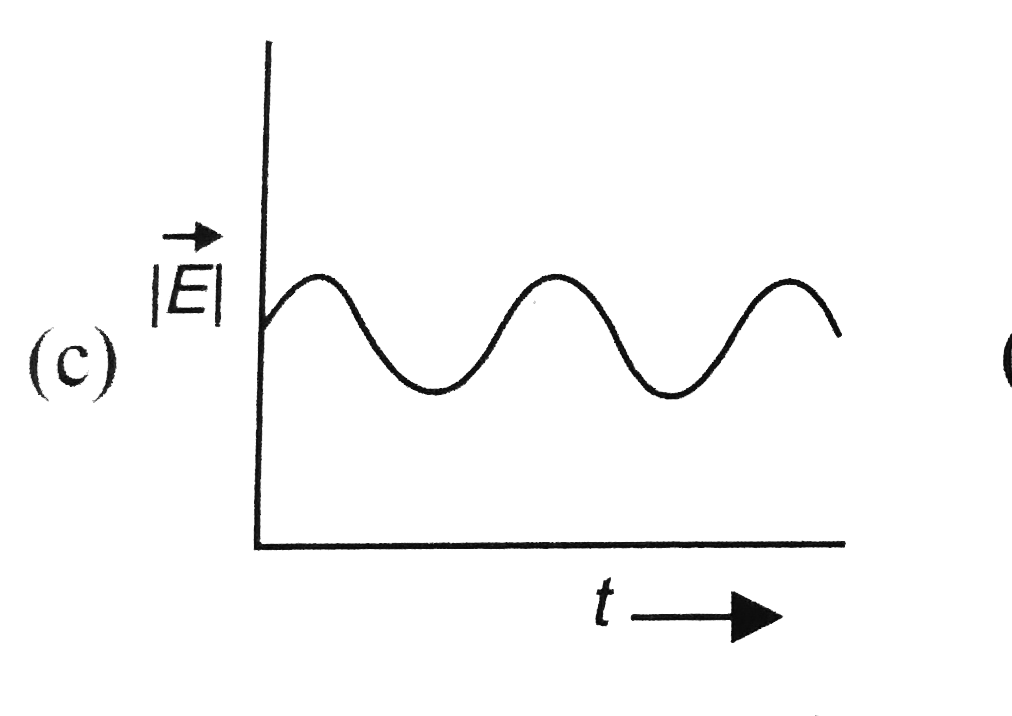 D
D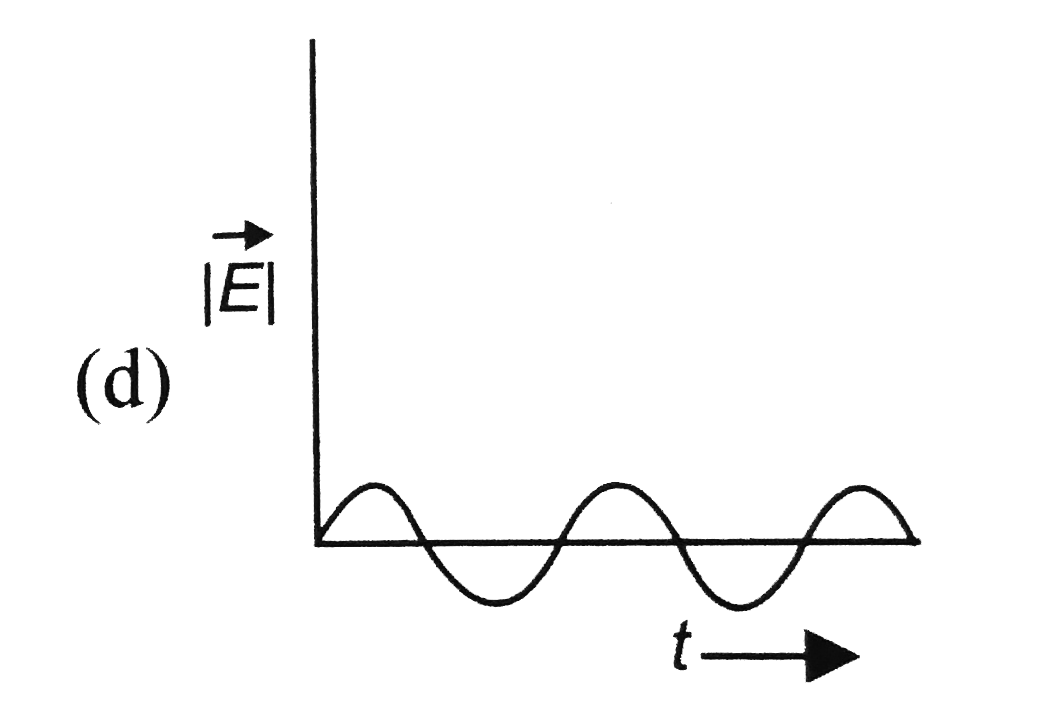
Which of the following represents a unit vector ?
View SolutionWhich of the following represents a vector ?
View SolutionWhich of the following represents electric polarisation ?
View SolutionWhich of the following diagram represent the situation of 'Expansion in Demand' ?
View SolutionWhich one of the following diagrams represents the placentation in Dianthus
View Solution
