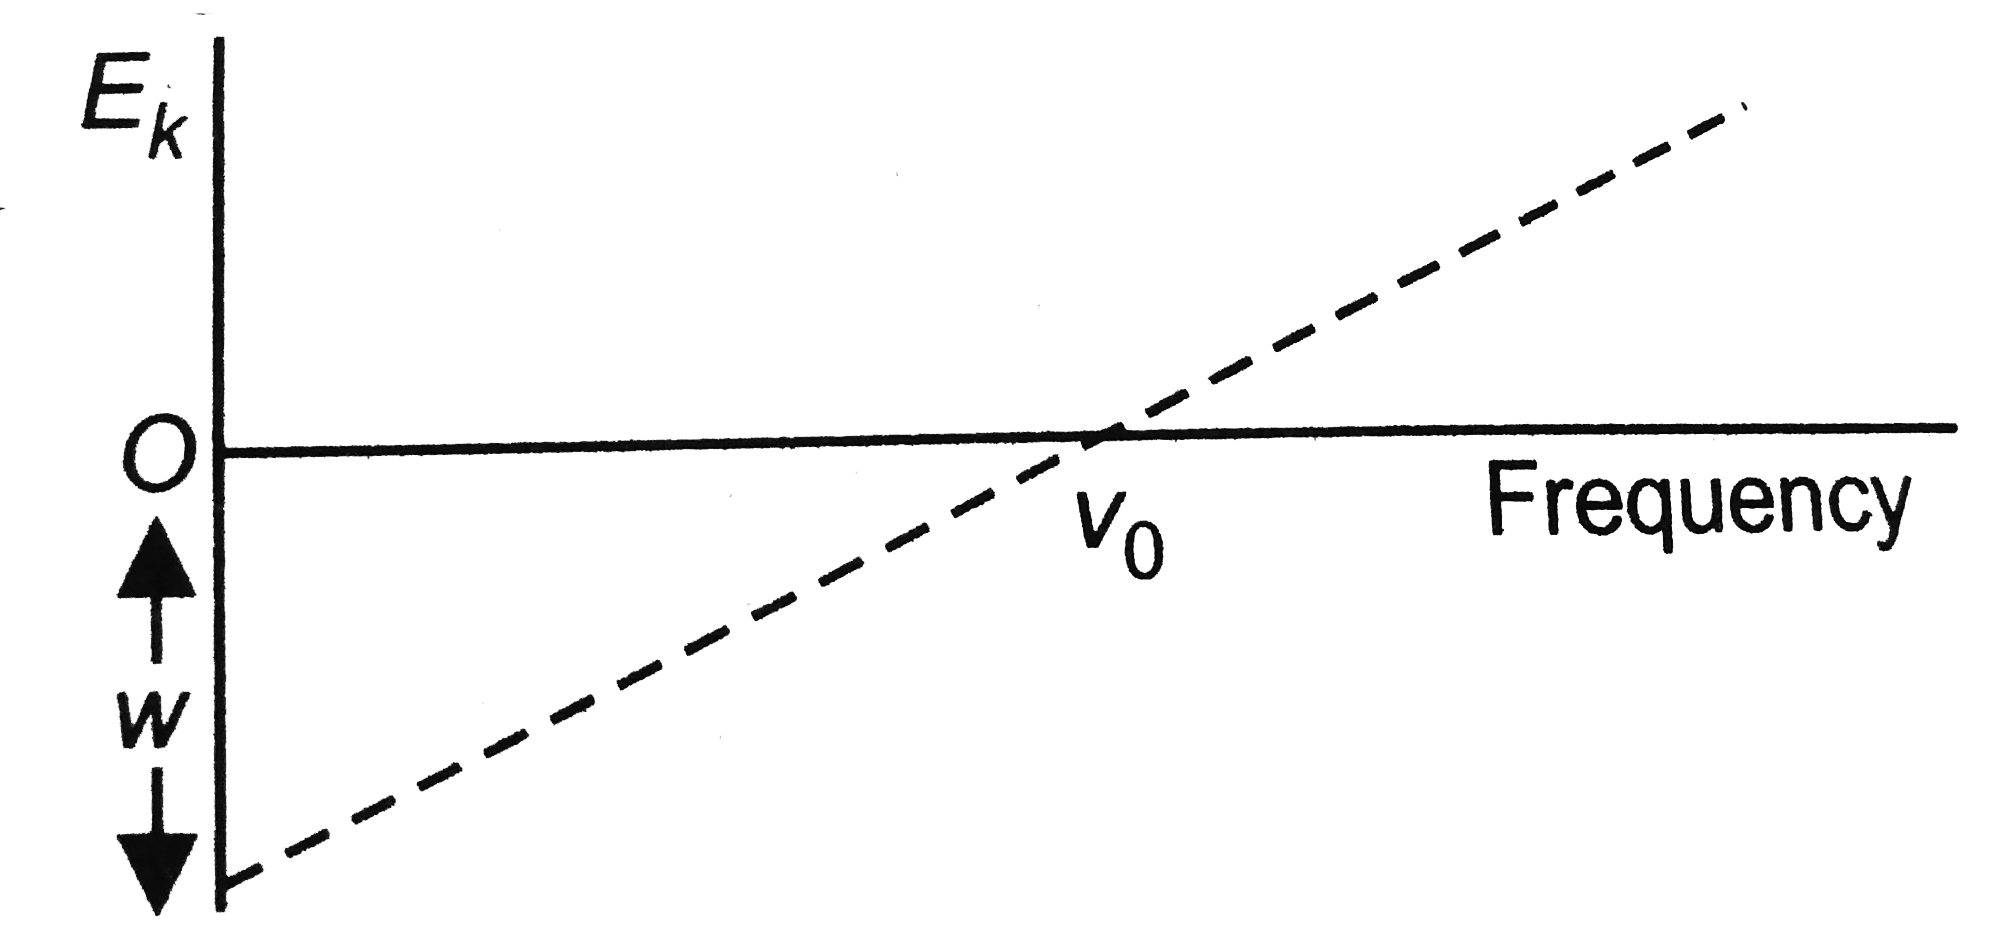
The correct graph respectivley the relation between energy (E) of photoelectrons and frequency v of incident light is
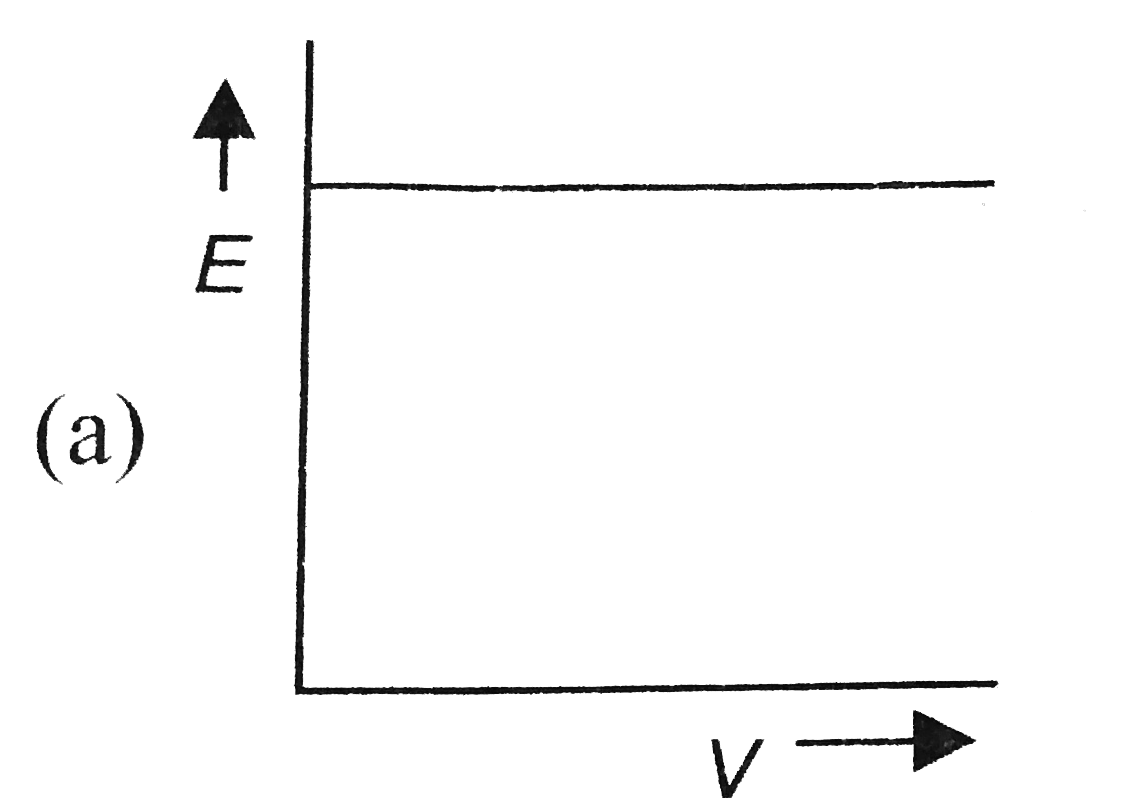
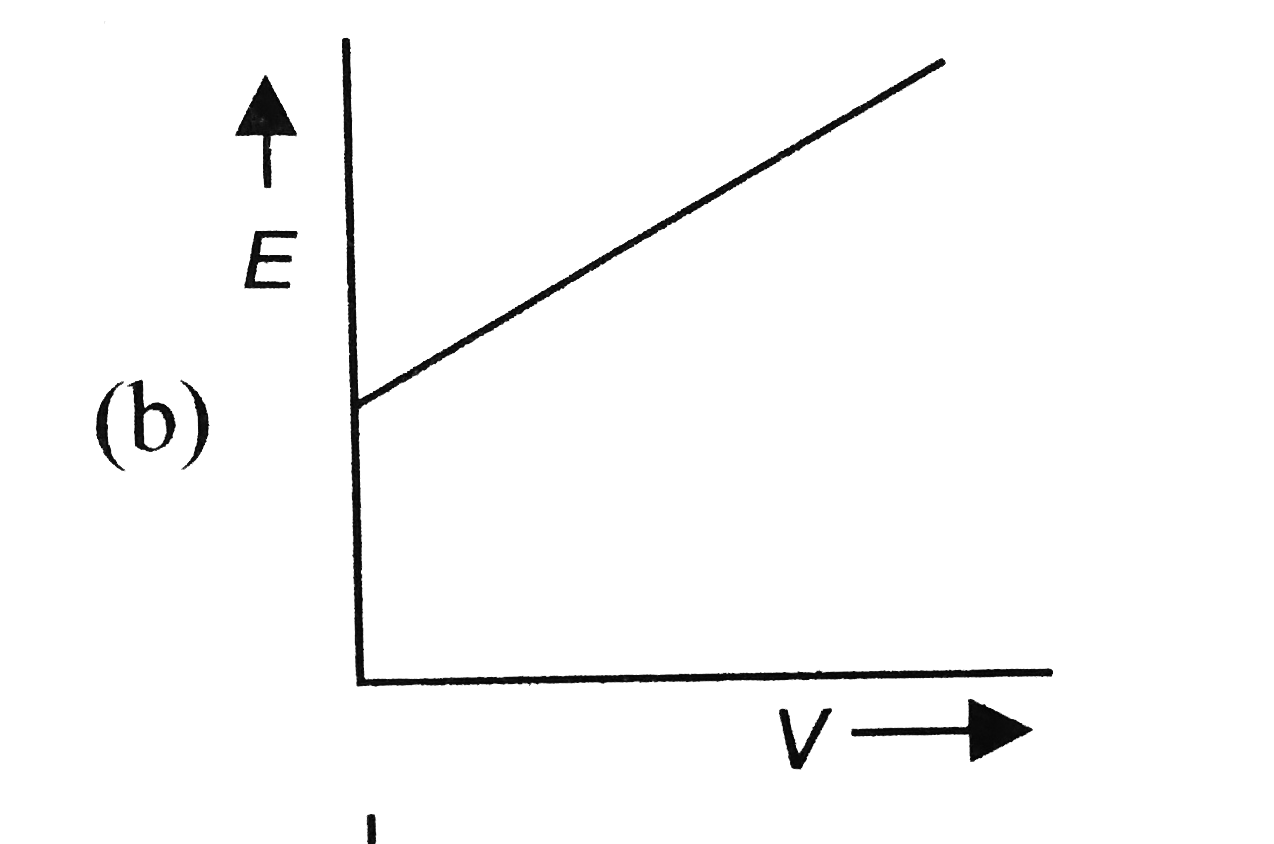
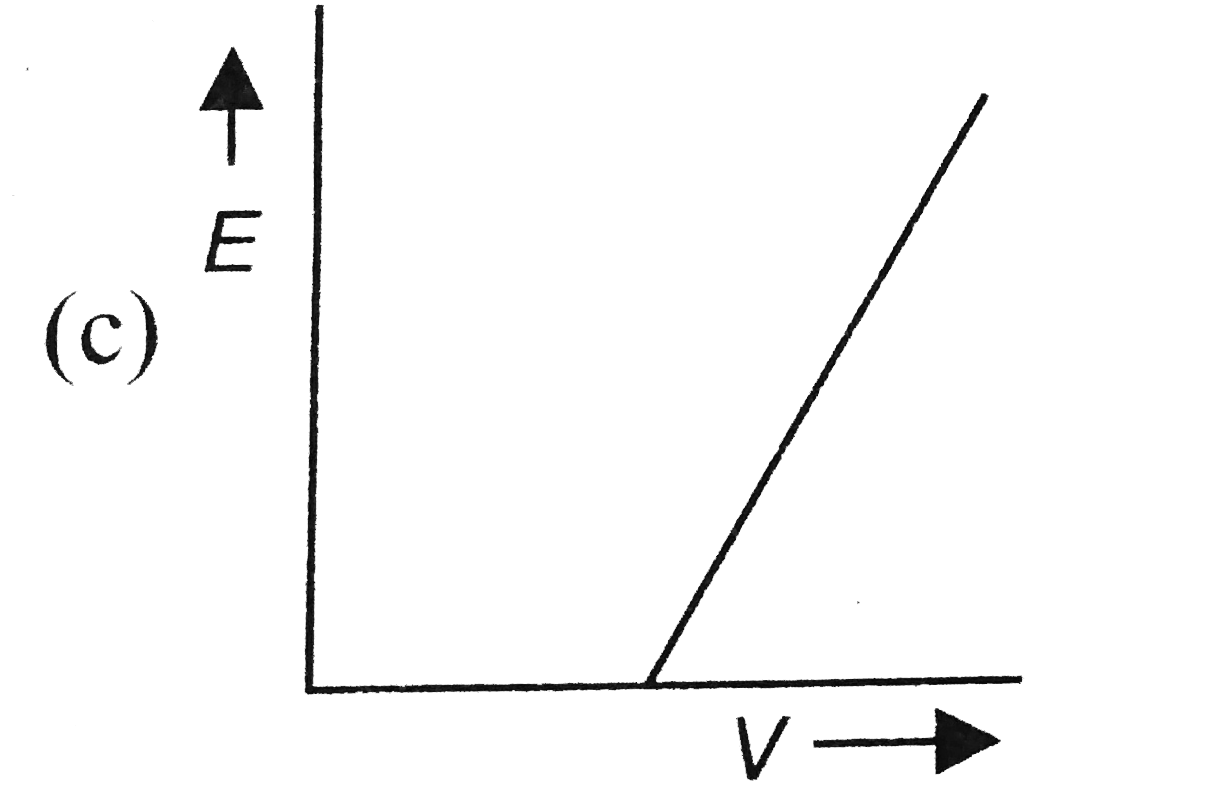
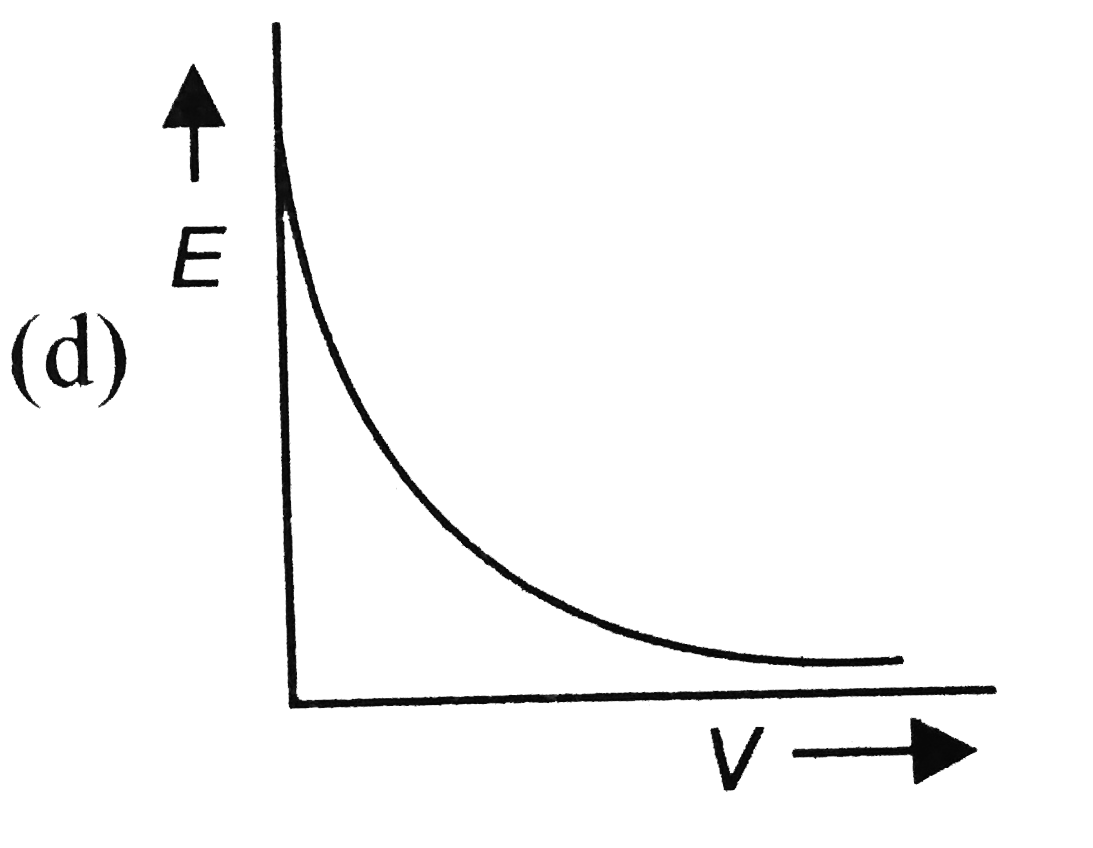
The correct Answer is:c
If using light of difference frequencies a graph is plotted between the maximum kinetic energy Ek of the photoelectron and frequency V of light, then straight line is obtained, according to relationEk=hv0−w, where w is the intercept cut by straight line on negative Ek-axis
Topper's Solved these Questions
- BOOK - A2ZCHAPTER - MOCK TESTEXERCISE - Mock Test 245videos
MOCK TEST
- BOOK - A2ZCHAPTER - MOCK TESTEXERCISE - Mock Test 344videos
MOCK TEST
- BOOK - A2ZCHAPTER - MAGNETISM AND MATTEREXERCISE - Section D - Chapter End Test30videos
MAGNETISM AND MATTER
- BOOK - A2ZCHAPTER - NUCLEAR PHYSICSEXERCISE - Section D - Chapter End Test29videos
NUCLEAR PHYSICS
Similar Questions
Knowledge Check
- Question 1 - Select One
The graph between the energy of photoelectrons E and the wavelength of incident light (λ) is
A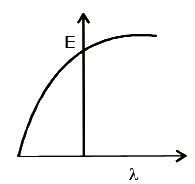 B
B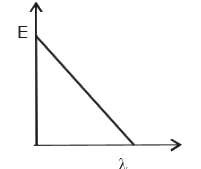 C
C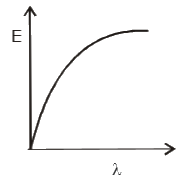 D
D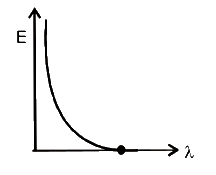
- Question 2 - Select One
According to Einstein's photoelectric equation, the graph between the kinetic energy of photoelectrons ejected and the frequency of incident radiation is
A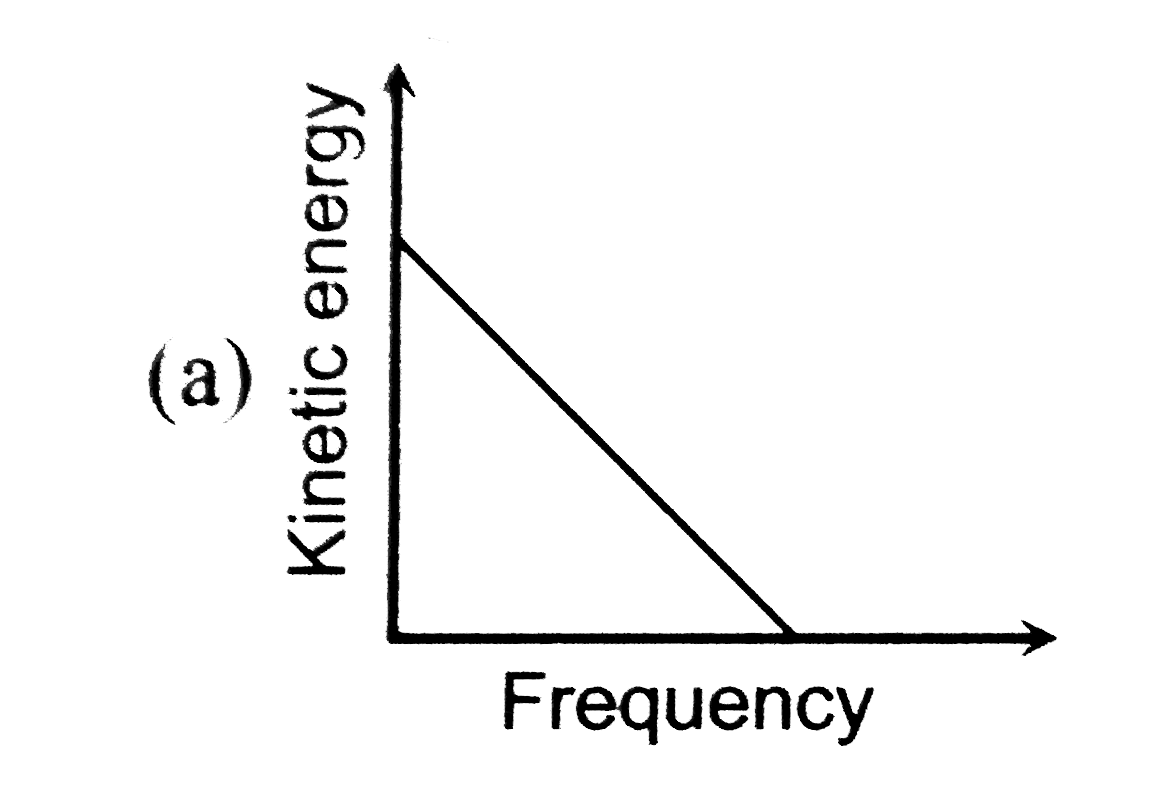 B
B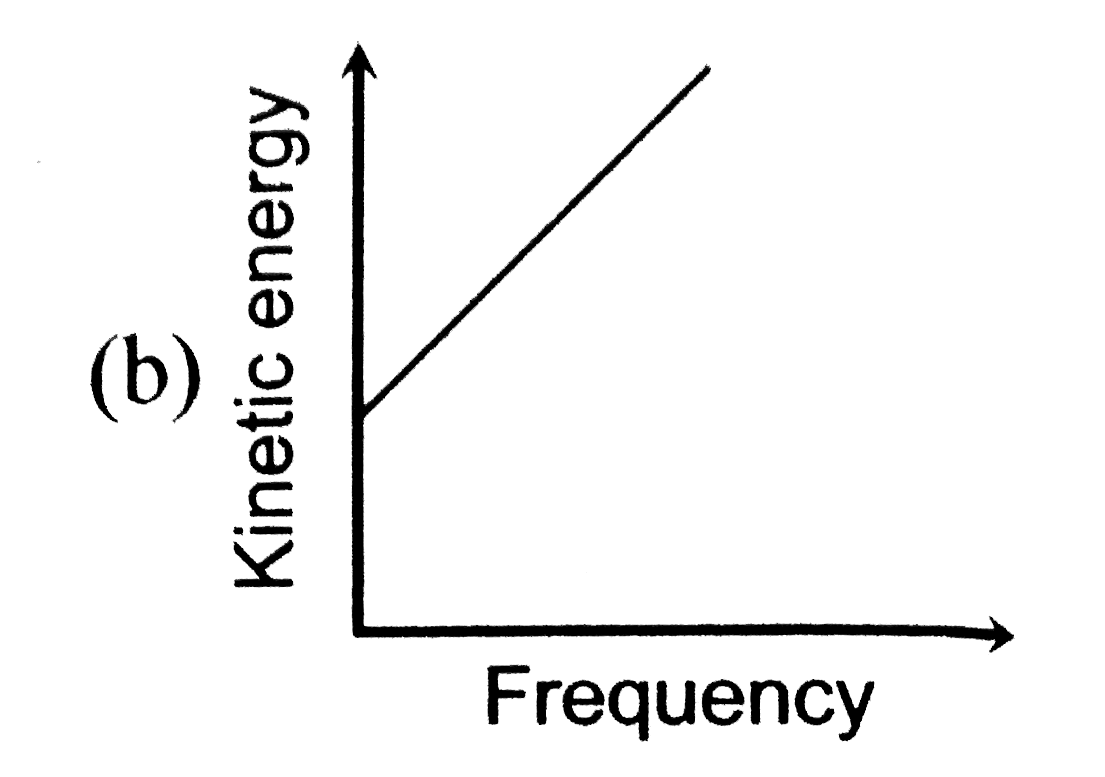 C
C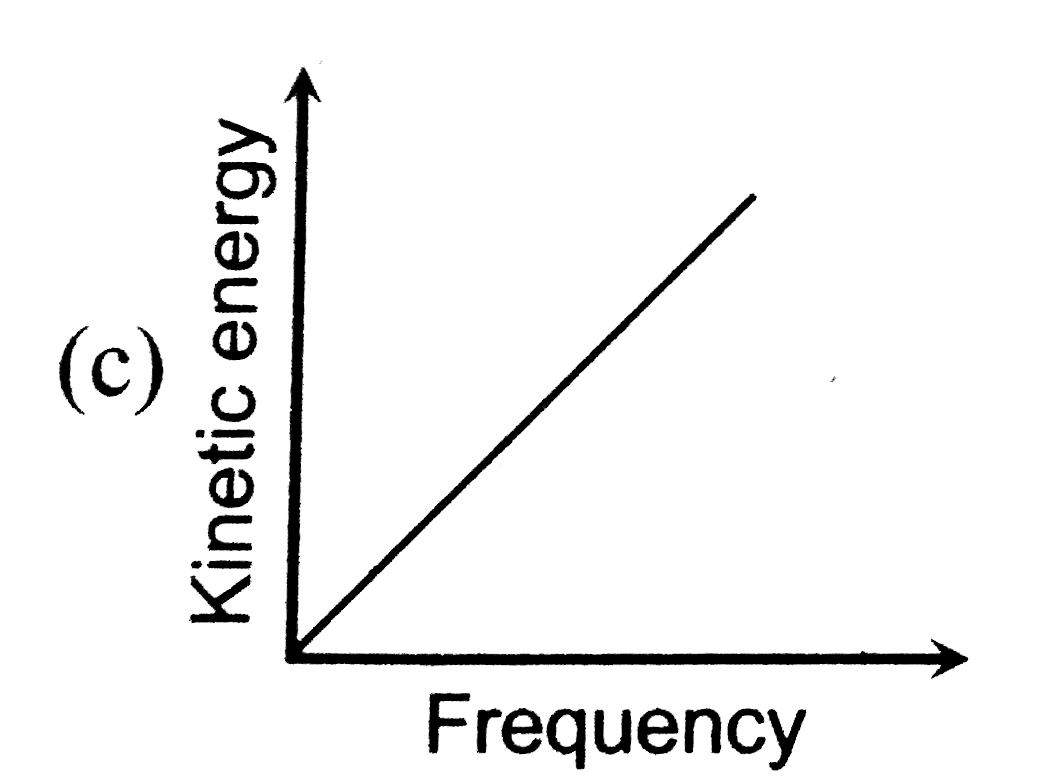 D
D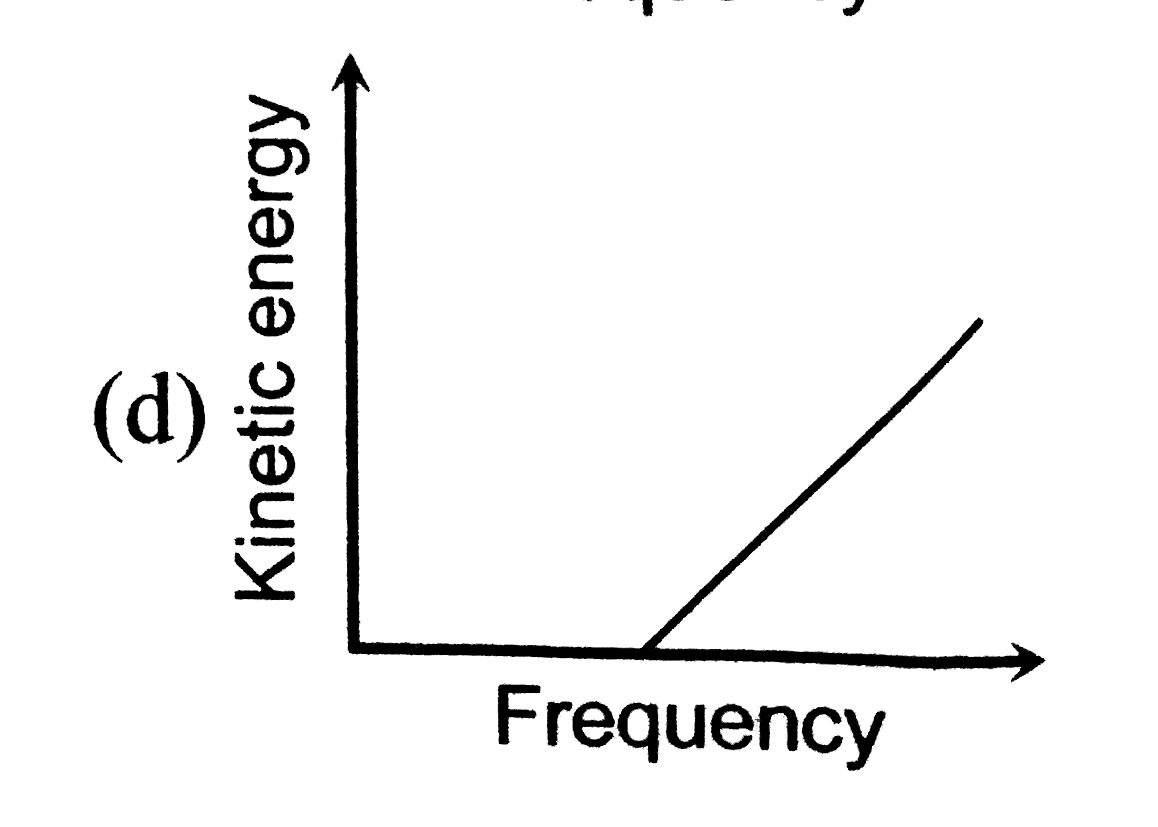
- Question 3 - Select One
Maximum kinetic energy (Ek) of a photoelectron varies with the frequency (v) of the incident radiation as
A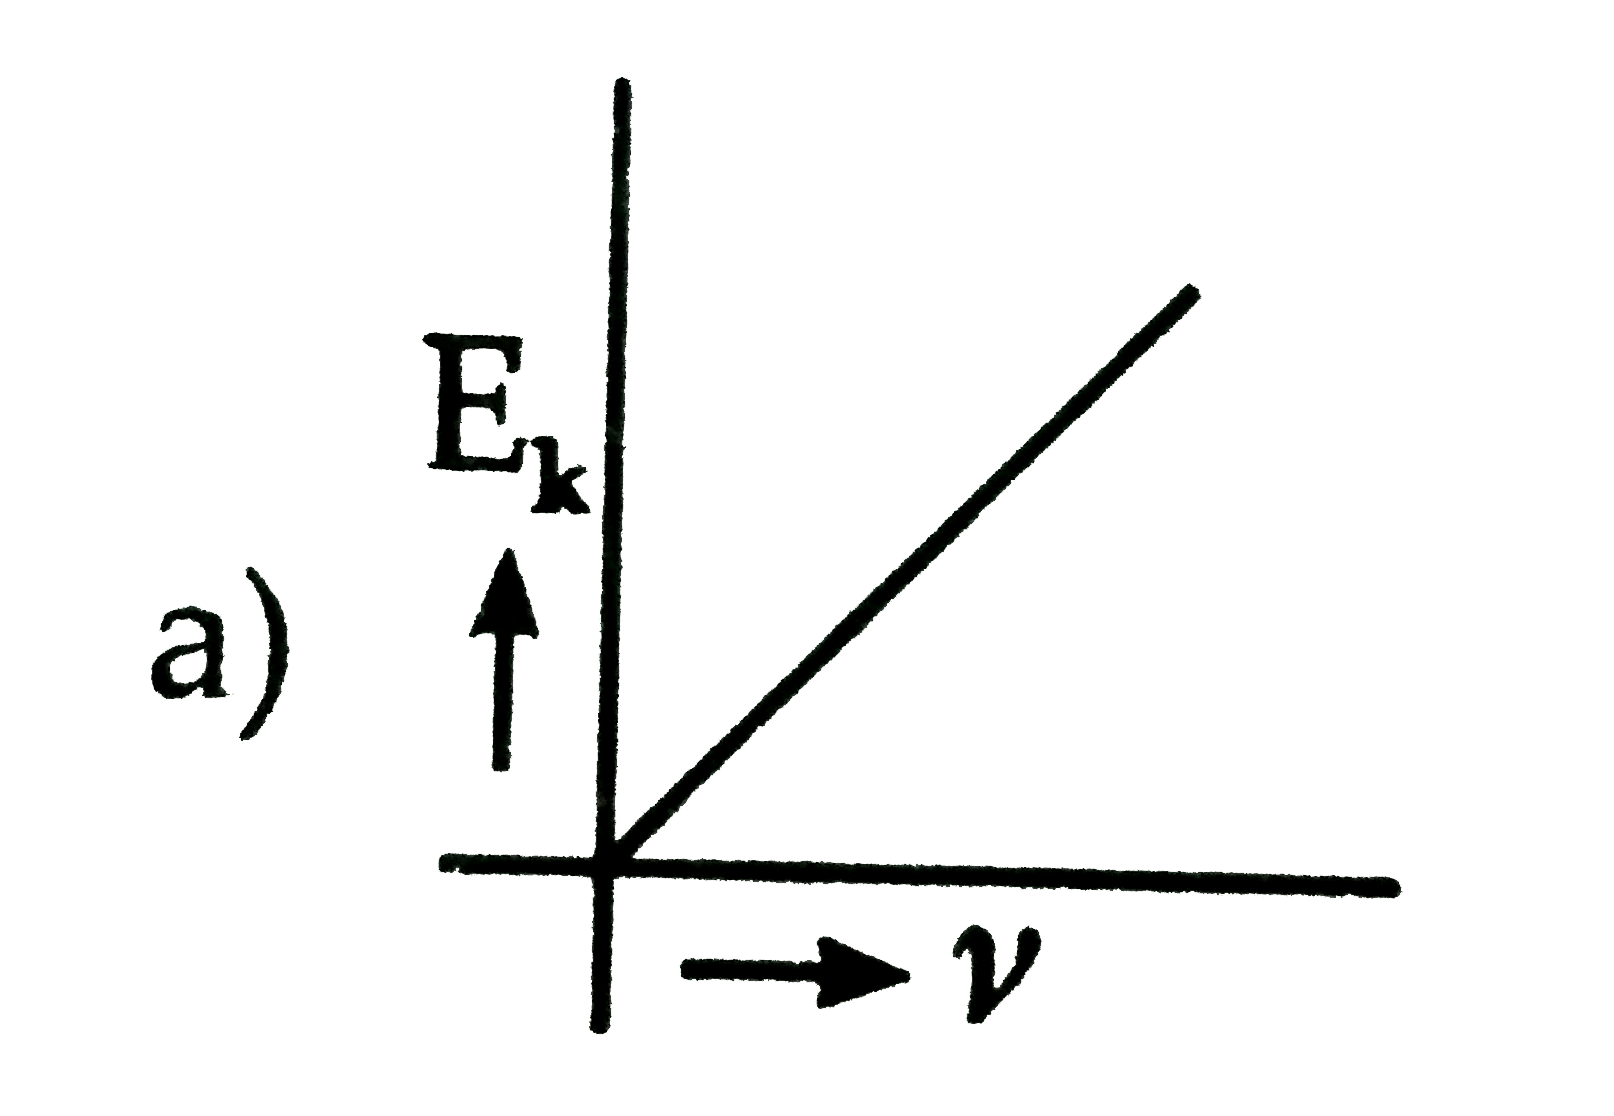 B
B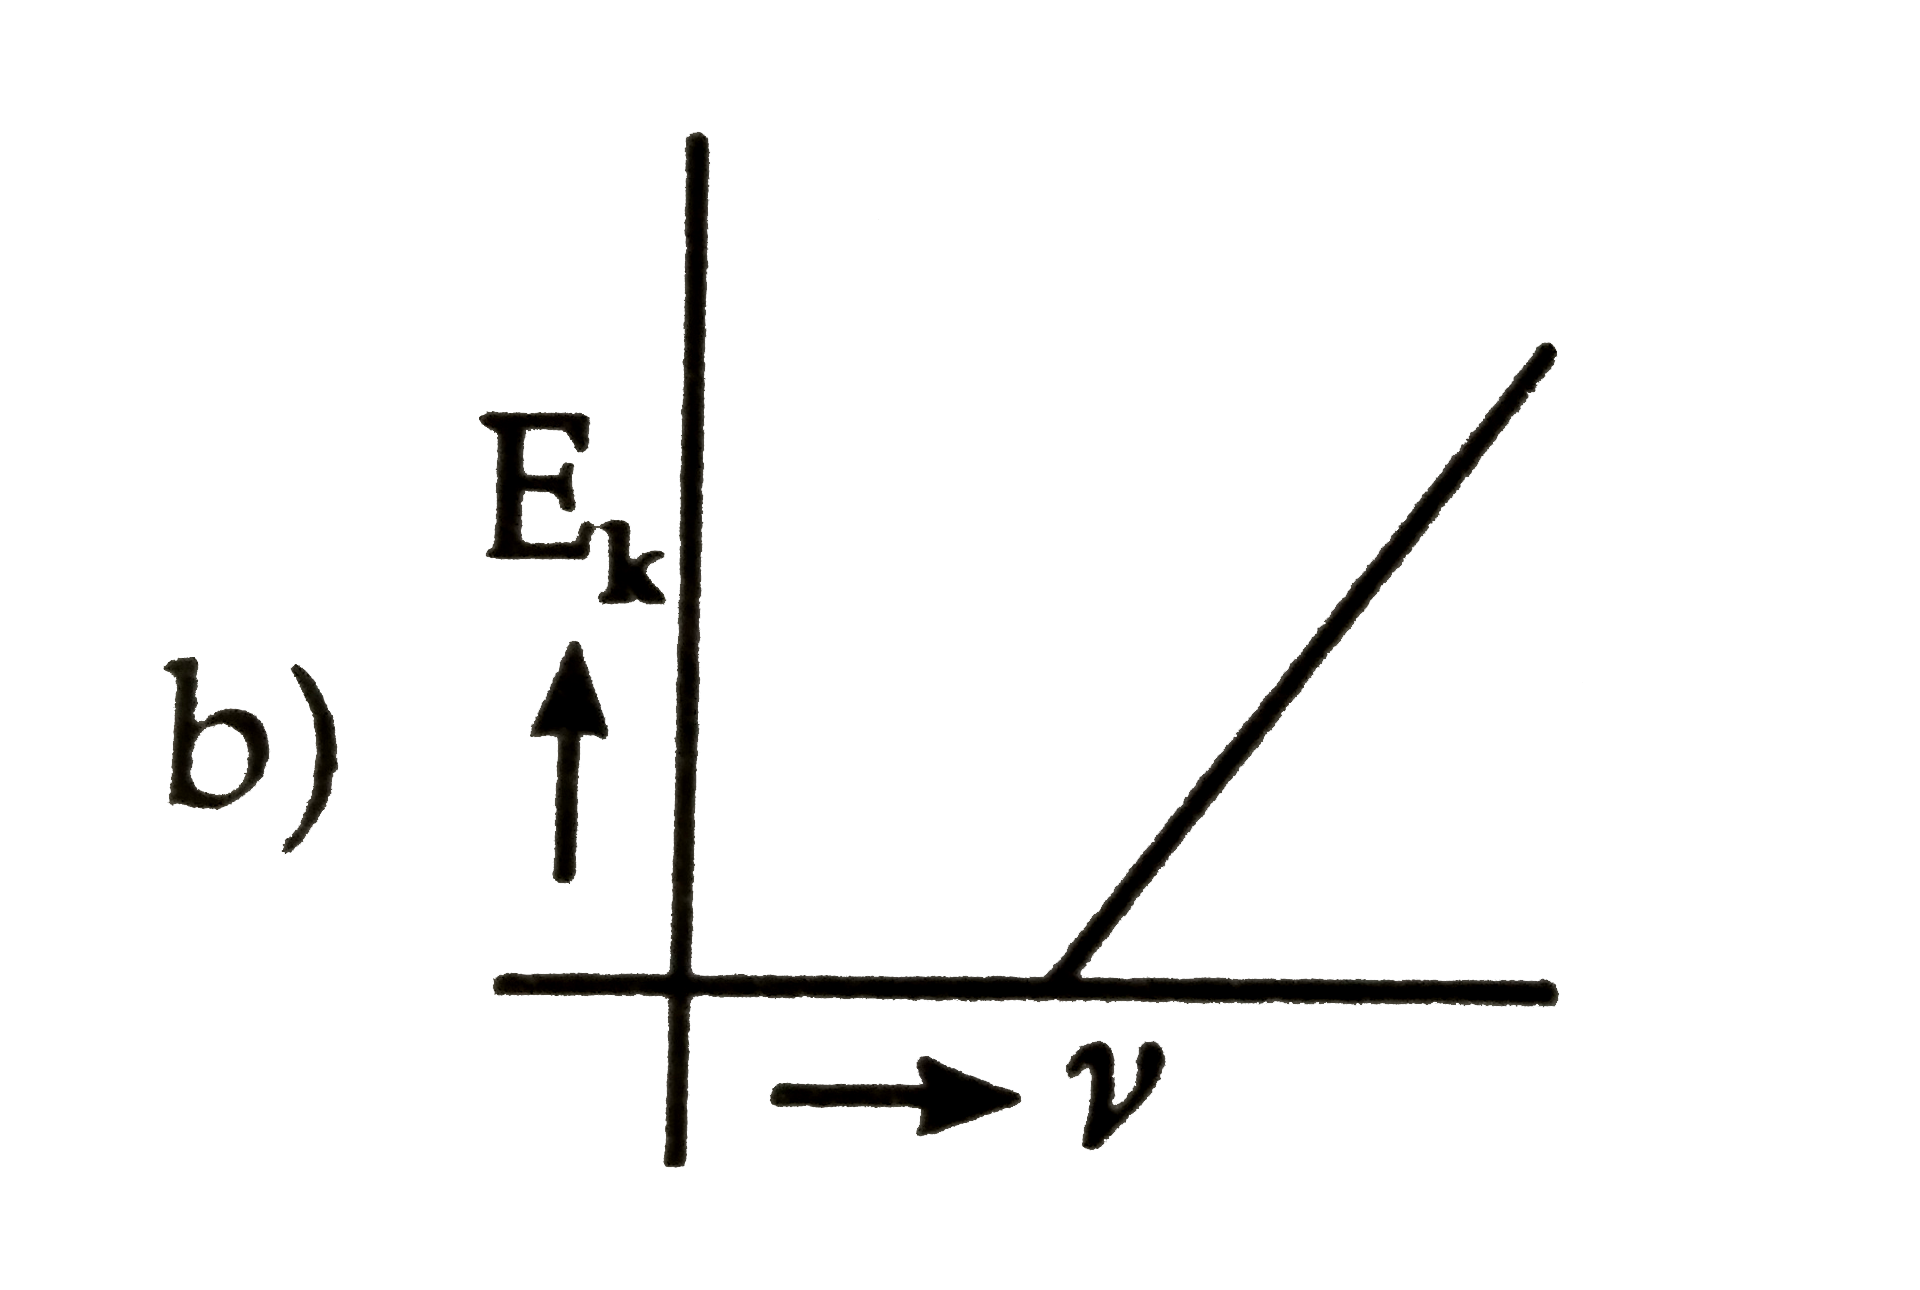 C
C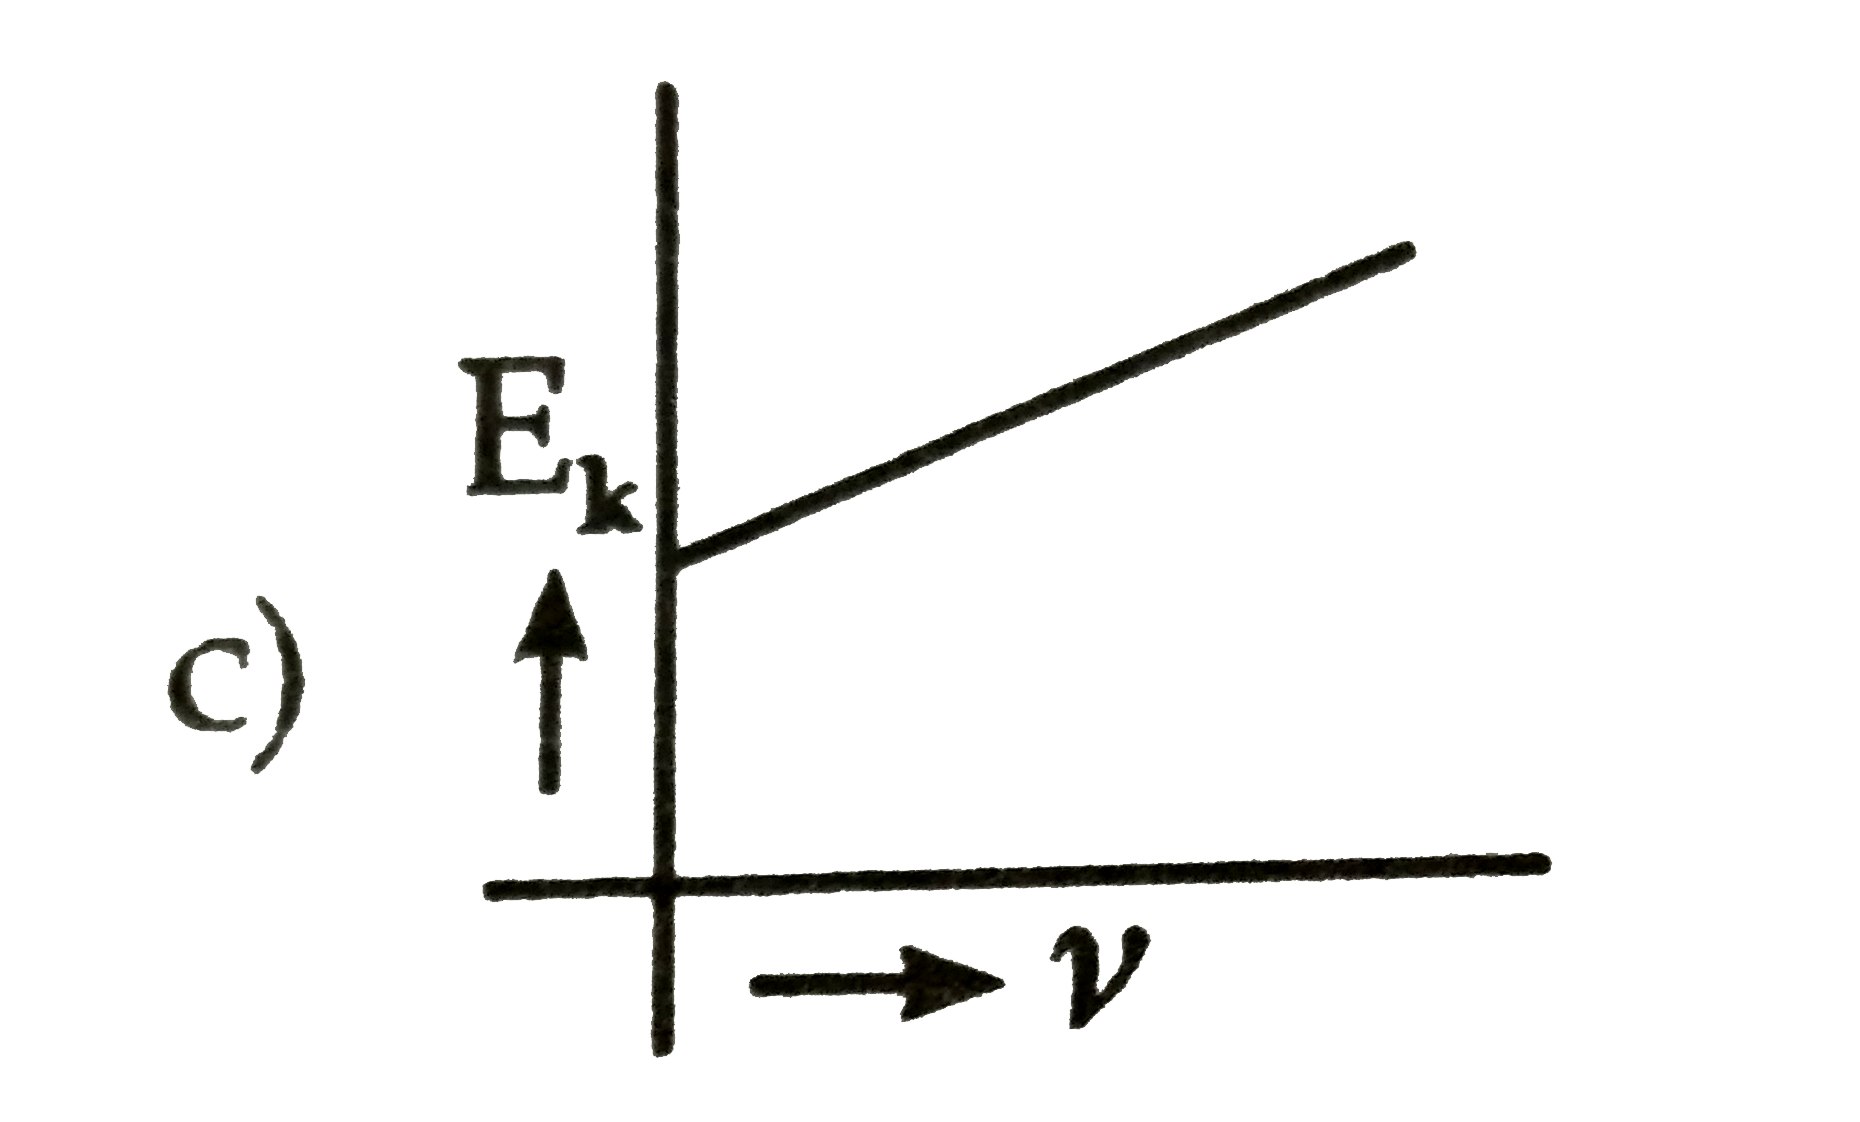 D
D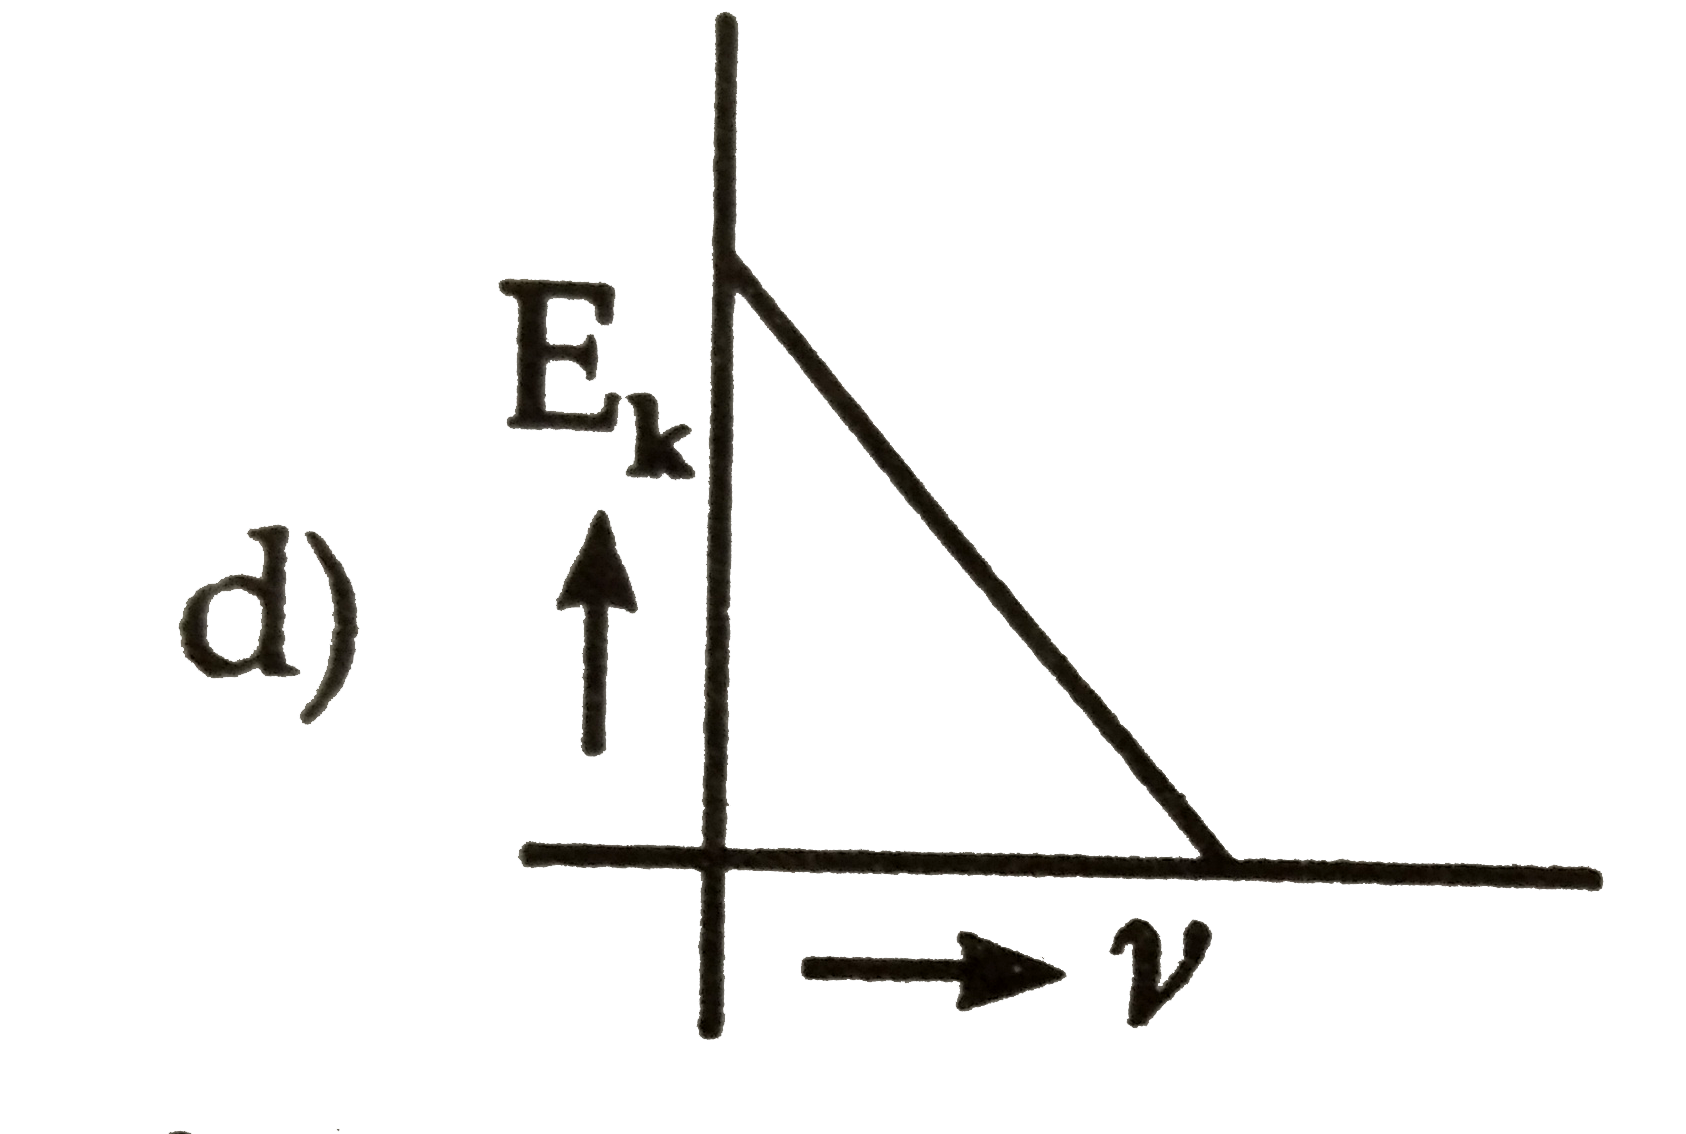
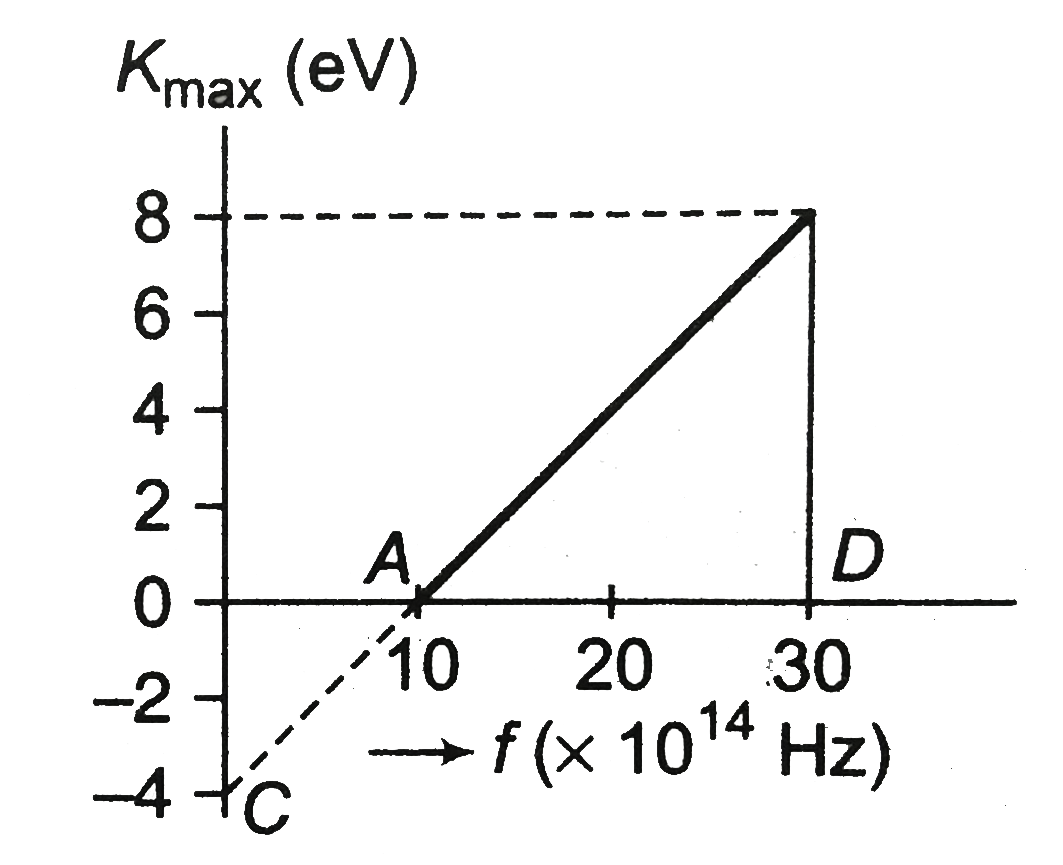
A graph regarding photoelectric effect is shown between the maximum kinetic energy of electrons and the frequency of the incident light. On the basis of data as shown in the graph, calculate (a) threshold frequency , (b) work- function, (c ) planck constant
 View Solution
Find a relation between cut-off potential, frequency of the incident light and threshold frequency.
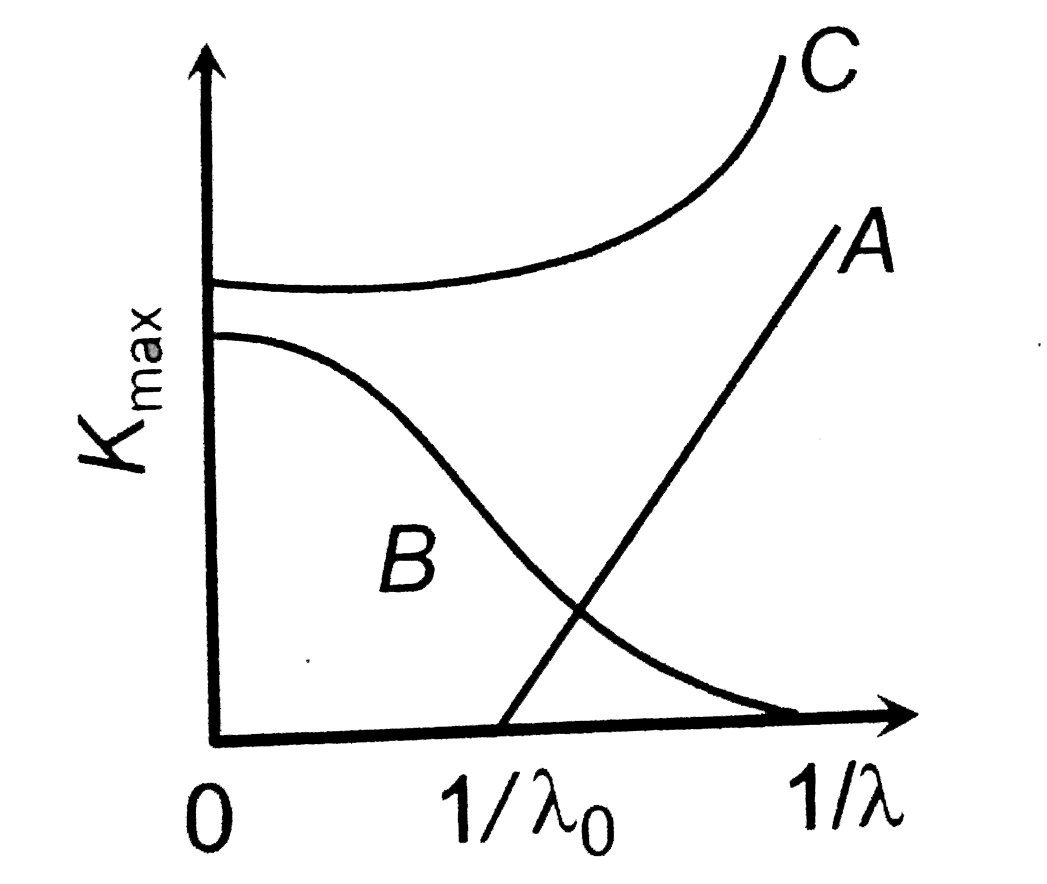
View SolutionThe correct graph between the maximum energy of a photoelectron and the inverse of wavelength of the incident radiation is given by the curve
 View Solution
In a photoelectric experiment, the reciprocal of the slope of the straight line graph giving the relation between the stopping potential and the frequency of incident radiation gives
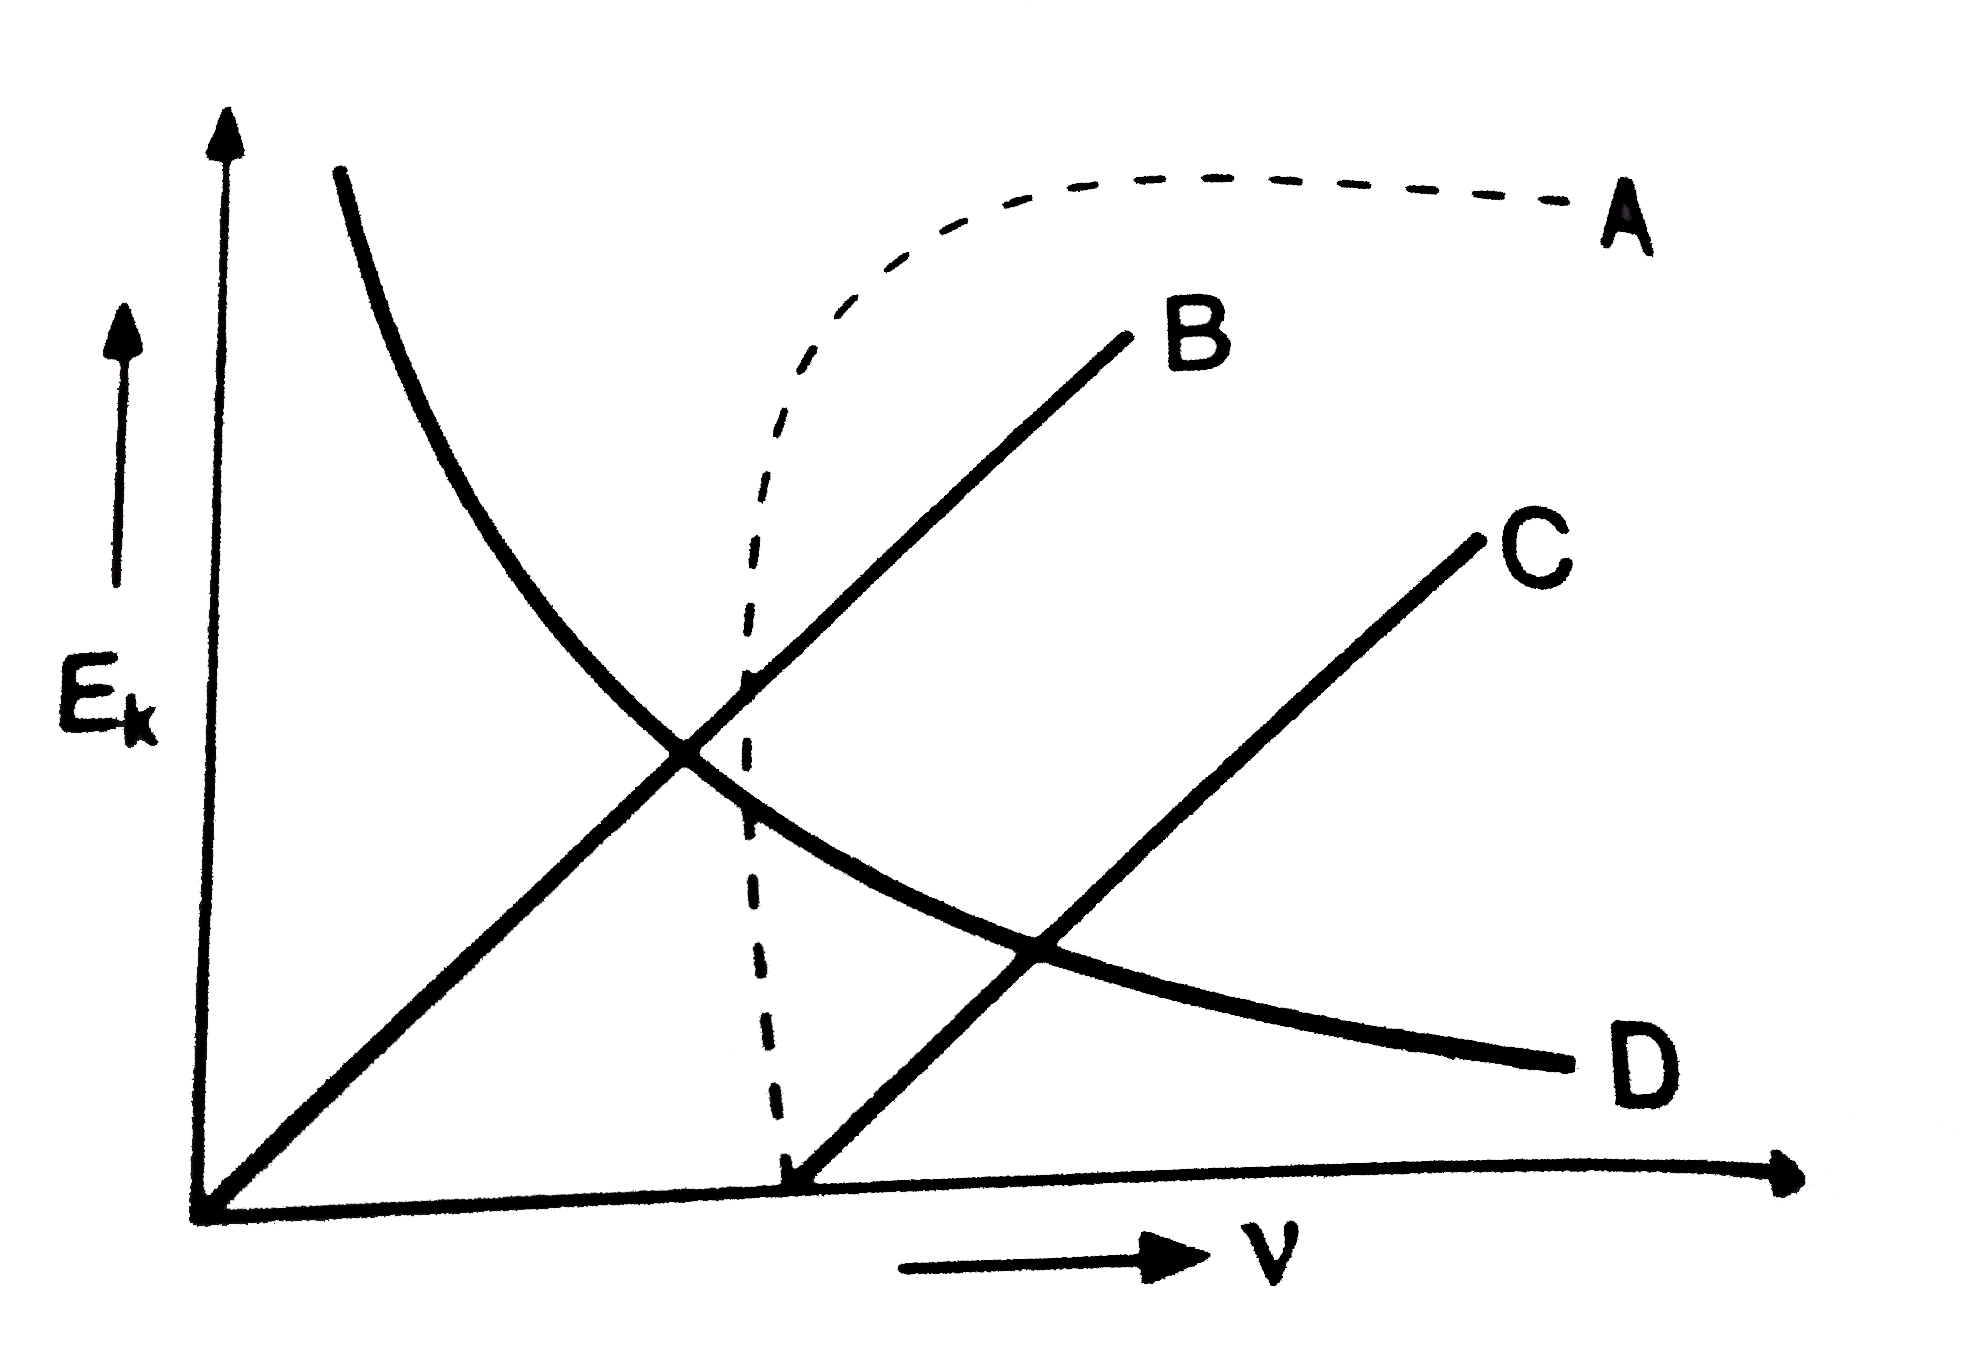
View SolutionThe maximu kinetic energy (Ek) of the photoelectron varies with frequency (v) of the incident light as shown by the curve:
 View Solution

