Which plot is the adsorptoion isobar for chemisorption where m (at constant pressure ) at temperature T ?
A
(##DPB_PHY_CHM_IX_C13_E01_018_O01.png" width="30%">.
B
(##DPB_PHY_CHM_IX_C13_E01_018_O02.png" width="30%">.
C
(##DPB_PHY_CHM_IX_C13_E01_018_O03.png" width="30%">.
D
(##DPB_PHY_CHM_IX_C13_E01_018_O04.png" width="30%">
Text Solution
The correct Answer is:C
Chemical adsorption first increases , then decreases to attain constancy with rise in temperature .
|
Topper's Solved these Questions
- SURFACE CHEMISTRYBOOK - P BAHADURCHAPTER - SURFACE CHEMISTRYEXERCISE - Exercise 4
3 Videos
- SURFACE CHEMISTRYBOOK - P BAHADURCHAPTER - SURFACE CHEMISTRYEXERCISE - Exercise 5
1 Videos
- SURFACE CHEMISTRYBOOK - P BAHADURCHAPTER - SURFACE CHEMISTRYEXERCISE - Exercise 5
1 Videos
- SOLID STATEBOOK - P BAHADURCHAPTER - SOLID STATEEXERCISE - Exercise 9
1 Videos
Similar Questions
Knowledge Check
Which plot is the adsorption isobar for chemisorption?
A B
B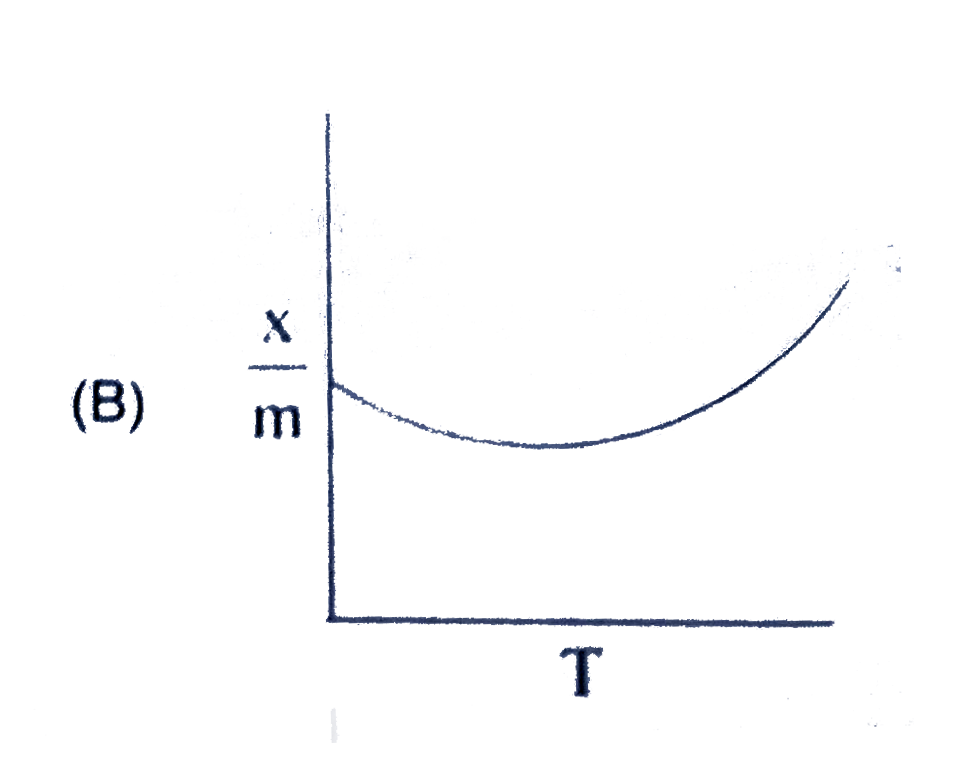 C
C D
D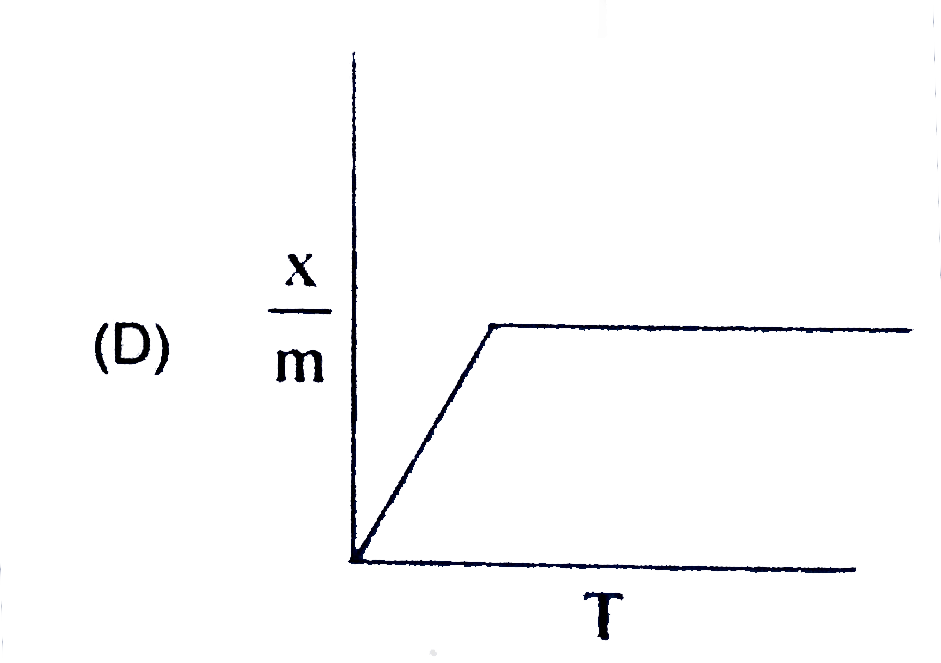
Which plot is the adsorption isobar for chemisorption?
A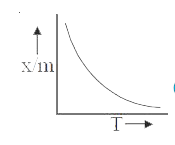 B
B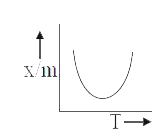 C
C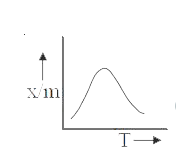 D
D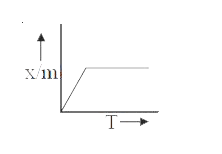
Which plot is the adsorption isobar for chemisorption?
A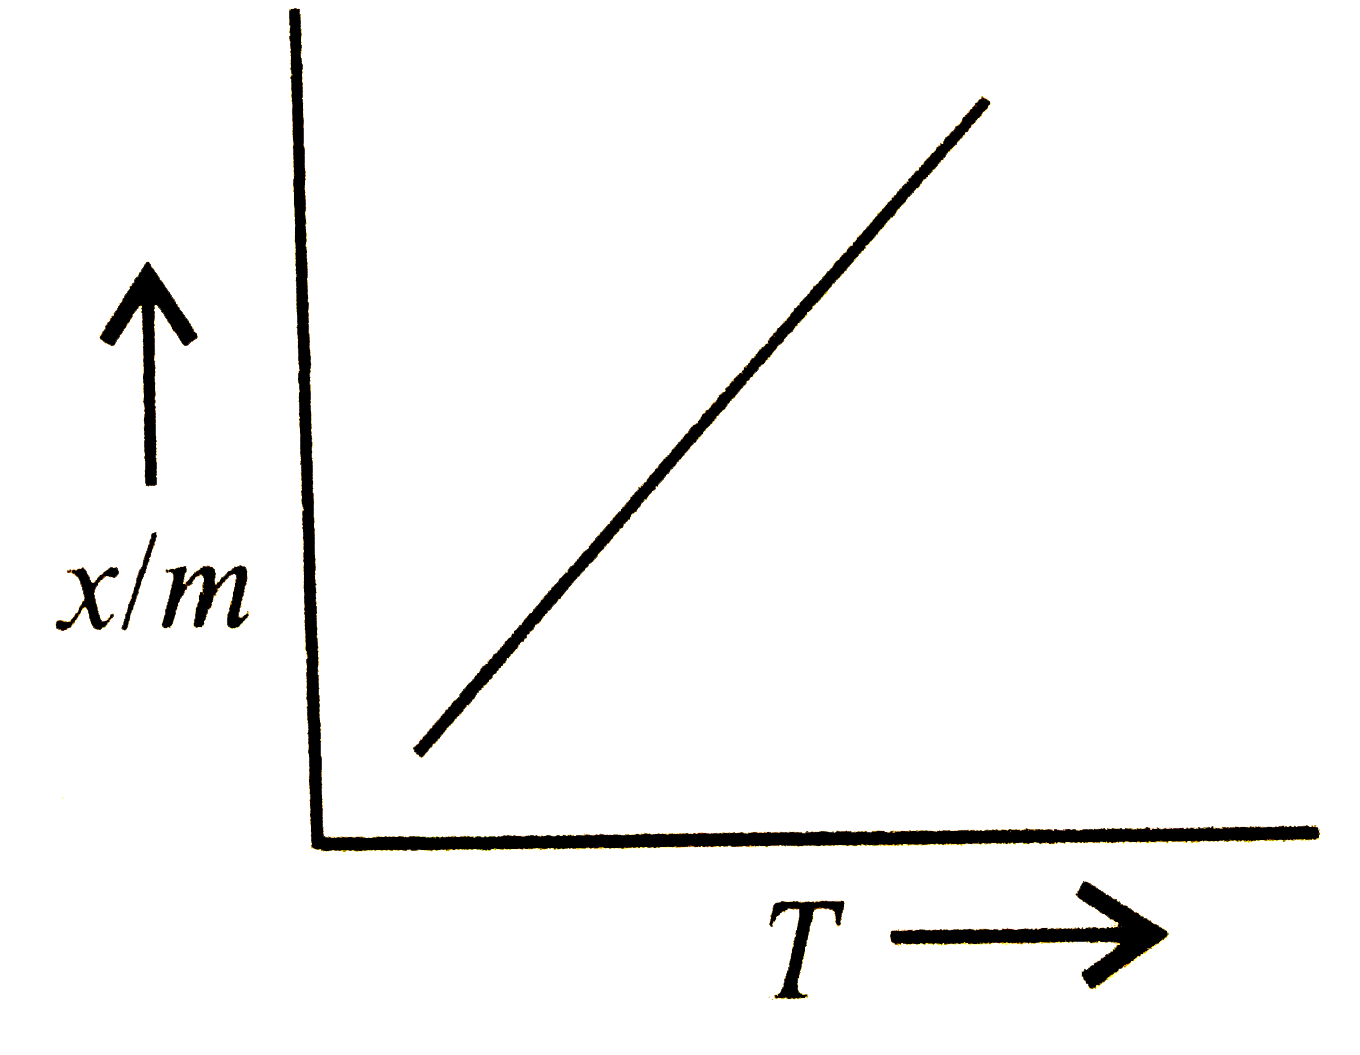 B
B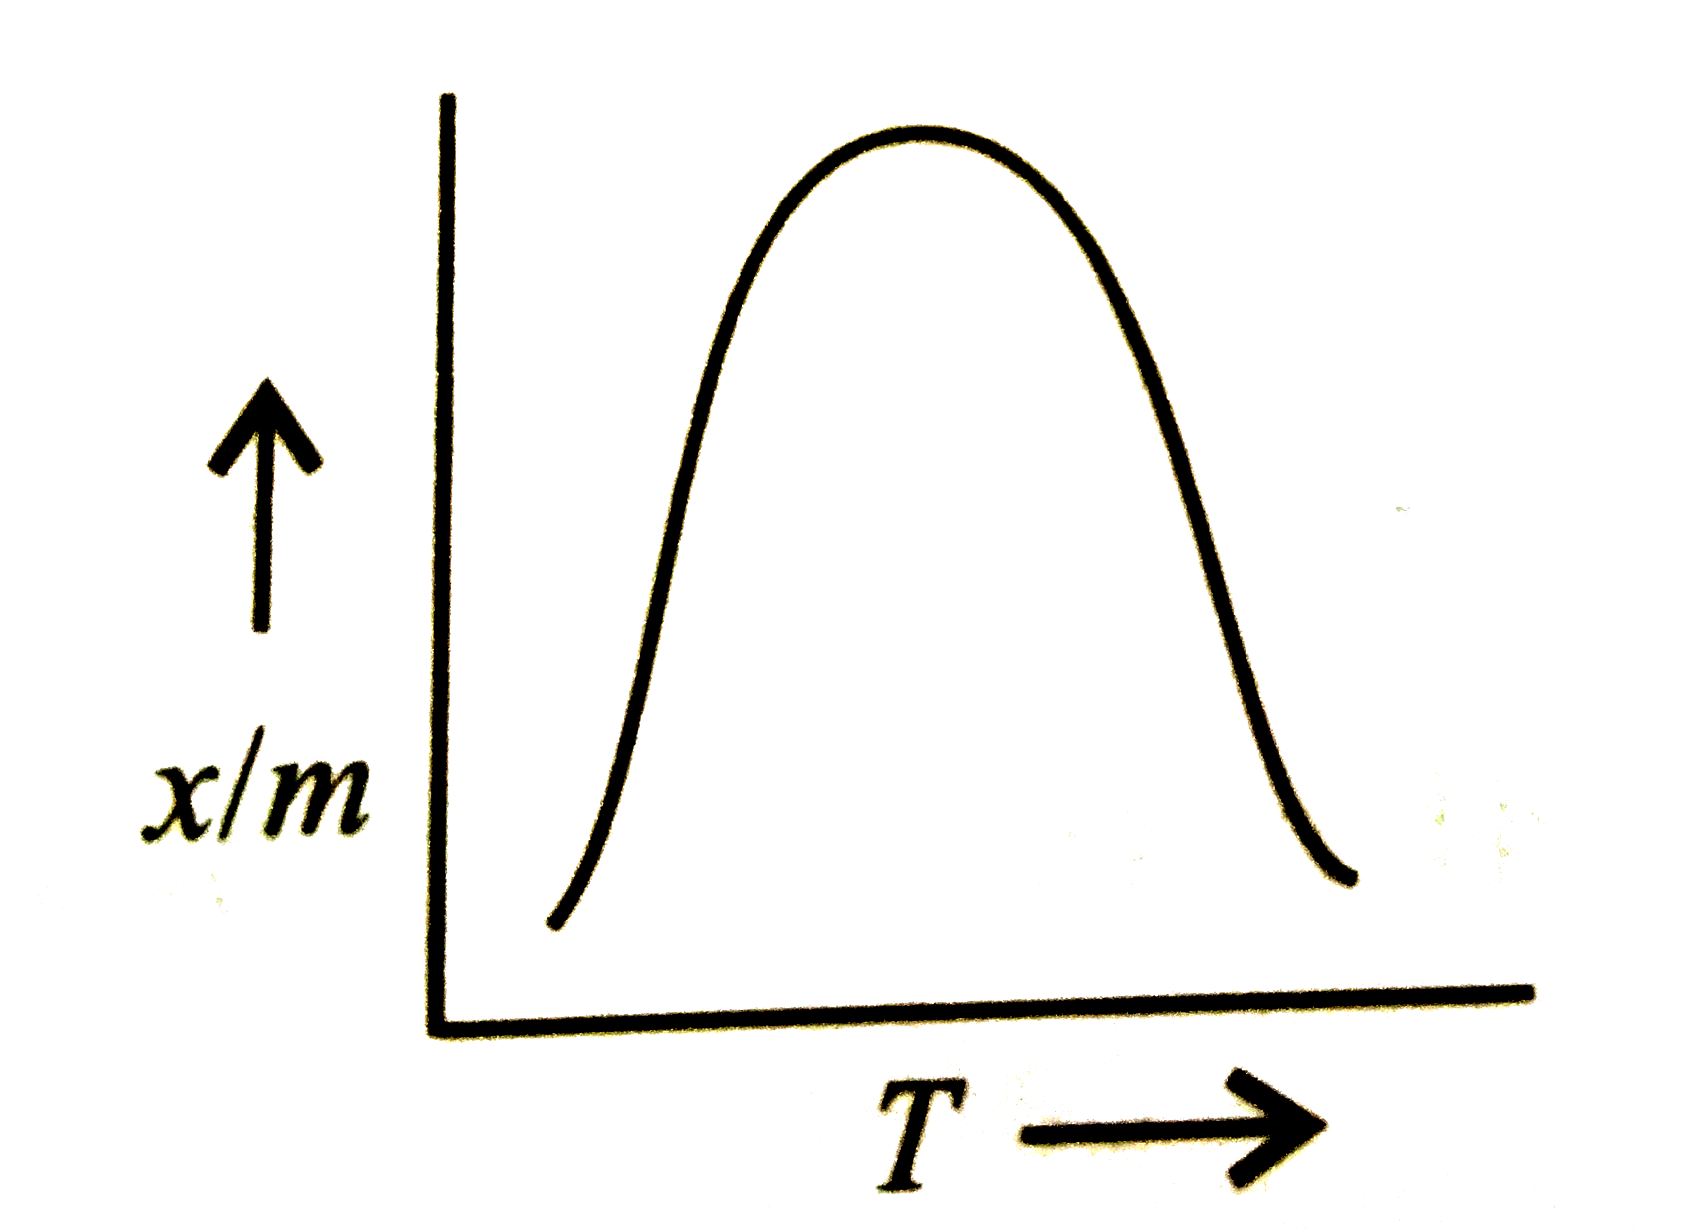 C
C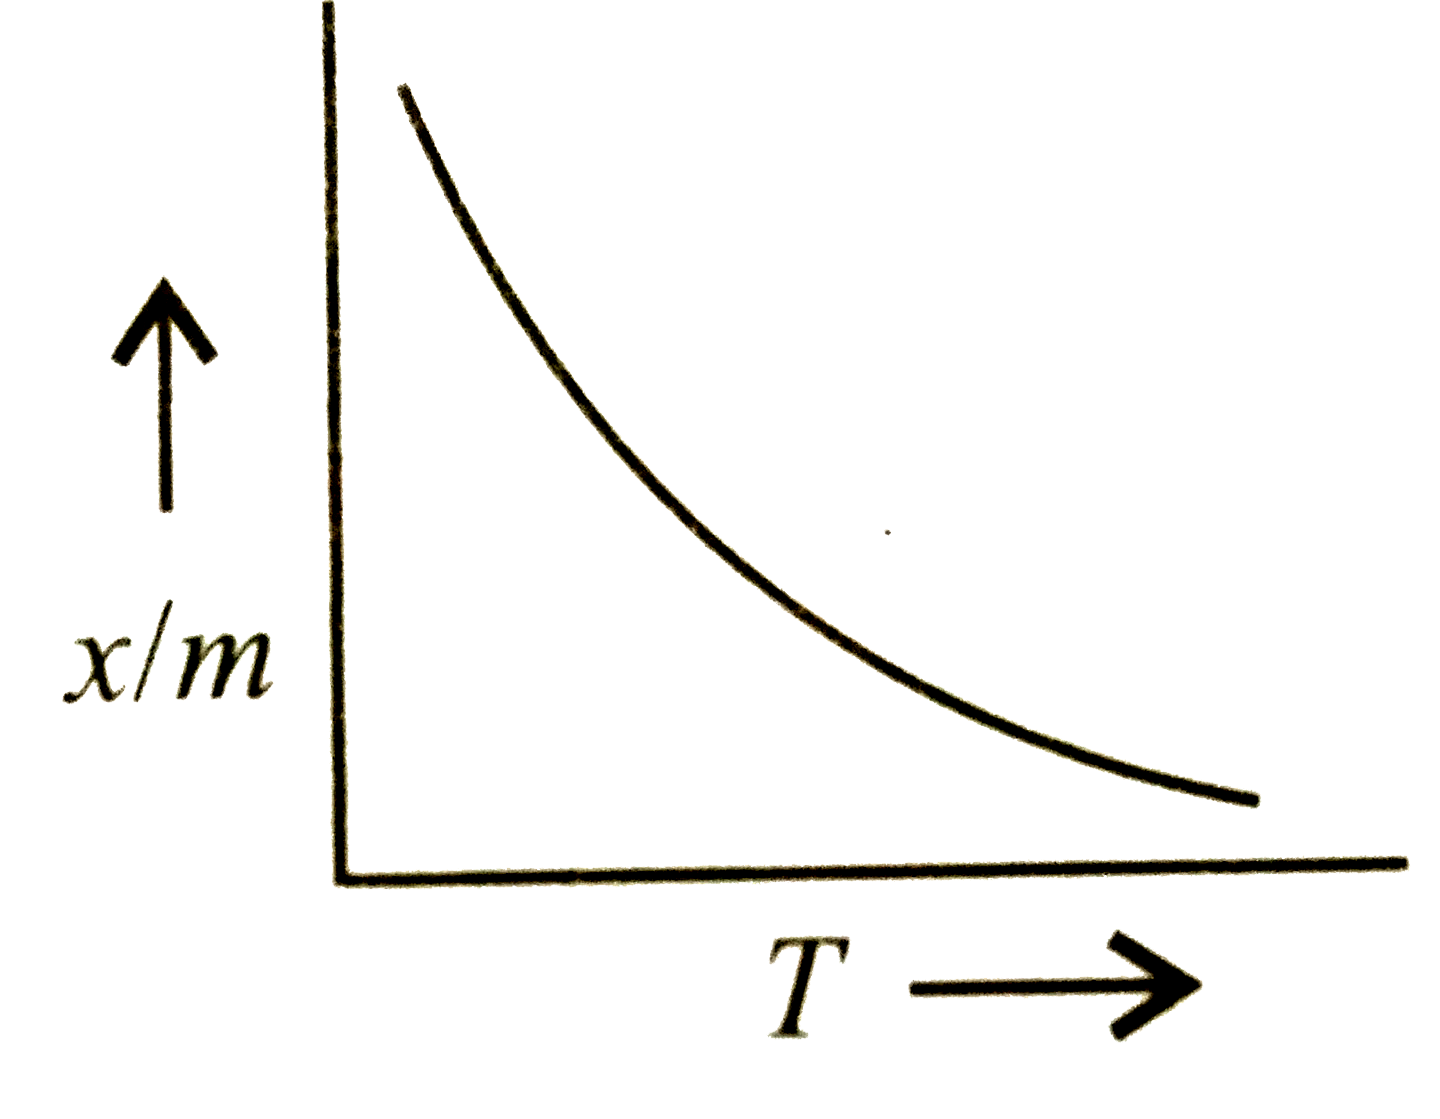 D
D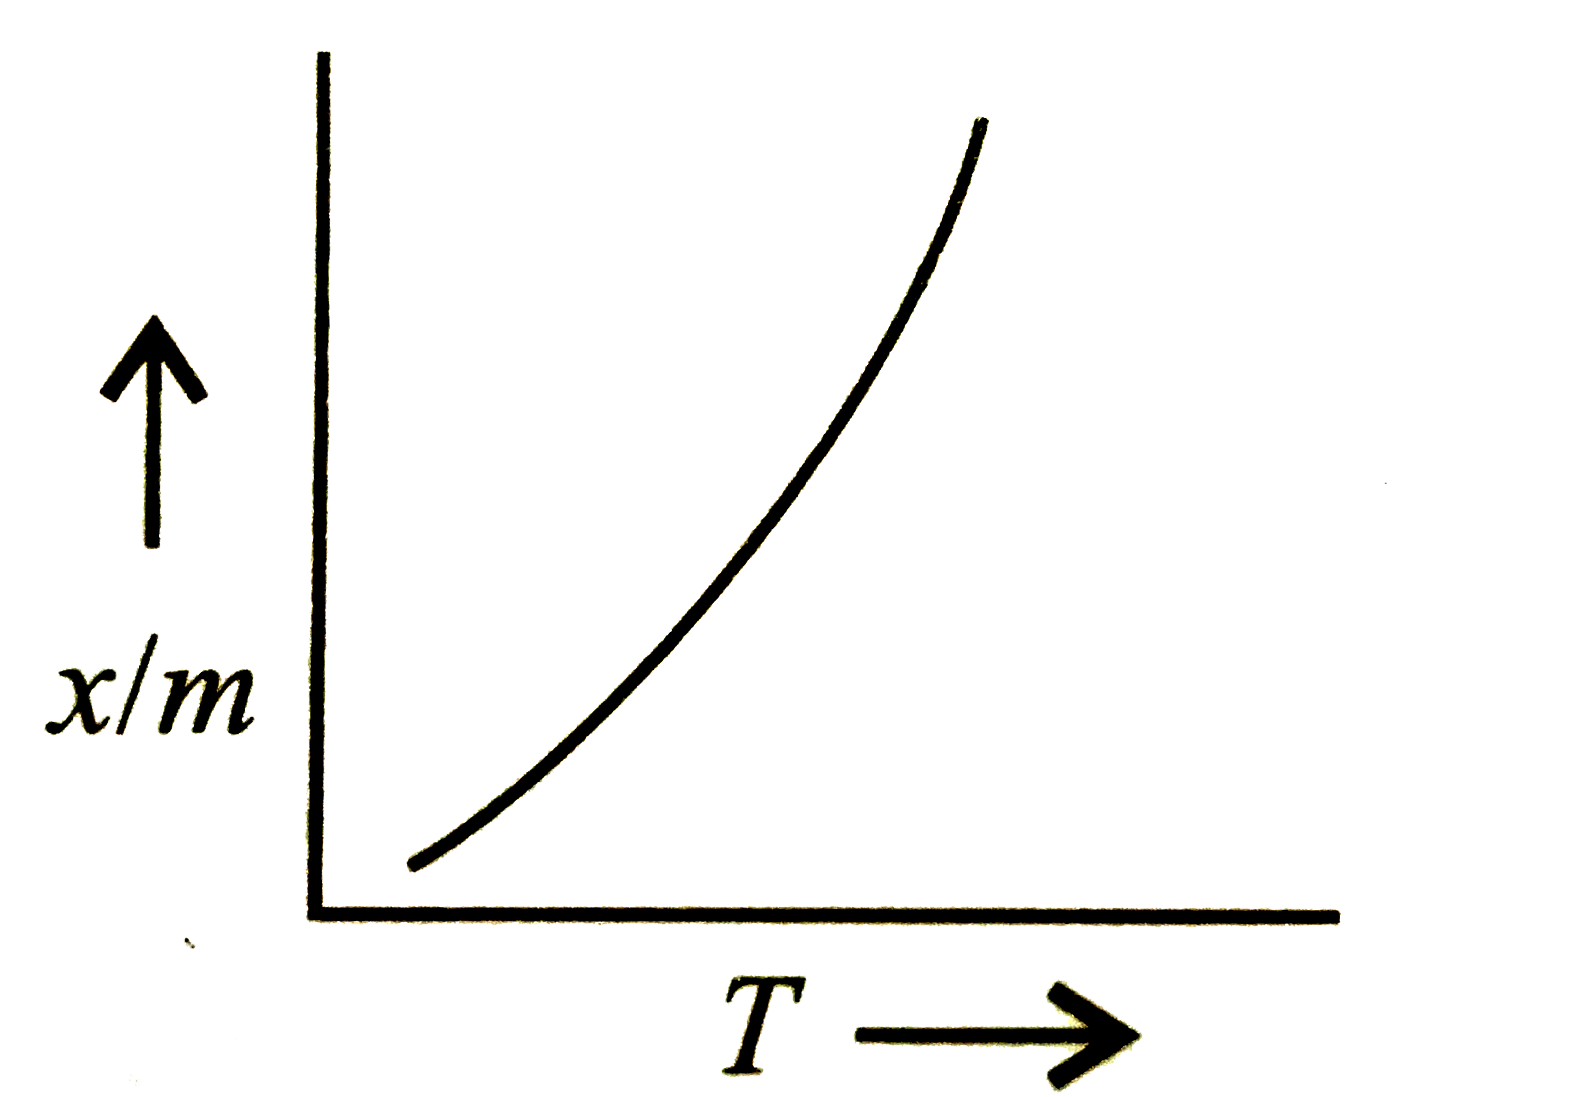
Which is not adsorption isobar for chemisorption?
View SolutionWhich of the plots is adsorption isobar for chemisorption?
View SolutionWhich is not adsorption isobar for chemisorption?
View SolutionWhich plot is the adsorption isobar for chemisorption where x is the amount of gas adsorbed on mass m (at constant pressure) at temperature T -
View SolutionWhich plot is the adsorption isobar for chemisorption where x is the amount of gas adsorbed on mass m (at constant pressure at temperature T ?
View Solution
