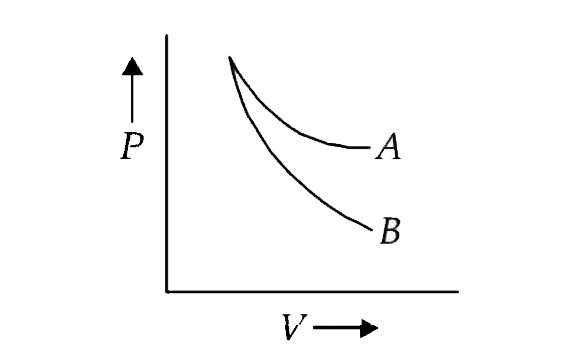
Show that the slope of p−V diagram is greater for an adiabatic process as compared to an isothermal process.
Step by step video & image solution for Show that the slope of p-V diagram is greater for an adiabatic process as compared to an isothermal process. by Physics experts to help you in doubts & scoring excellent marks in Class 11 exams.
Updated on:21/07/2023Topper's Solved these Questions
- THERMODYNAMICSBOOK - PRADEEPCHAPTER - THERMODYNAMICSEXERCISE - Long answer questions
11 Videos
- THERMODYNAMICSBOOK - PRADEEPCHAPTER - THERMODYNAMICSEXERCISE - Advanced problems for competitions
10 Videos
- THERMODYNAMICSBOOK - PRADEEPCHAPTER - THERMODYNAMICSEXERCISE - Very short answer questions
31 Videos
- SYSTEMS OF PARTICLES AND ROTATIONAL MOTIONBOOK - PRADEEPCHAPTER - SYSTEMS OF PARTICLES AND ROTATIONAL MOTIONEXERCISE - Assertion- Reason Type questions
20 Videos
- WORK, ENERGY AND POWERBOOK - PRADEEPCHAPTER - WORK, ENERGY AND POWEREXERCISE - Assertion-Reason Type Questions
24 Videos
Similar Questions
Knowledge Check
STATEMENT-2: In a gas , any rapid change must be adiabatic, whereas a slow change may be adiabatic.
STATEMENT-2: In a p-V diagram, the magnitude of the slope is greater for an adiabatic process than for an isothermal process.AStatement-1 is True , Statement-2 is True, Statement-2 is a correct explanation for Statement-1.BStatement-1 is True , Statement-2 is True, Statement-2 is not a correct explanation for Statement-1.CStatement-1 is True , Statement-2 is False.DStatement-1 is False , Statement-2 is True.Two samples A and B are initially kept in the same state. The sample A is expanded through an adiabatic process and the sample B through an isothermal process. The final volumes of the samples are the same .The final pressures in A and B are pA and PB respectively.
ApA>pBBpA=pBCpA<pBDThe relation between pAandpB cannot be definedA gas may expand either adiabatically or isothermally. A number of p−V curves are drawn for the two processes over different ranges of pressure and volume, it will be found that
(i) Two adiabatic curves do not intersect
(ii) two isothermal curves do not intersect
(iii) an adiabatic curve and an isothermal curve may intersect.
(iv) the magnitude of the slope of an adiabatic curve is greater thanthe magnitude of the slope of an isothermal curveA(i),(ii)B(ii),(iii)C(iii),(iv)Dall
Isothermal and adiabatic process are identical.
View SolutionThe curves A and B in the figure shown P-V graphs for an isothermal and an adiabatic process for an idea gas. The isothermal process is represented by the curve A.

View SolutionShow that the slope of adiabatic curve at any point is λ times the slope of an isothermal curve at the corresponding point.
View SolutionIsothermal Process and Adiabatic Process.
View SolutionPlot the T-S diagram (i.e. the entropy vs temperature dependence) (a) for an adiabatic process, (b) for an isothermic process.
View Solution
