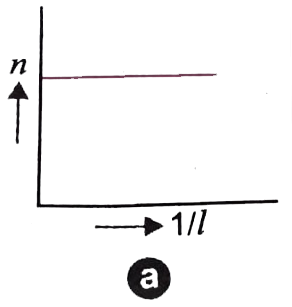
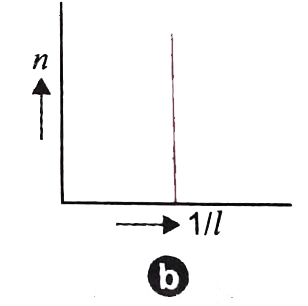
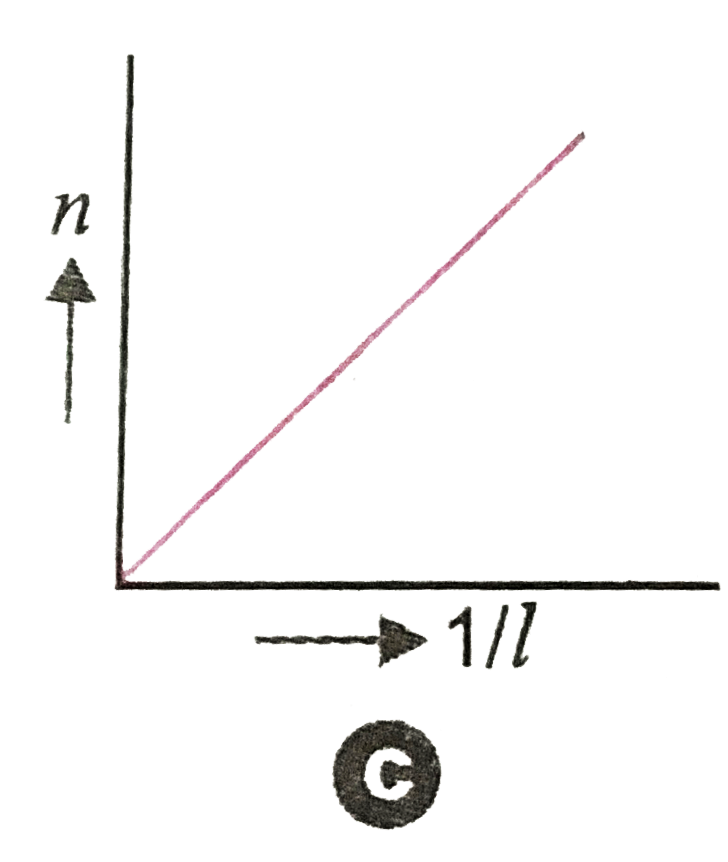
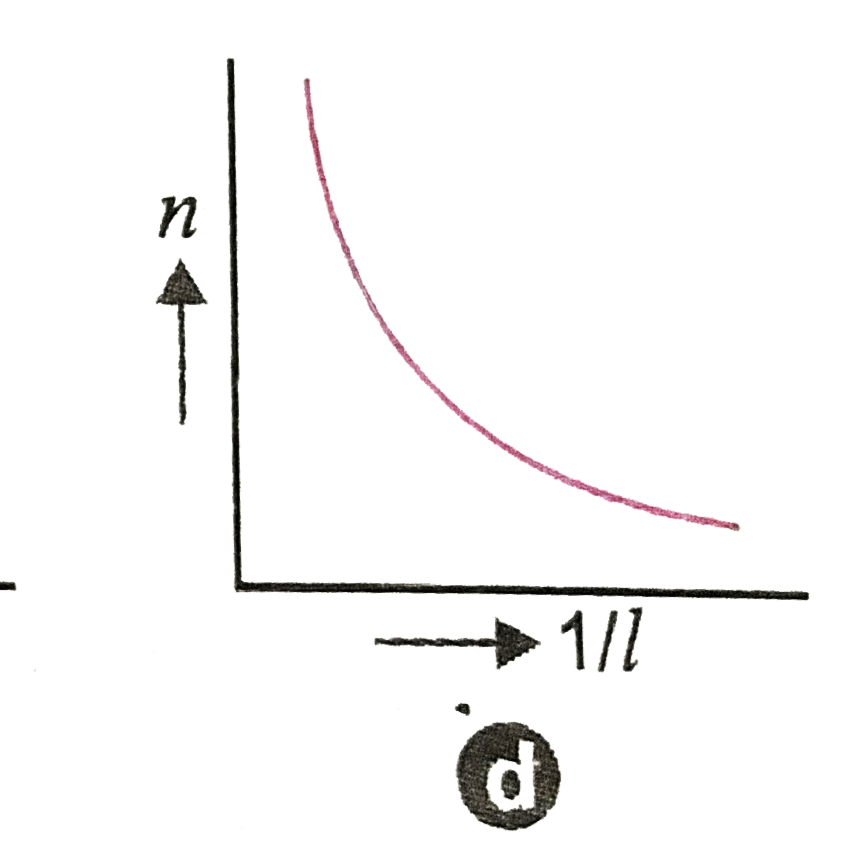
In a sonometer experiment, the graph between frequency n and reciprocaal of reonance length (1/l) is given by figure.
The correct Answer is:C
As, n∝1l, therefore, choise (c) is the correct graph.
Topper's Solved these Questions
- BOOK - PRADEEPCHAPTER - OSCILLATIONS AND WAVESEXERCISE - Assertion-Reason Type Questions23videos
OSCILLATIONS AND WAVES
- BOOK - PRADEEPCHAPTER - MATHEMATICAL TOOLSEXERCISE - Fill in the blanks5videos
MATHEMATICAL TOOLS
- BOOK - PRADEEPCHAPTER - PHYSICAL WORLD AND MEASUREMENTEXERCISE - Competiton Focus Jee Medical Entrance18videos
PHYSICAL WORLD AND MEASUREMENT
Similar Questions
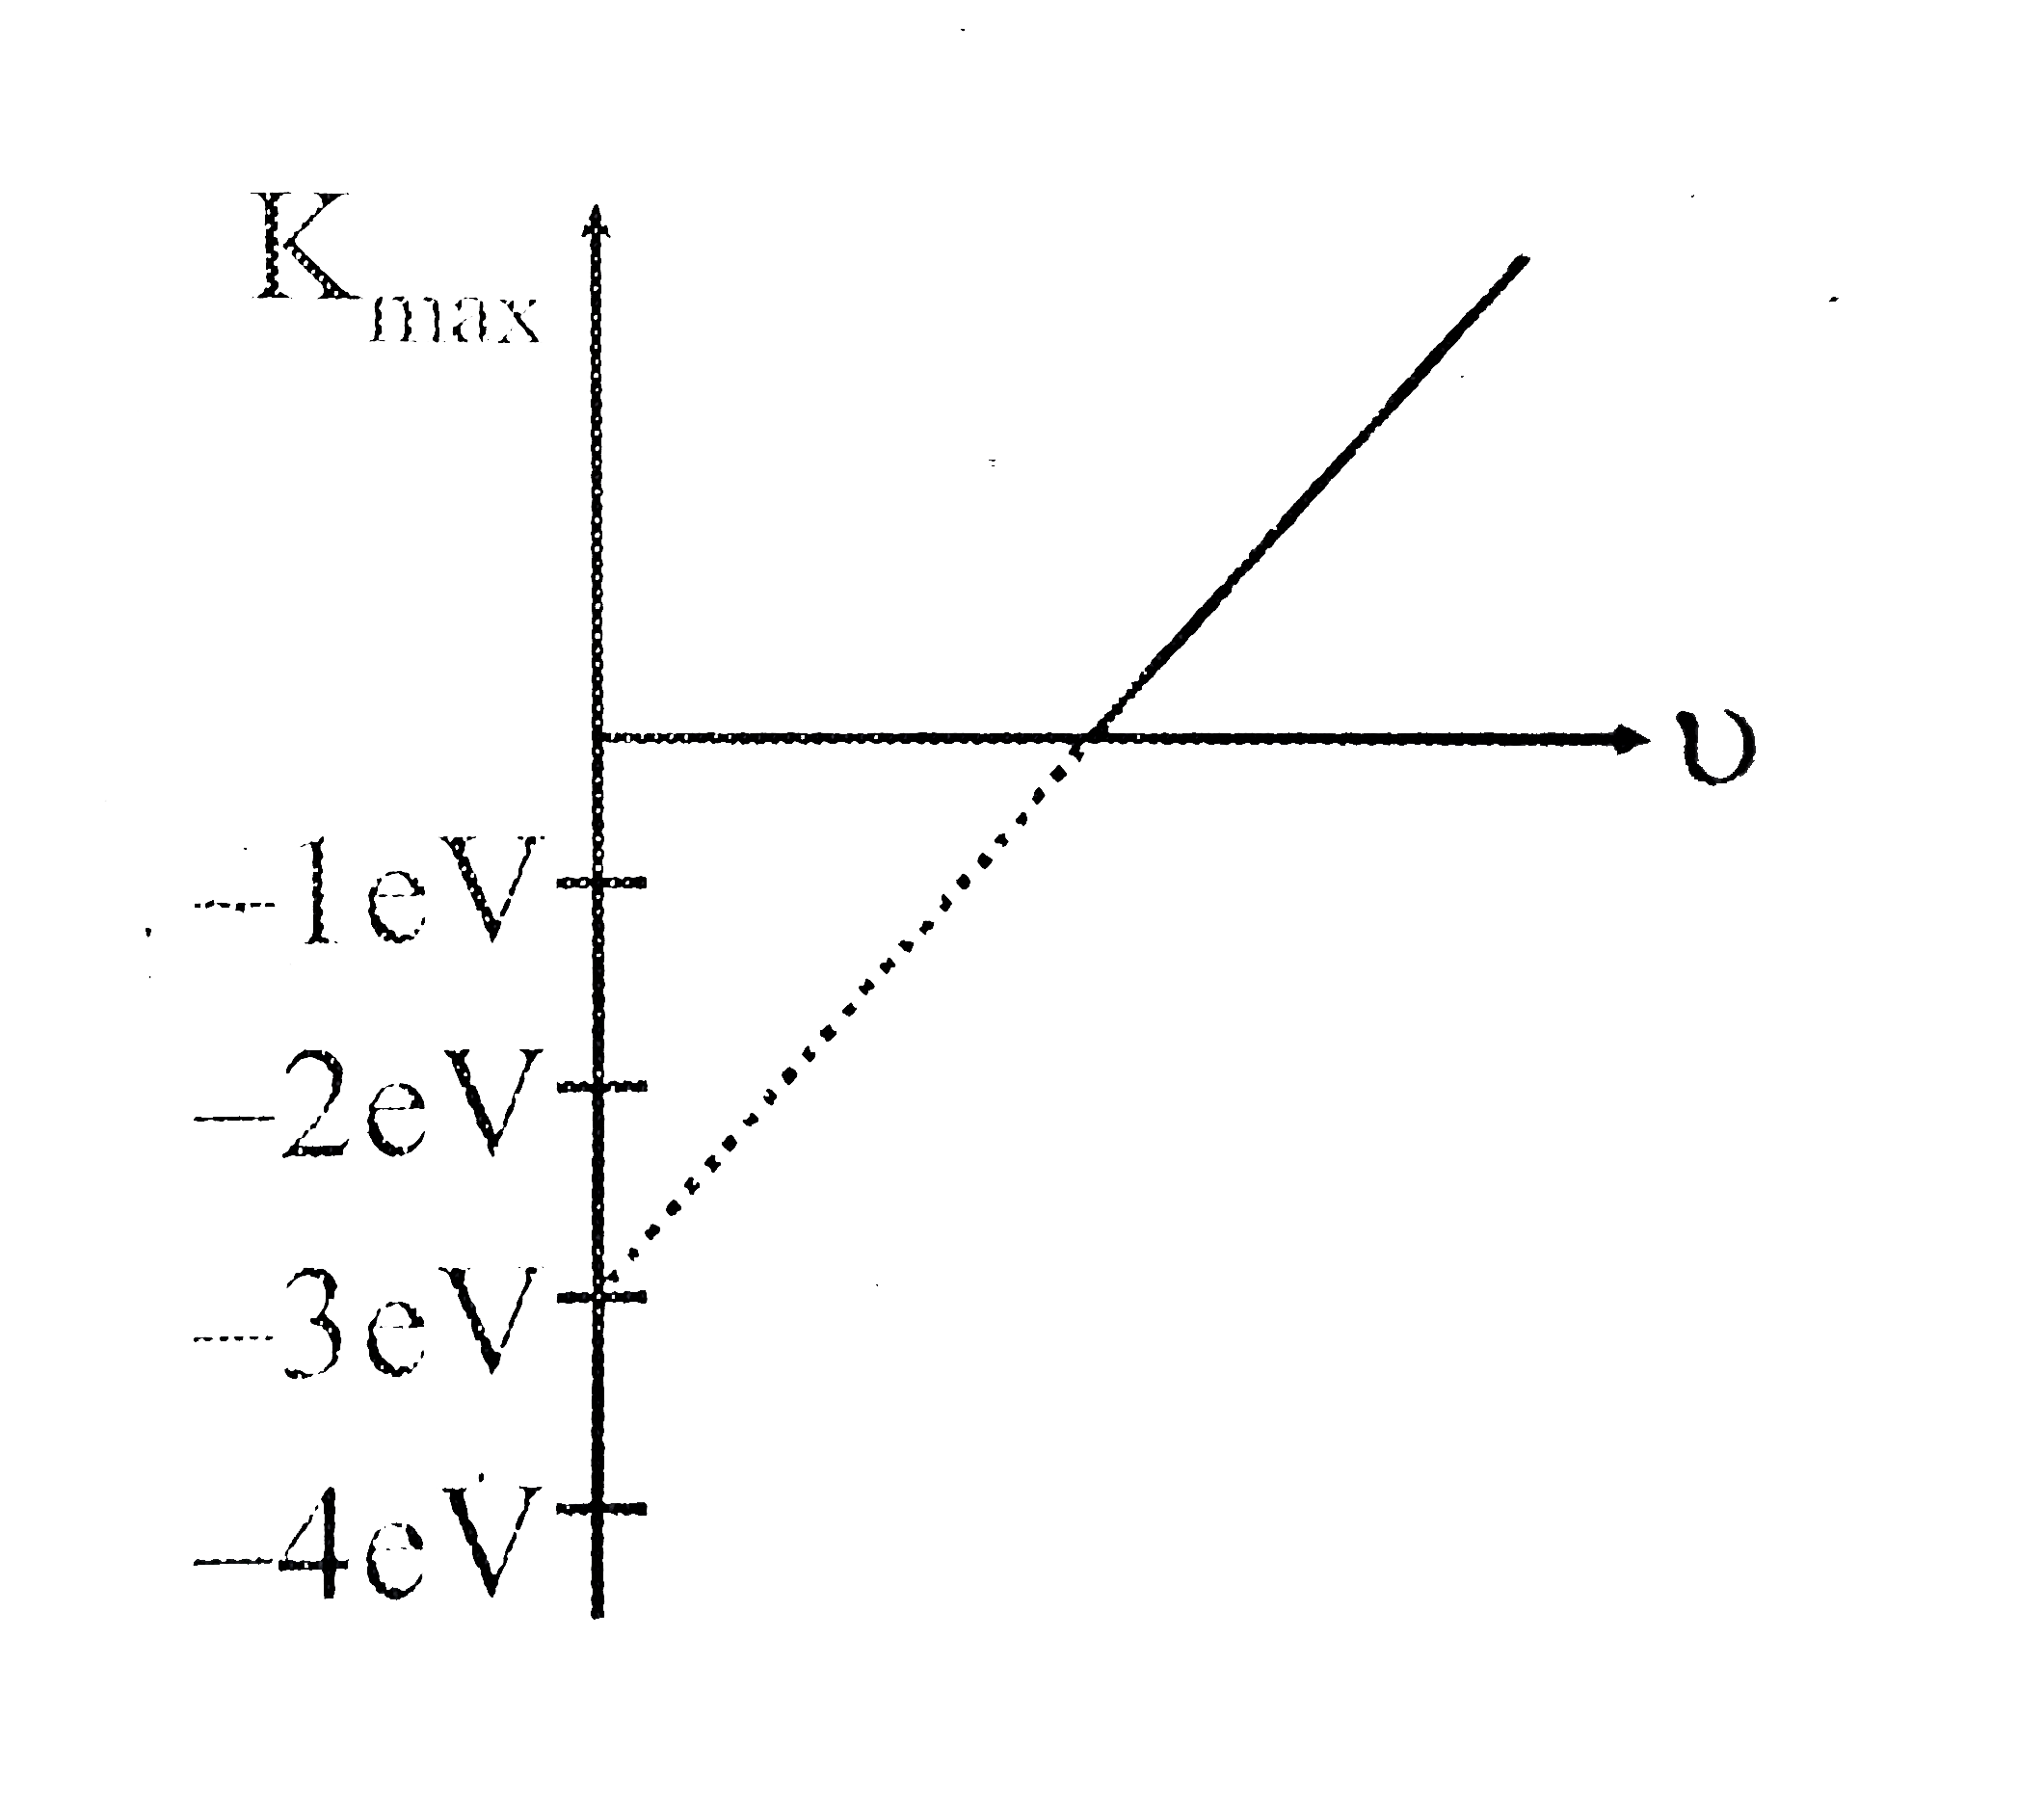
For a photoelectric experiment graph between kinetic energy of fastest electron and frequency of light is plotted find threshold wavelength of metal.
 View Solution
In a sonometer experiment, two wires are fixed whose tensions are in the ratio of 4 : 1, lengths in the ratio of 29 : 26 and diameter are in ratio of 2 : 1 and densities are in ratio of 4 : 5. What will be the frequency of beats produced if the frequency of note of higher pitch is 400 s−1 ?
View Solution
Knowledge Check
- Question 1 - Select One
In Searl's experiment a graph is plotted between
Aload on hanger and radius of wireBload on hanger and mean value of spherometer screw readingCradius of the wire and spherometer screw readingDnone of these - Question 2 - Select One
The graph between inductive reactance and frequency is
AparabolaBstraight lineChyperbolaDan arc of a circle - Question 3 - Select One
If the length of a sonometer, wire is increased, then its frequency
AIncreasesBDecreasesCRemains sameDNone of these.
Two vibrating strings of the same material but lengths L and 2L have radii 2r and r respectively. They are stretched under the same tension. Both the strings vibrate in their fundamental modes, the one of length L with frequency n1 and the other with frequency n2 the ratio n1/n2 is given by
View SolutionIn a photoelectric effect experiment, the slope of the graph between the stopping potential and the incident frequency will be :
View SolutionIn a photoelectric effect experiment, the slope of the graph between the stopping potential and the incident frequency will be :
View SolutionIn photoelectric effect the slope of stop of stopping potential versus frequency of incident light for a given surface will be
View SolutionThe correct graph between the frequency n and square root of density ρ of a wire, keeping its length, radius and tension constant, is
View Solution

