In a photoelectric effect experiment, the slope of the graph between the stopping potential and the incident frequency will be :
1
0.5
10−15
10−34
The correct Answer is:C
Similar Questions
The slope of the graph drawn between stopping potential and frequency of incident radiation will be
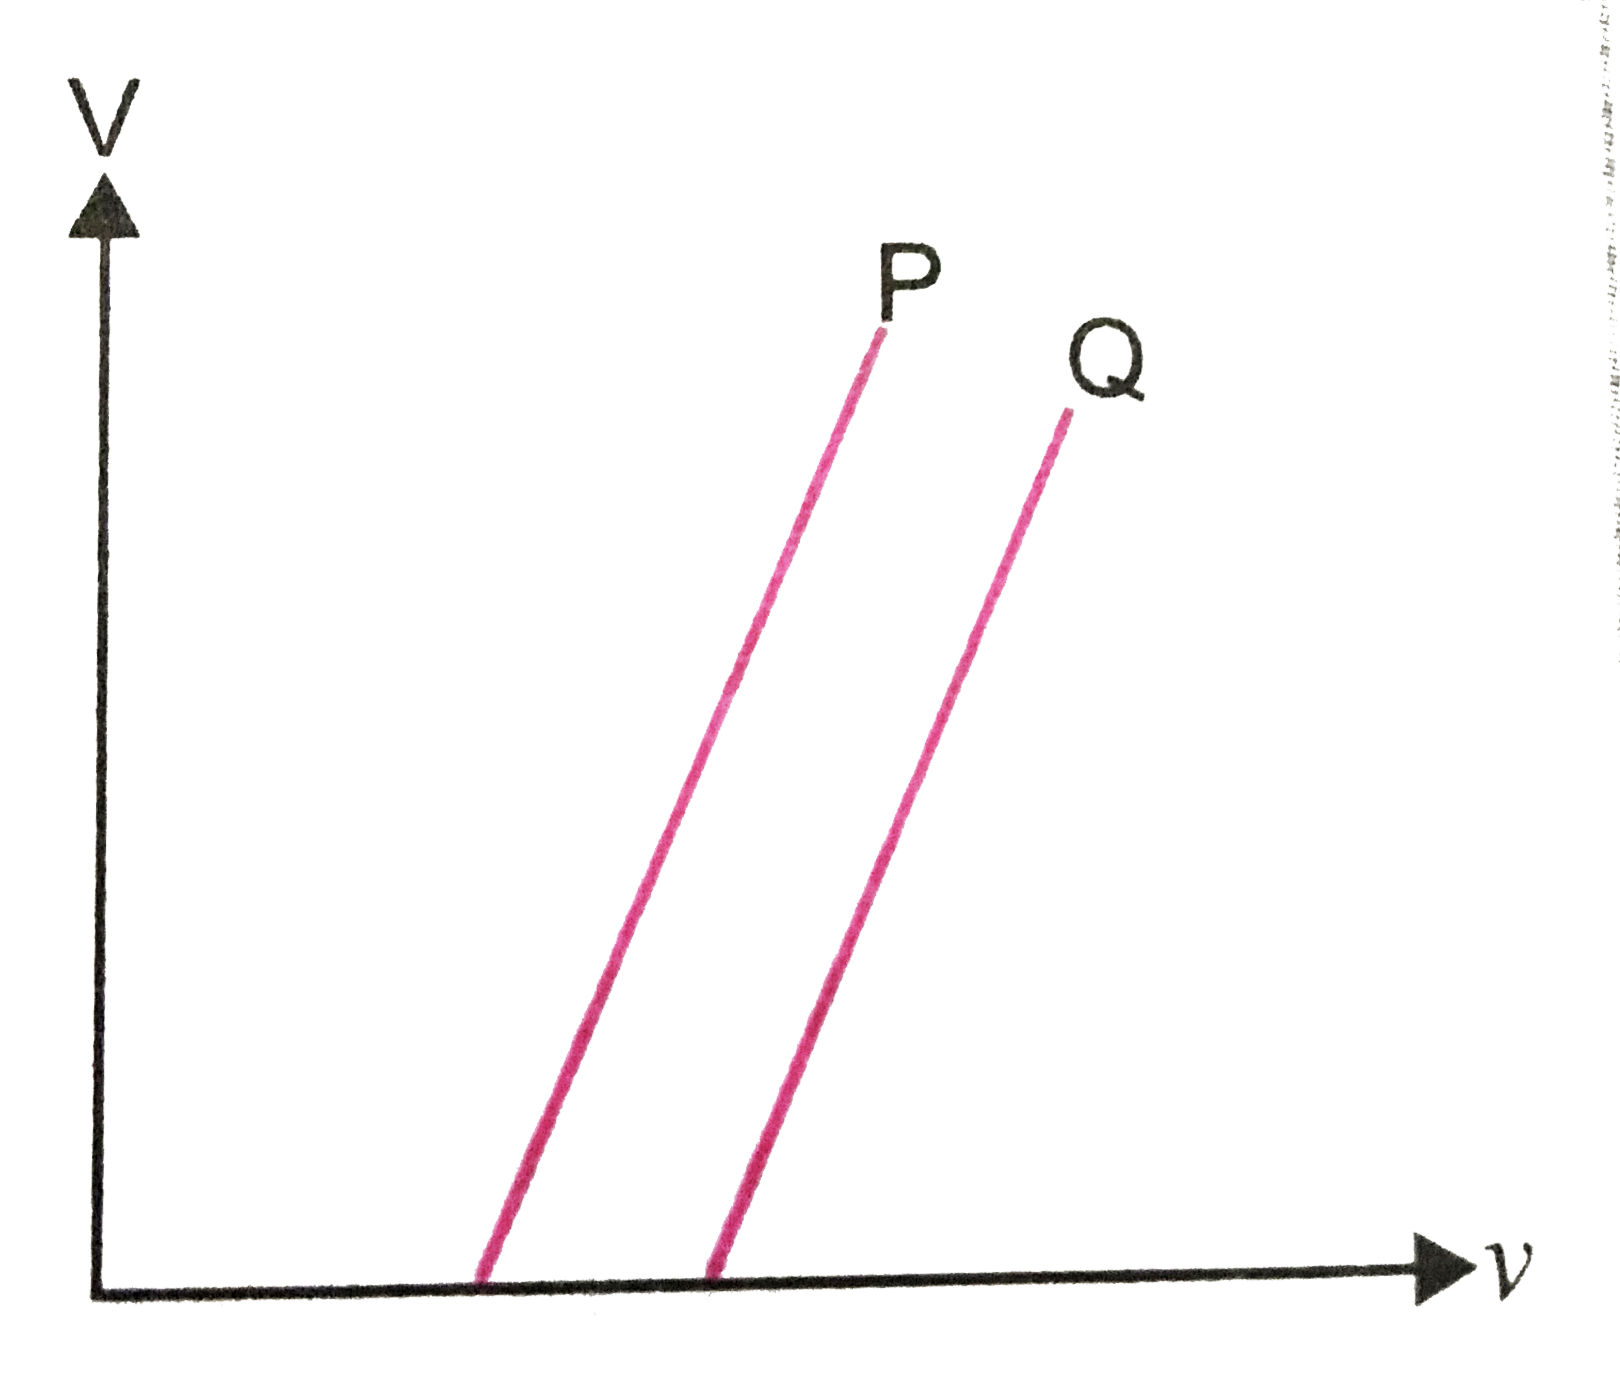
View SolutionIn a photoelectric effect experiment, the graph between the stopping potential (V) and frequency (v) of the incident radiations on two different metal plates P and Q are shown in plates, P and Q has greater value of work function ? (ii) What does the slope of the lines depict?

View Solution
Knowledge Check
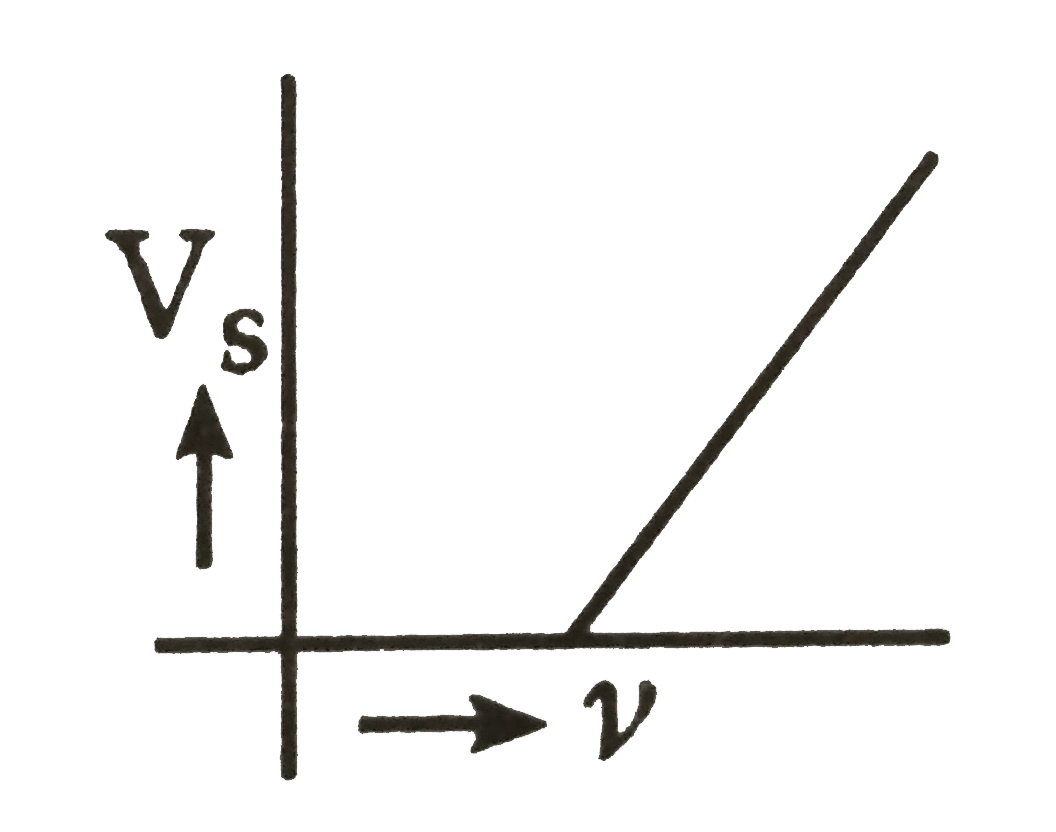
In photoelectric effect the slope of straight line graph between stopping potential (Vs) and frequency of incident light (v) gives
 A10−14B5×10−14C4×10−15D4×10−34
In photoelectric effect experiment, the slope of the graph of the stopping potential versus frequency gives the value of :
AheBhCehDhceIn photo electric effect, the slope of the straight line graph between stopping potential and frequency of the incident light gives the ratio of Planck's constant to
Acharge of electronBwork functionCphoto electric currentDK.E. of electron
In photoelectric effect the slope of straight line graph between stopping potential (Vs) and frequency of incident light (v) gives

View SolutionIn photoelectric effect the slope of straight line graph between stopping potential (Vs) and frequency of incident light (v) gives

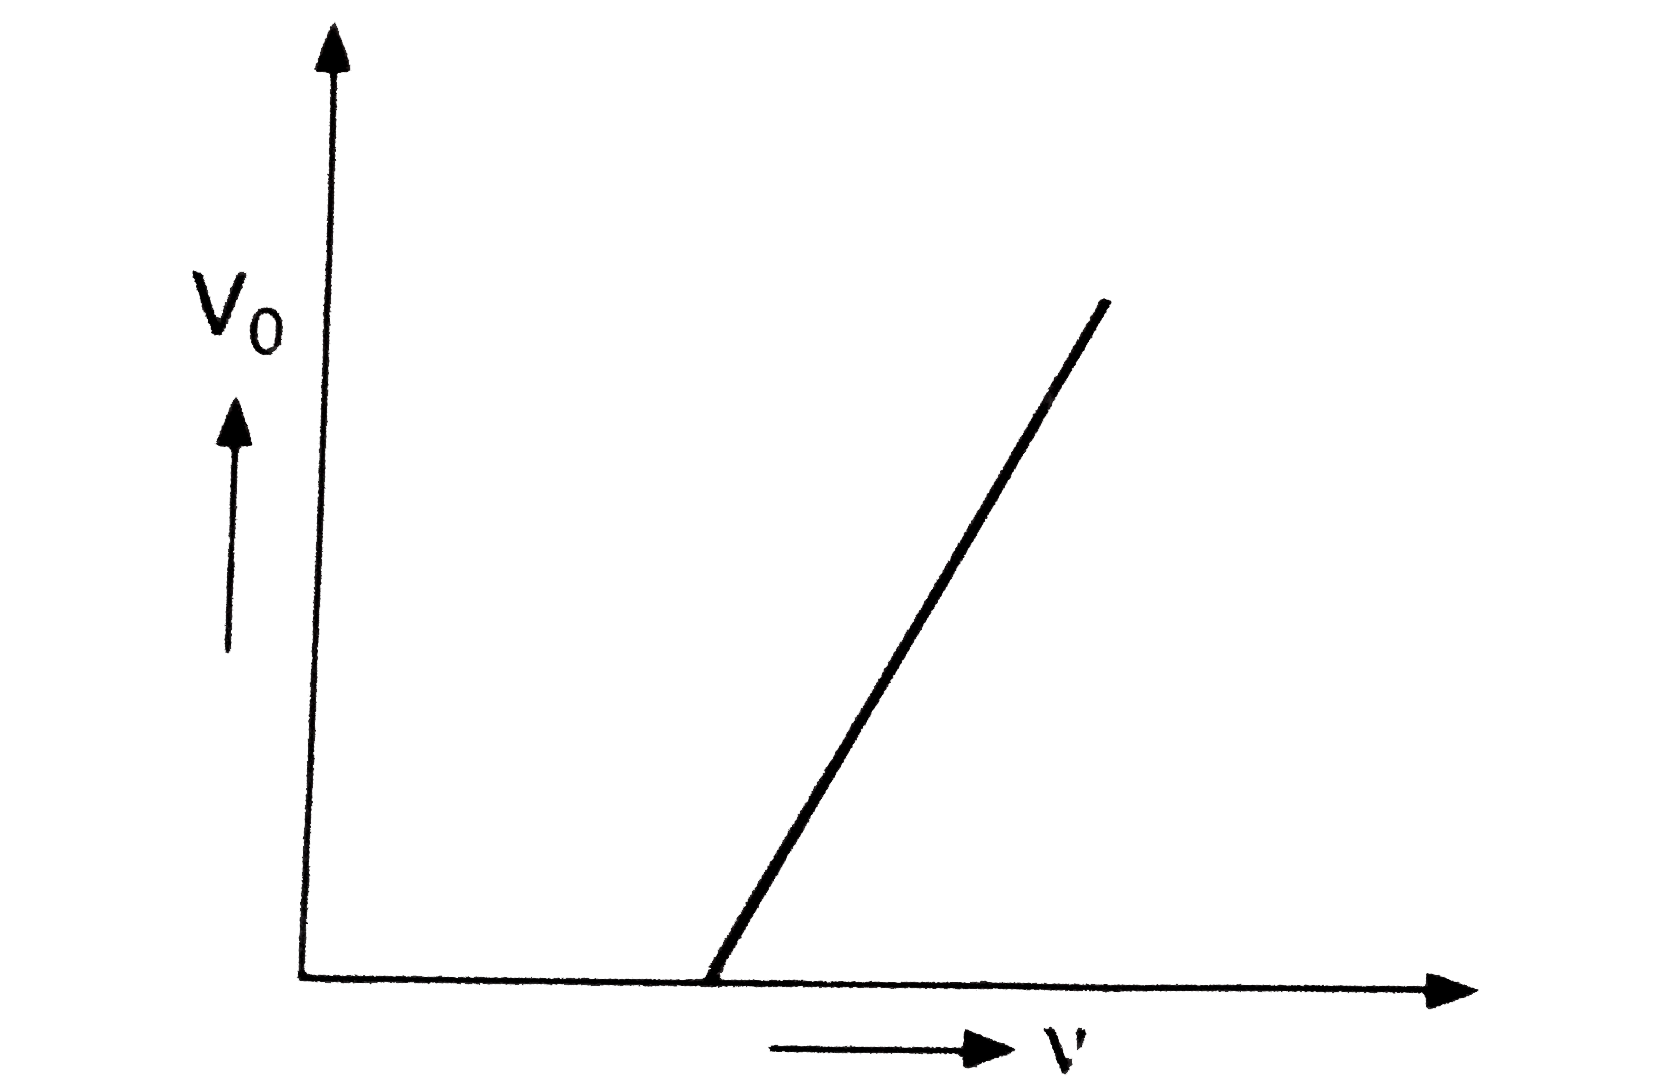
View SolutionIn photoelectric effect the slope of straight line graph between stopping potential (V0) and freqency of incident light (v) gives:

View SolutionIn a photoelectric experiment, a student plotted the graph of stopping potential (Vs) against the frequency of incident radiation (v). But he could not write the unit of the slope of the graph. What is the corrent unit ?
View SolutionIn photoelectric effect the slope of stop of stopping potential versus frequency of incident light for a given surface will be
View Solution
