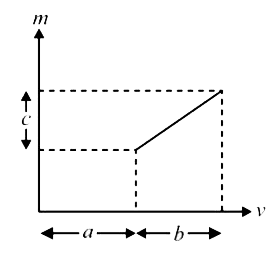
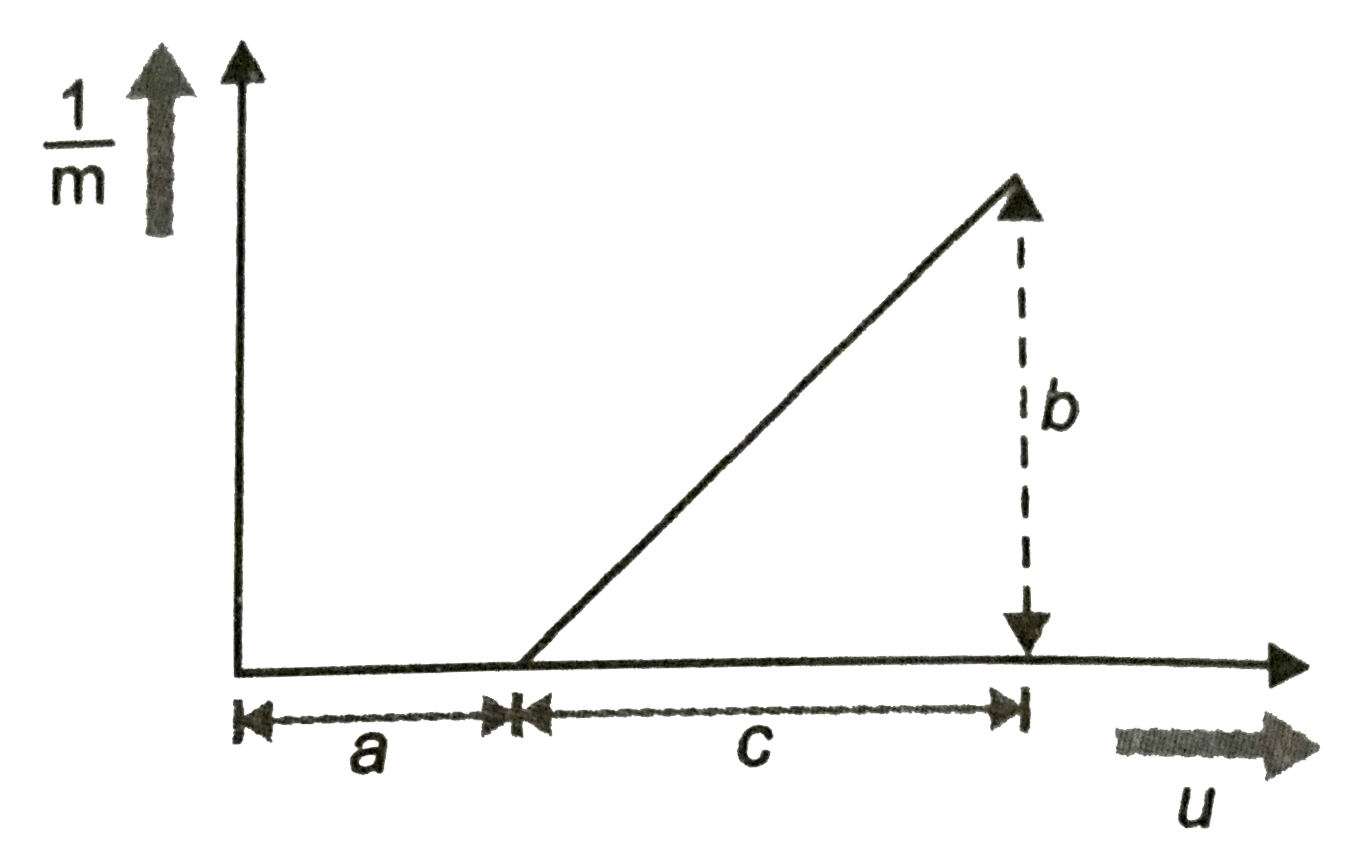
The graph in Fig. shows how the inverse of magnification 1/m produced by a convex thin lens varies with object distance u. What was the focal length of the lens used ?
 .
.
bc
bca
bca
cb
The correct Answer is:D
From 1v−1u=1f
uv−1=uf
1m−1=uf
or 1m=(1f)u+1
Which is the equation of a st line whose slope
1f=bc∴f=cb.
Topper's Solved these Questions
- RAY OPTICSBOOK - PRADEEPCHAPTER - RAY OPTICSEXERCISE - (Competition)Comprehension
7 Videos
- RAY OPTICSBOOK - PRADEEPCHAPTER - RAY OPTICSEXERCISE - Integer Question
4 Videos
- RAY OPTICSBOOK - PRADEEPCHAPTER - RAY OPTICSEXERCISE - (Exemplar) Multiple choice
16 Videos
- PROPERTIES OF BULK MATTERBOOK - PRADEEPCHAPTER - PROPERTIES OF BULK MATTEREXERCISE - Multiple choice questions
7 Videos
- SYSTEMS OF PARTICLES AND ROTATIONAL MOTIONBOOK - PRADEEPCHAPTER - SYSTEMS OF PARTICLES AND ROTATIONAL MOTIONEXERCISE - Assertion- Reason Type questions
20 Videos
Similar Questions
Knowledge Check
The graph shows how the magnification m produced by a convex thin lens varies with image distance v. What was the focal length of the used ?
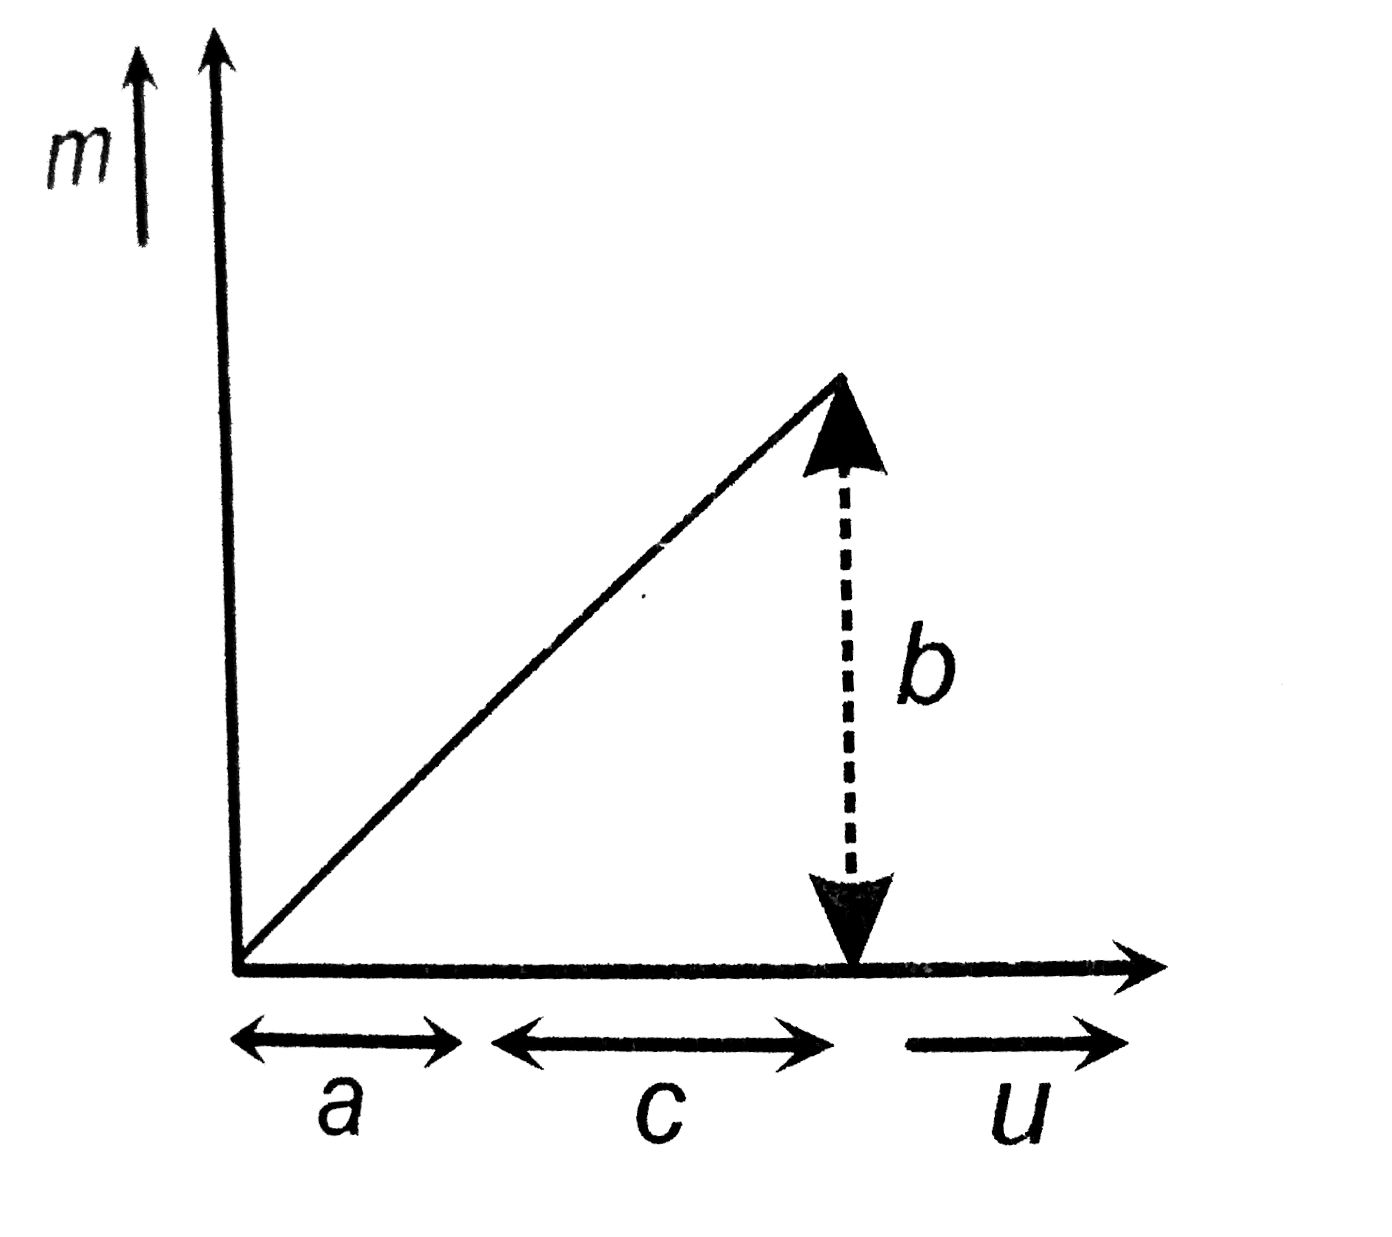 AbcBbcaCbcaDcb
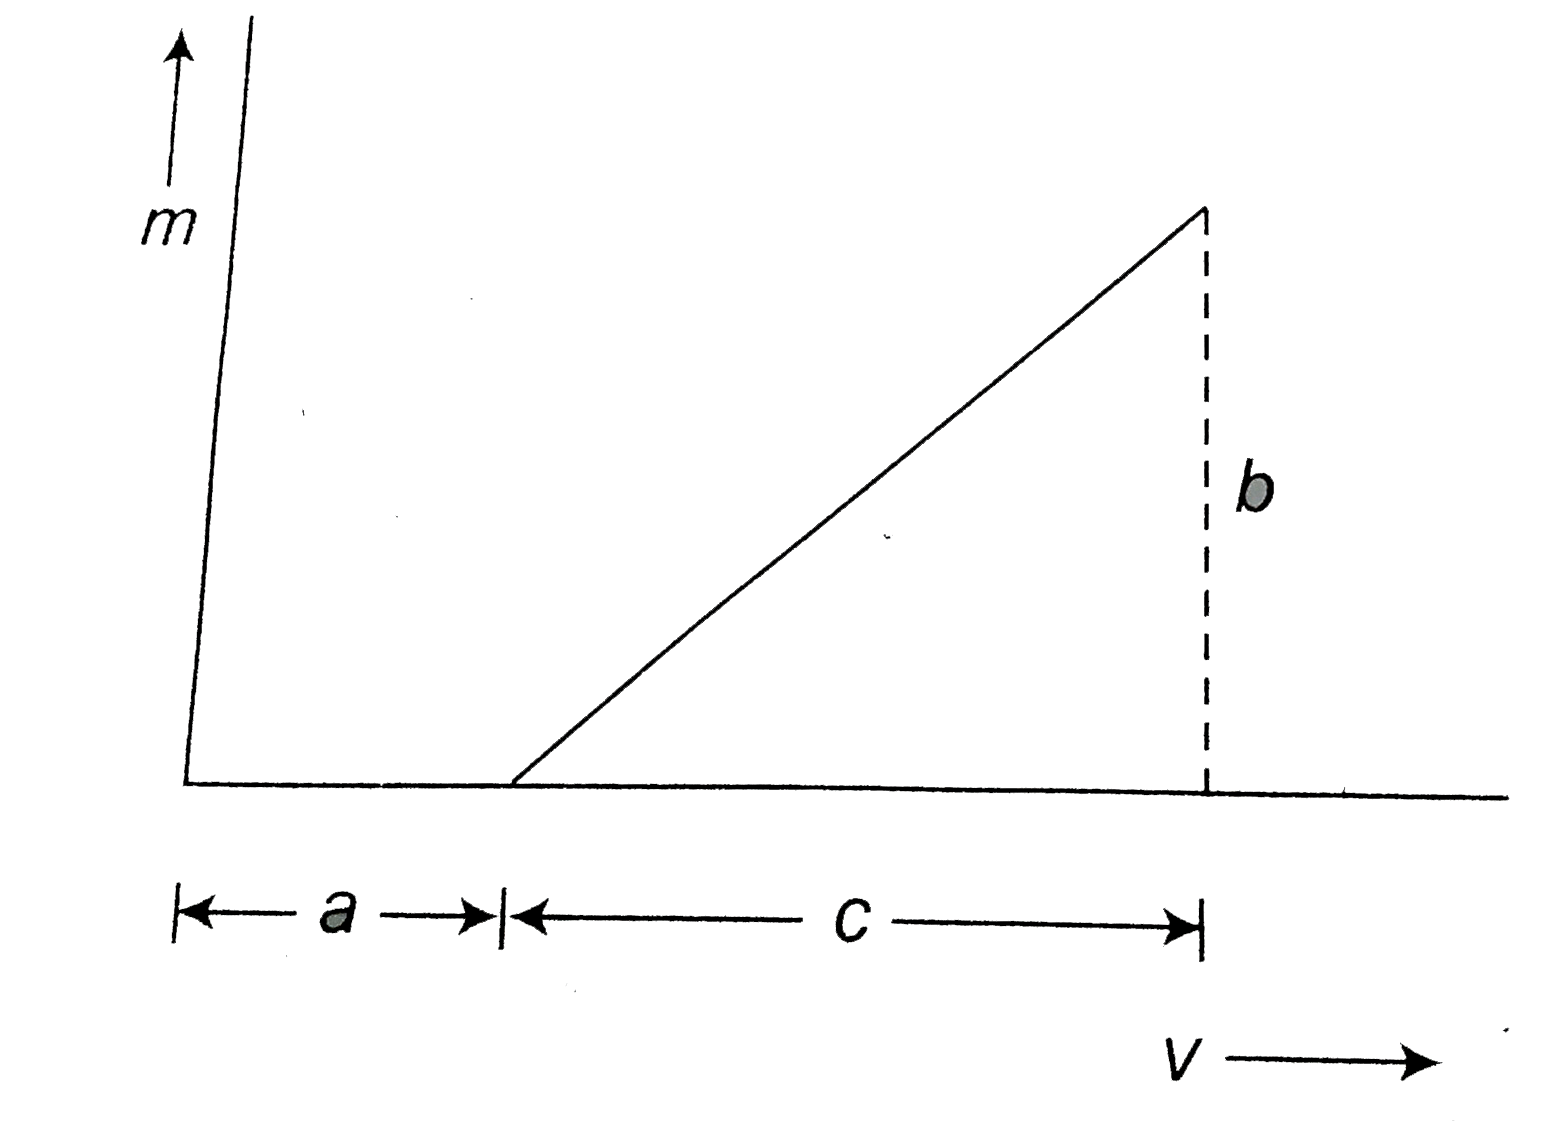
The graps shows the variation of magnification m produced by as convex lens with the image distance v. The focal length of the lens isAbcBcbCaDa,bcThe following graph depicts the inverse of magnification versus the distance between the object and lens data for a setup. The focal length of the lens used in the setup is
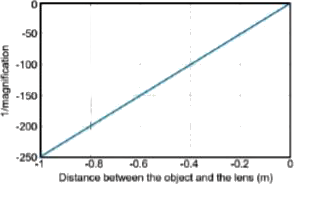 A250 mB0.004 mC125 mD0.002 m
The following graph depicts the inverse of magnification versus the distance between the object and lens data for a setup. The focal length of the lens used in the setup is

View SolutionDraw ray diagram showing the image formation by a convex lens when an object is placed at twice the focal length of the lens.
View SolutionA thin converging lens forms the real image of certain real object magnified m times.The magnification of real image become n when lens is moved nearer to object by distance x . find focal length of the lens
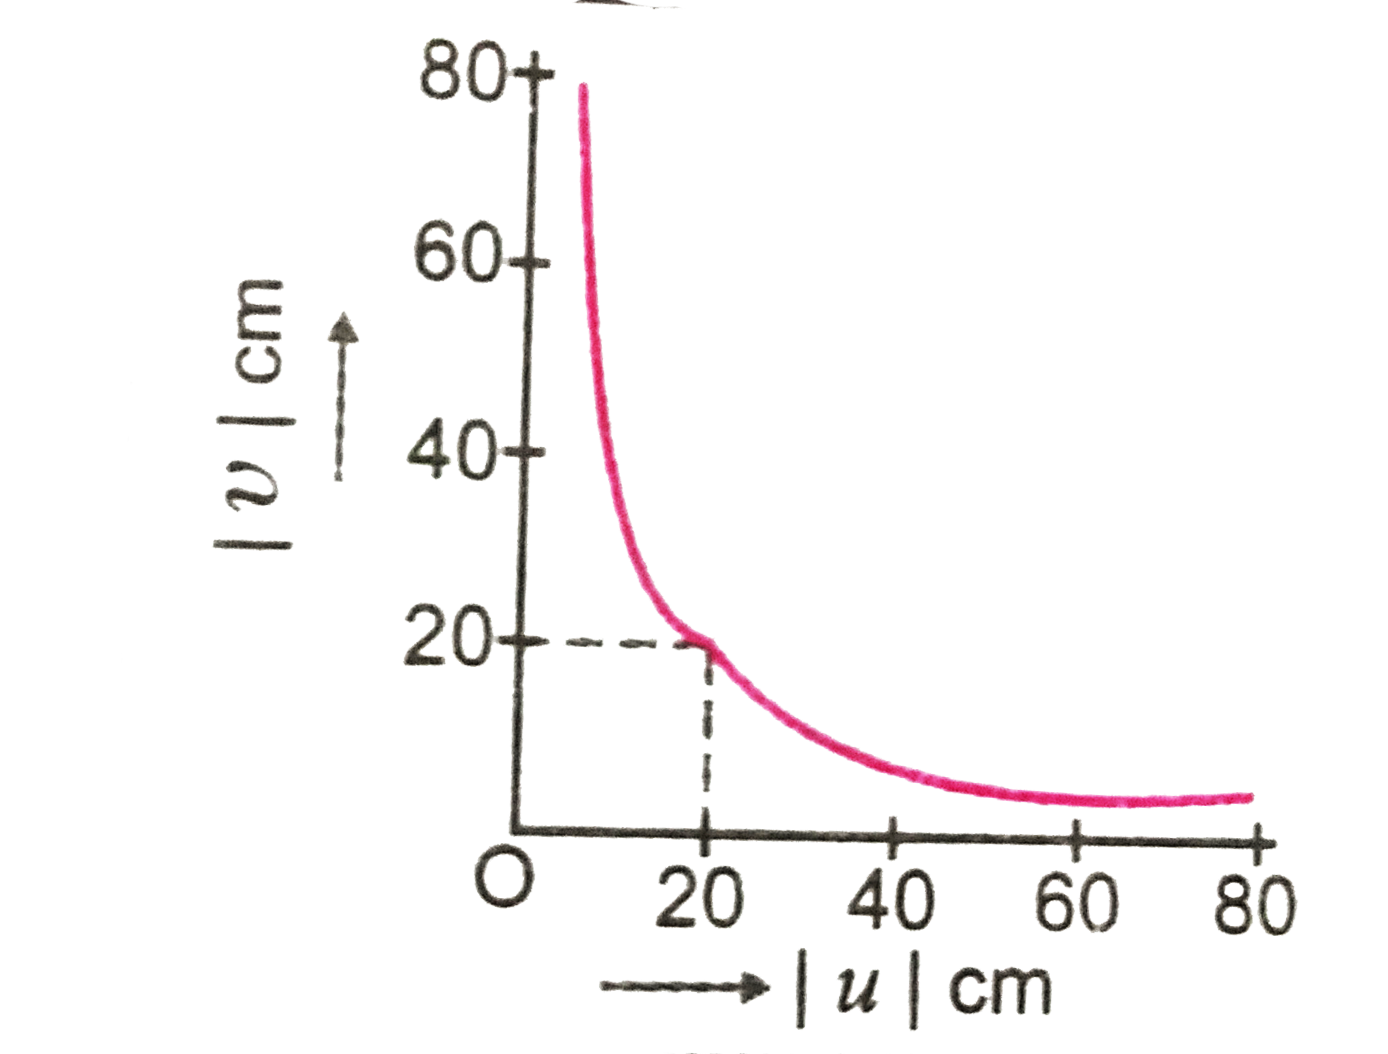
View SolutionThe graph in shows the variation of image distance (v) with object distance (u) in case of a lens. Find focal length of the lens. What is the nature of the lens, if image formed is real ?
 .
.
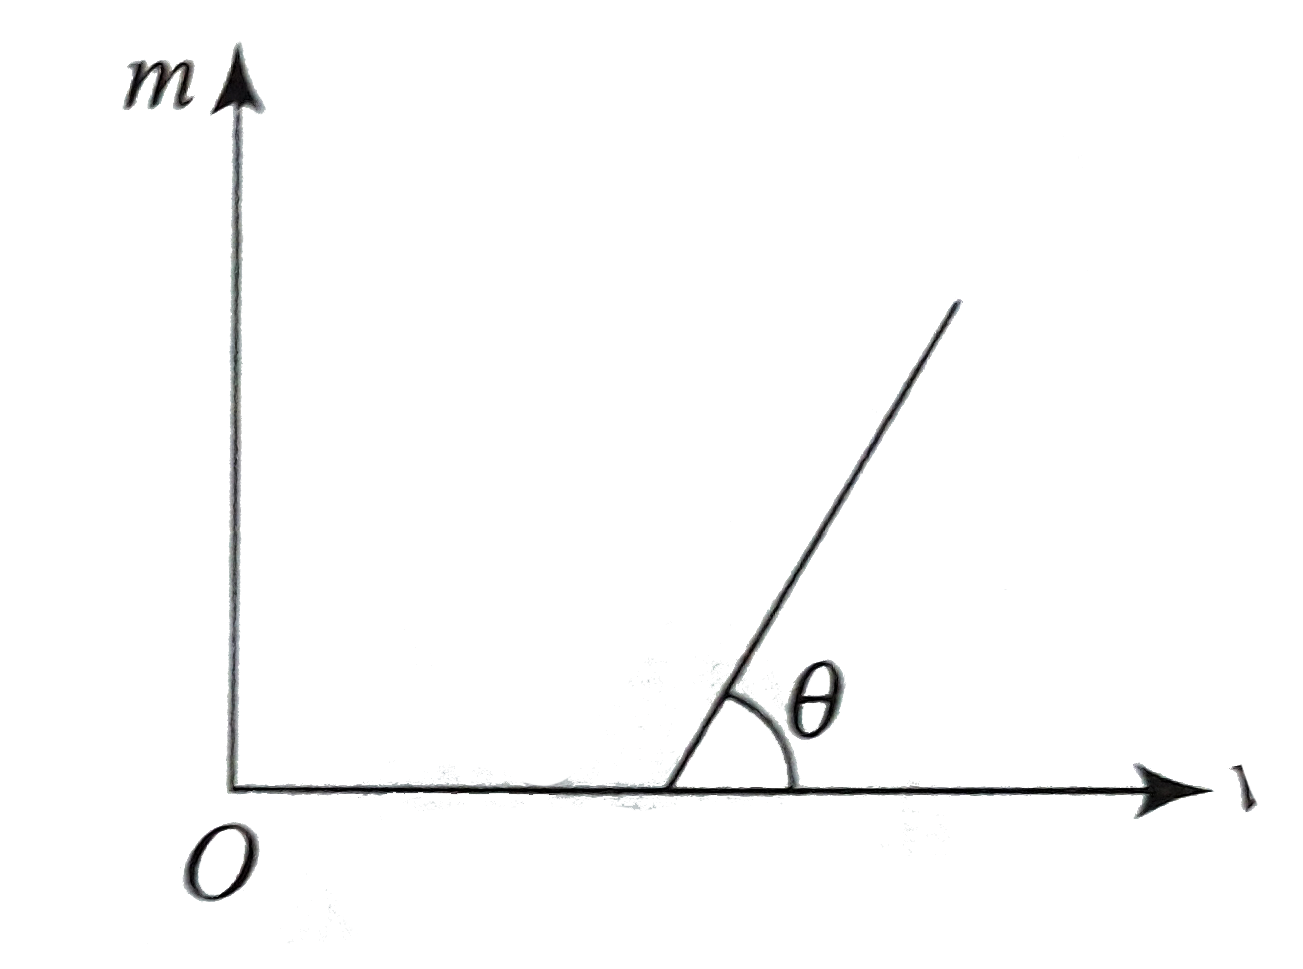
View SolutionFigure, shows variation of magnification m (produced by a thin convex lens) and distance v of image from pole of the lens. When of the following statements are correct?
View Solution

