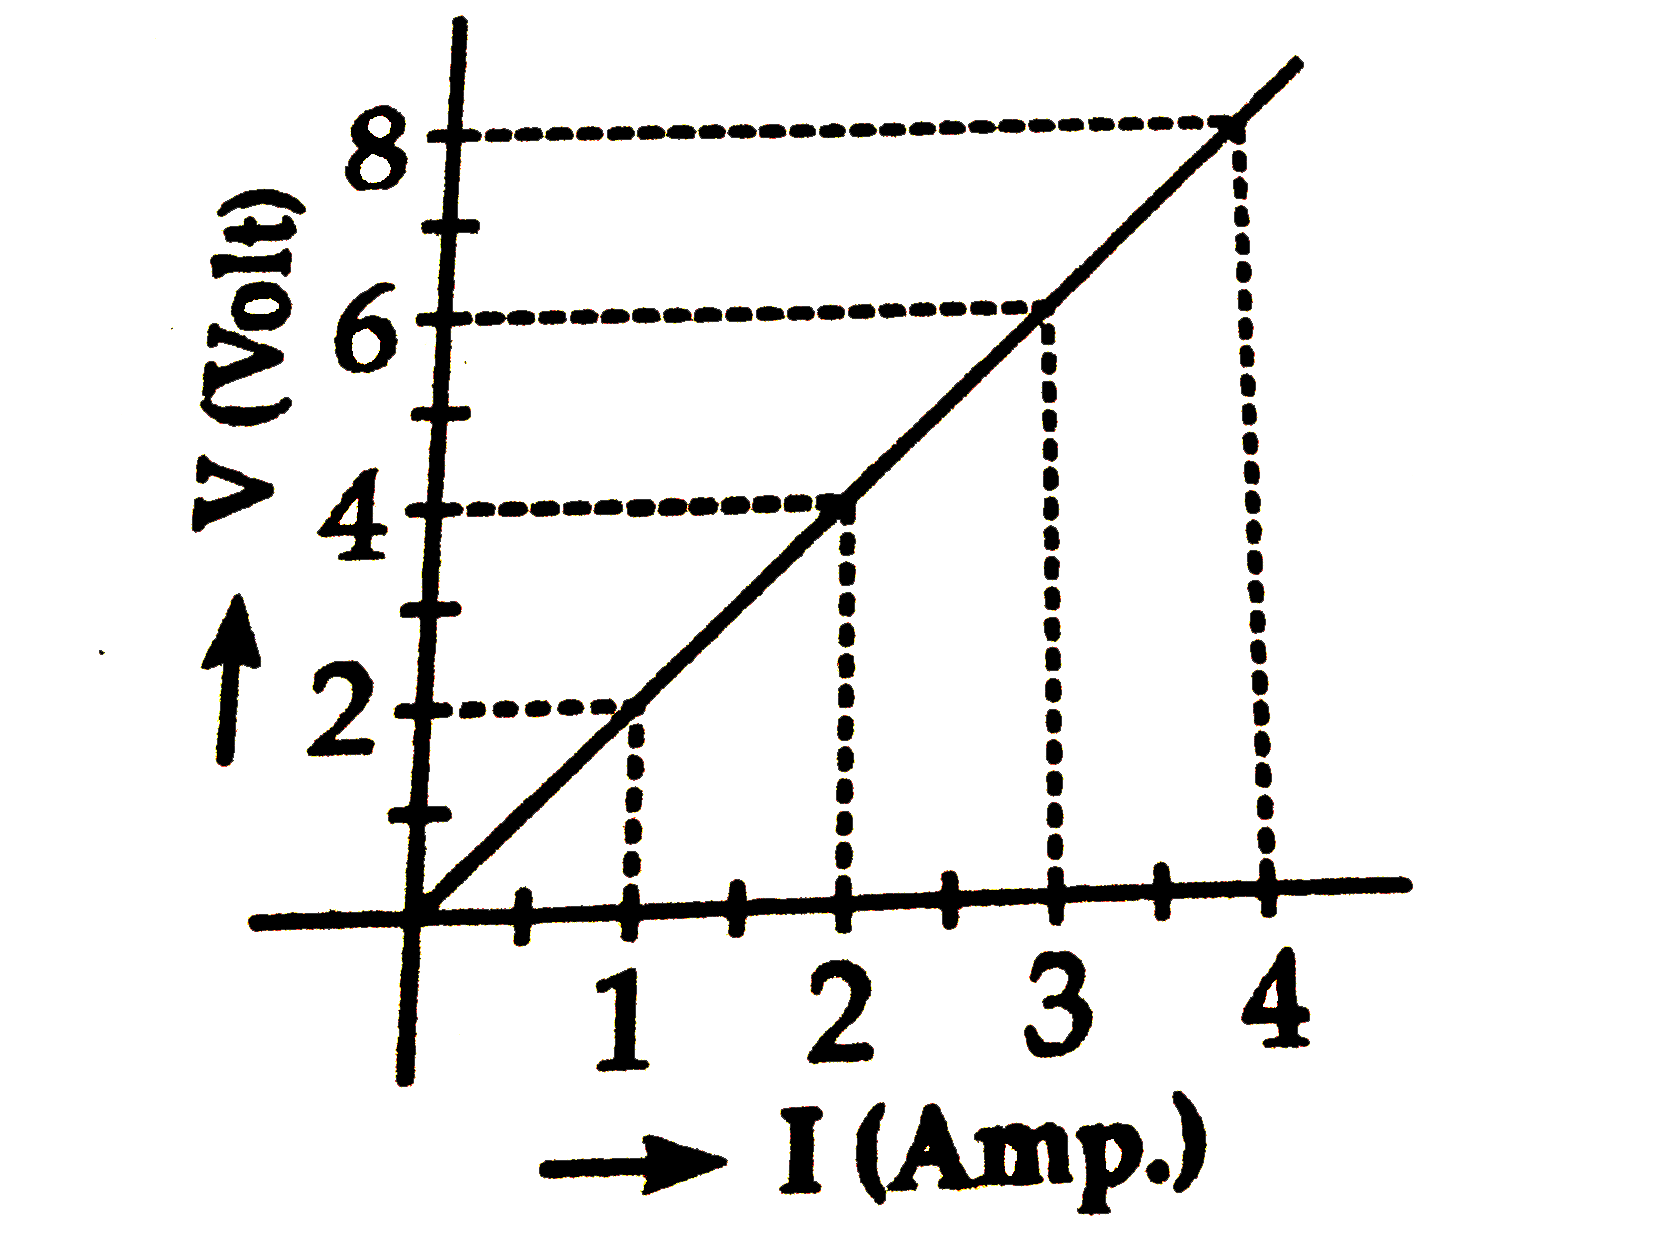
Variation of current and voltage in a conductor is shown in the adjoining figure. The resistance of the conductor is
A
4Ω
B
2Ω
C
1Ω
D
0.5Ω
Video Solution
Text Solution
The correct Answer is:B
From graph,
Resistance = Slope of graph
=21=2Ω
|
Updated on:21/07/2023
Topper's Solved these Questions
- BOOK - NIKITA PUBLICATIONCHAPTER - CURRENT ELECTRICITYEXERCISE - Multiple Choice Questions314videos
CURRENT ELECTRICITY
- BOOK - NIKITA PUBLICATIONCHAPTER - COMMUNICATION SYSTEMSEXERCISE - Multiple Choice Questions (Examples for Practice)8videos
COMMUNICATION SYSTEMS
- BOOK - NIKITA PUBLICATIONCHAPTER - ELASTICITYEXERCISE - MCQ314videos
ELASTICITY
Similar Questions
Knowledge Check
- Question 1 - Select One
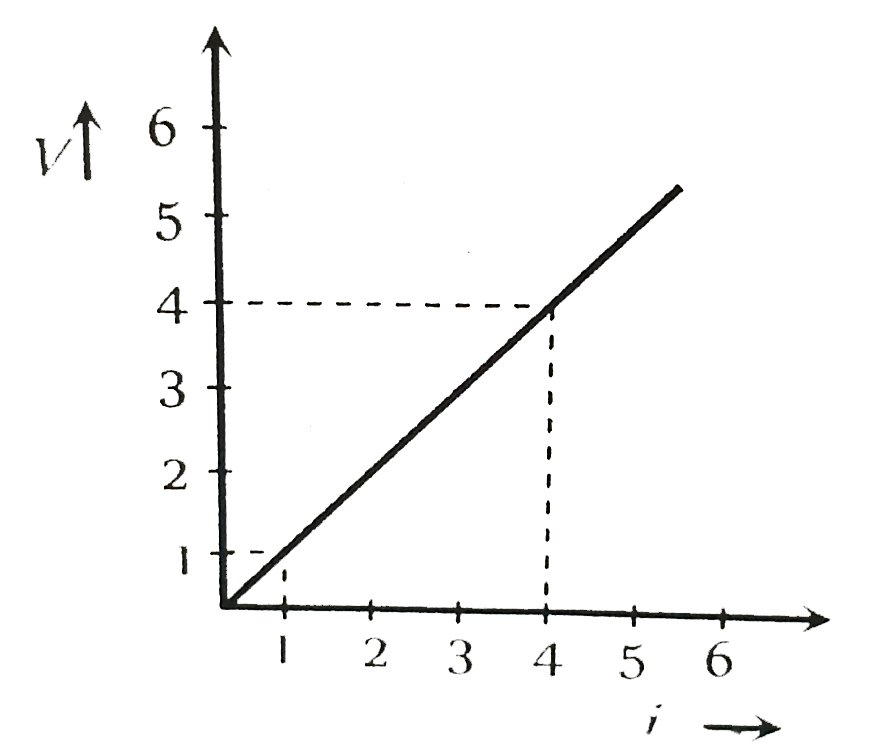
Variation of current and voltage in a conductor has been shown in the diagram below. The resistance of the conductor is.
 A4 ohmB2 ohmC3 ohmD1 ohm
 - Question 2 - Select One
Relation between current in a conductor and time is shown in fig.
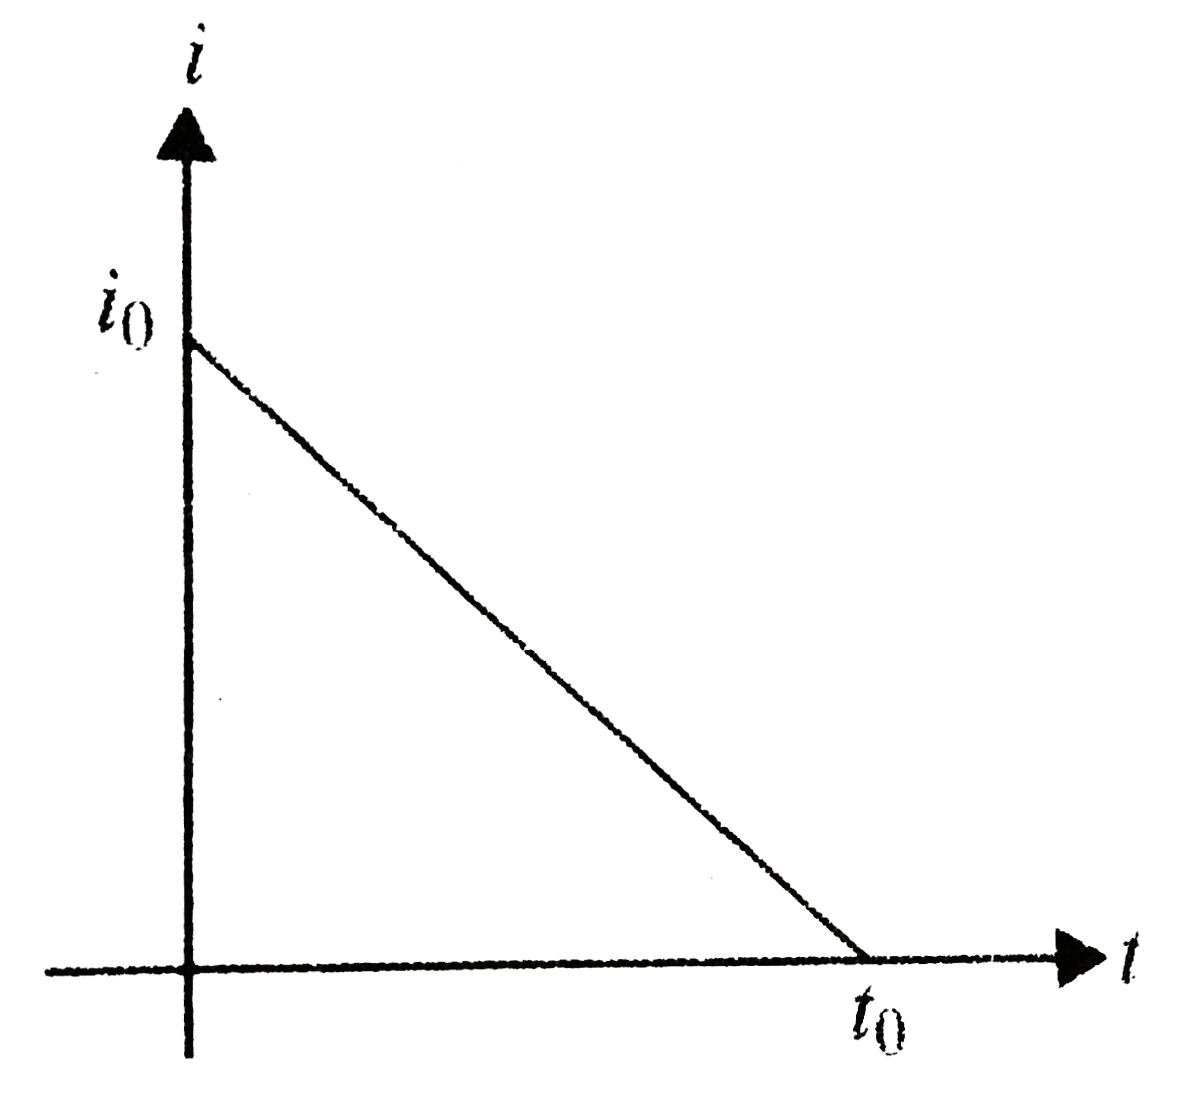
If the resistance of the conductor is R, then the total heat disspipated across resistance R isAi20Rt02Bi20Rt04Ci20Rt03Di20Rt0 - Question 3 - Select One
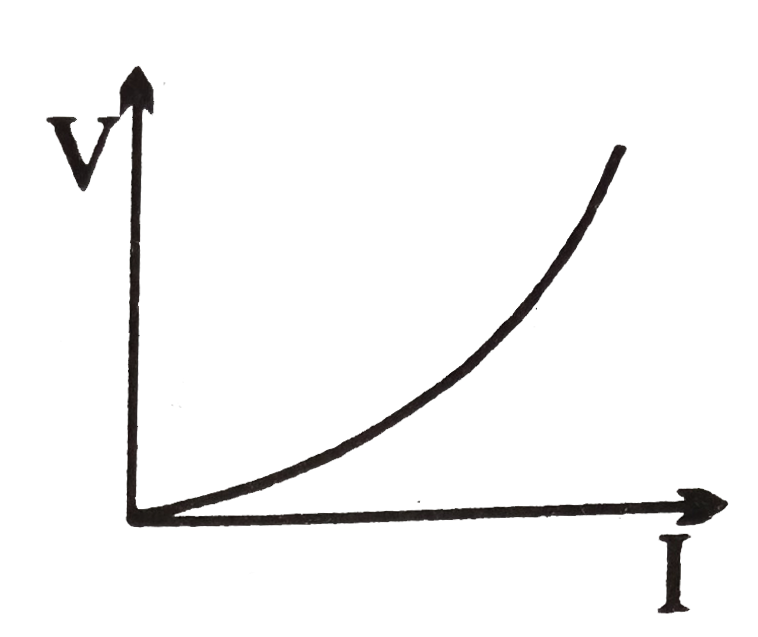
The variation of current (I) and voltage (V) is as shown in figure A. The variation of power P with current I is best shown by which of the following graph
 A
A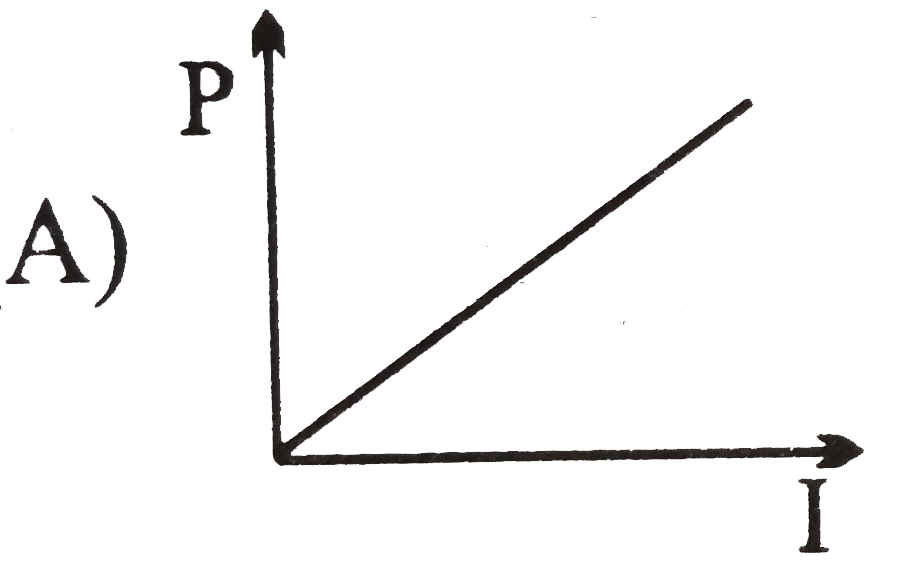 B
B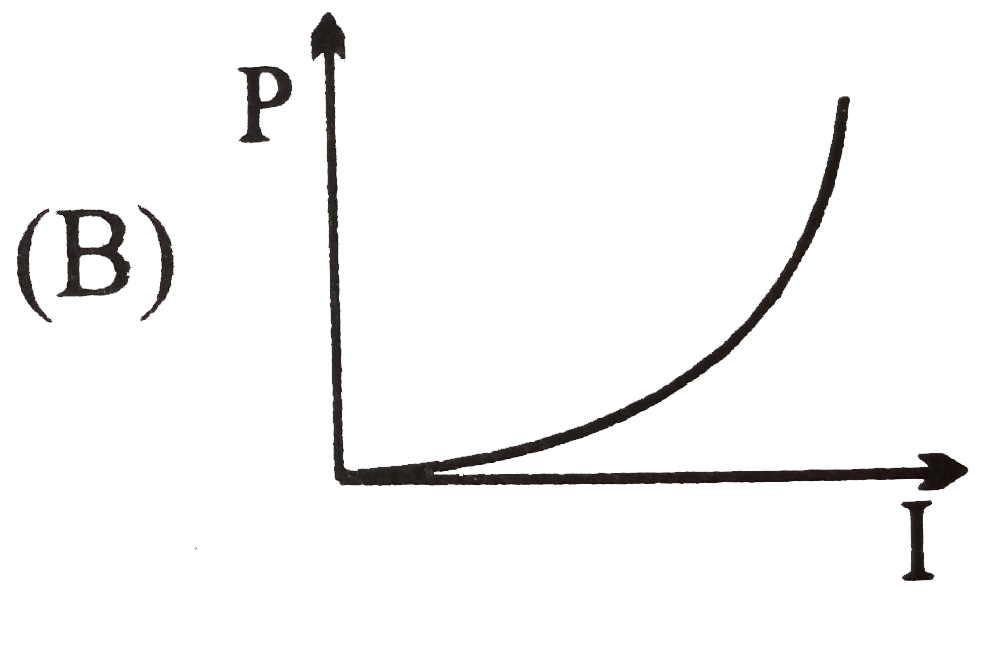 C
C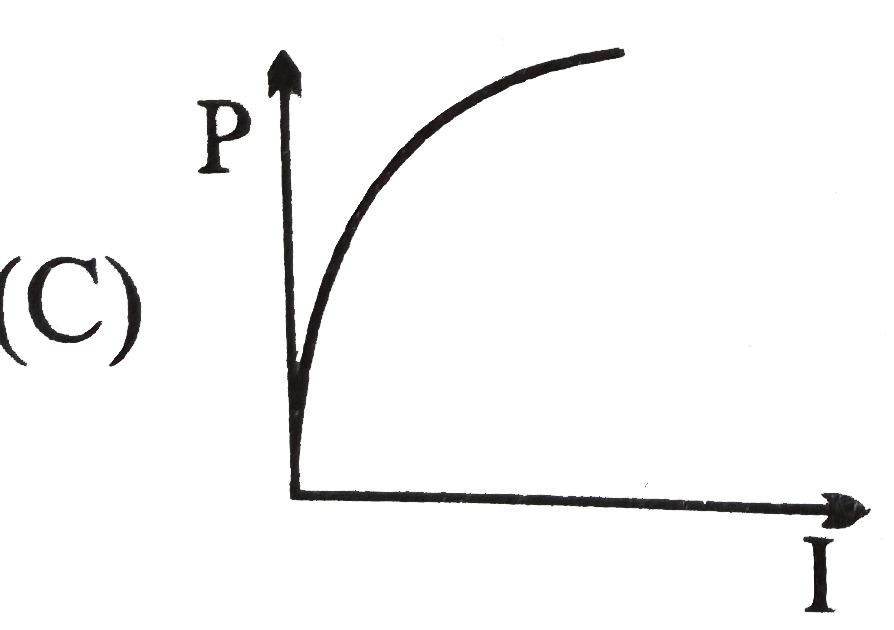 D
D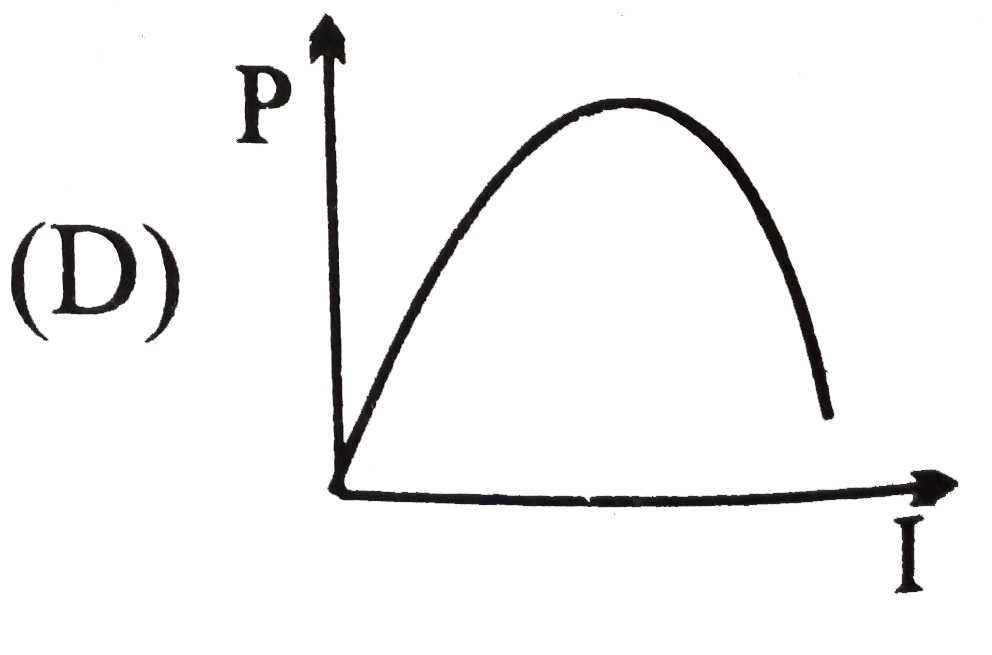
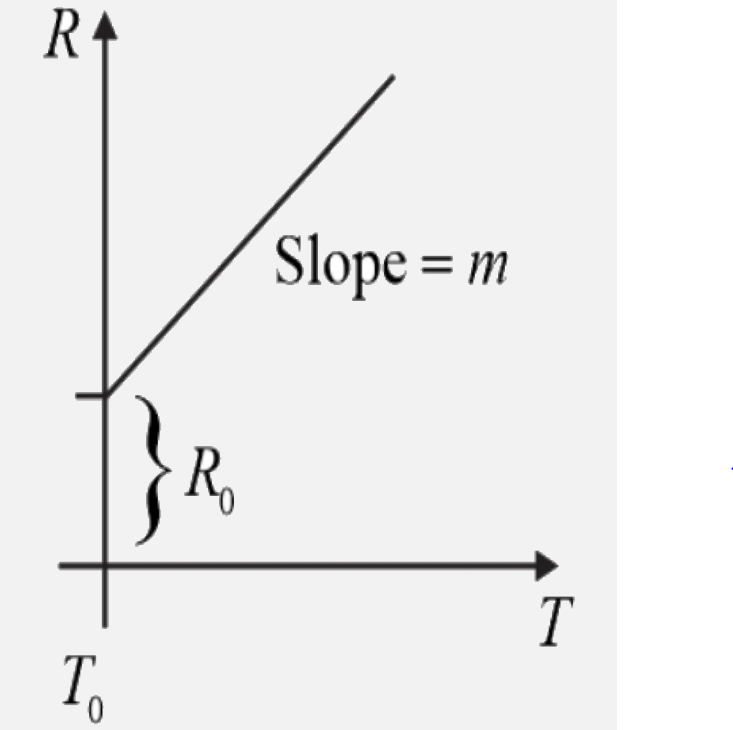
Variation of resistance of the conductor with temperature is shown . Temperature coefficient of the conductor is
 View Solution
For a given voltage and time ,the heat produced in a conductor is ……. To the resistance of the conductor
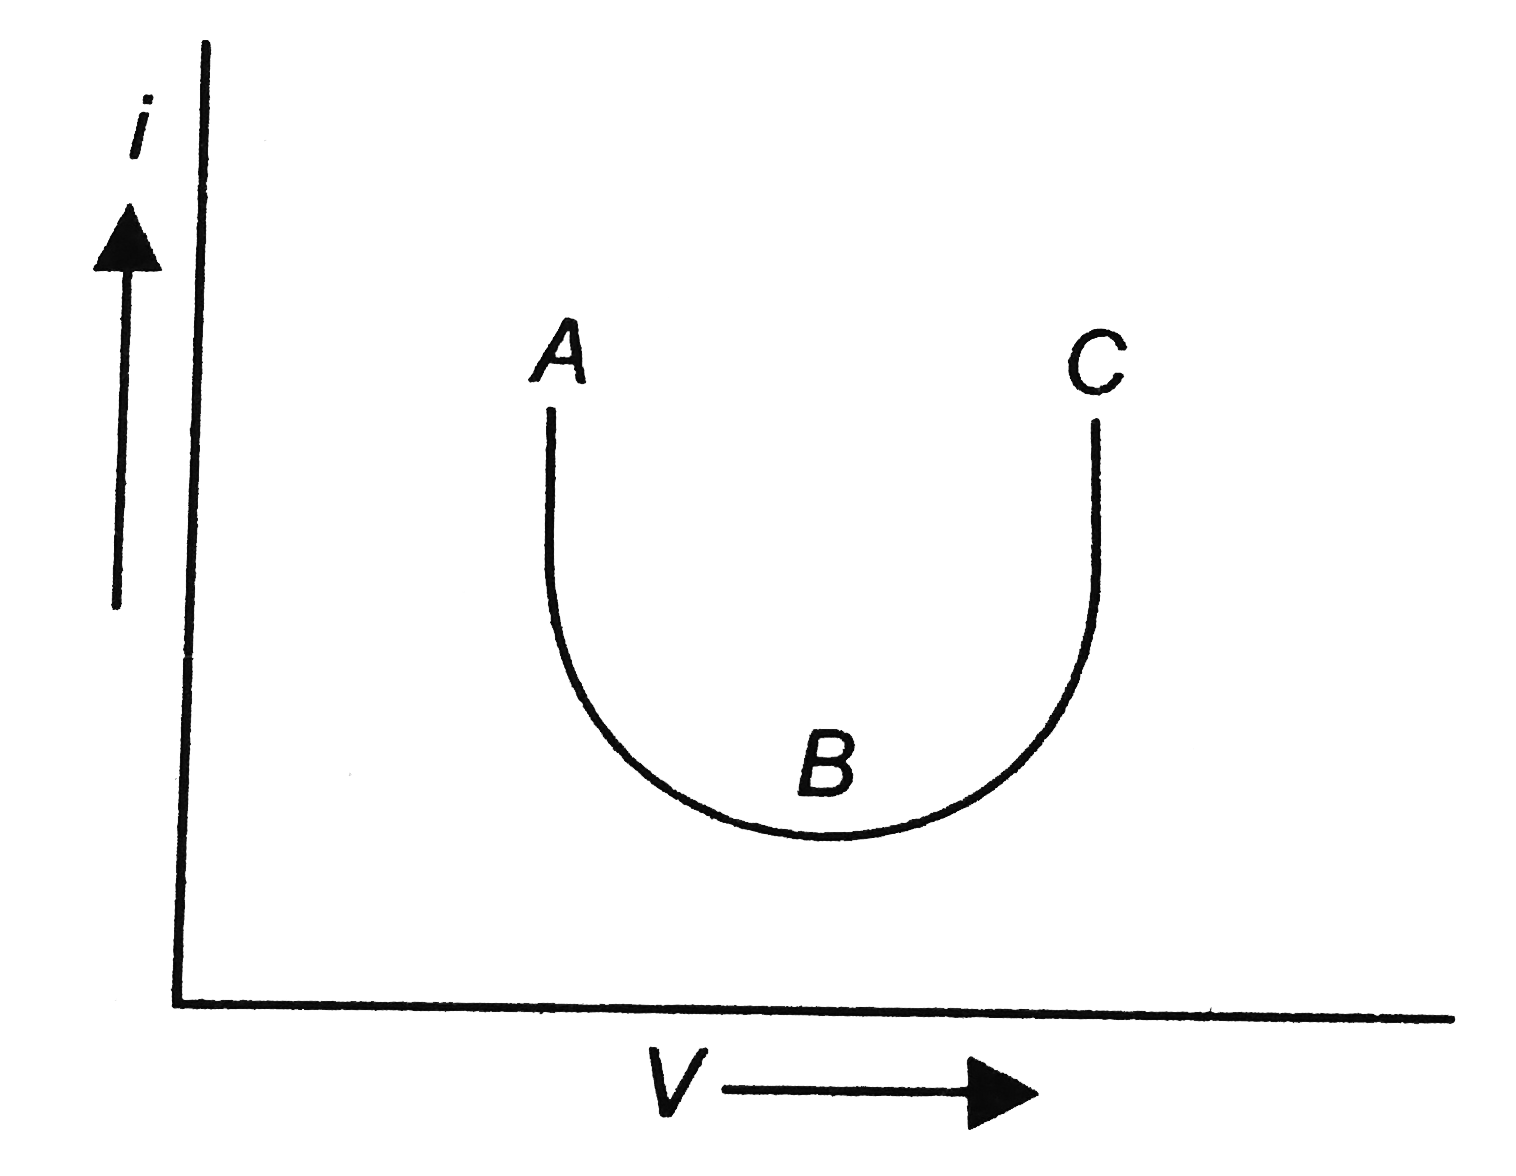
View SolutionThe current-voltage graph of a device is shown in figure. The resistance is negative in region.
 View Solution
In the network of resistors shown in the adjoining figure, the equivalent resistance between A and B is
 View Solution
Relation between current in a conductor and time is shown in fig.
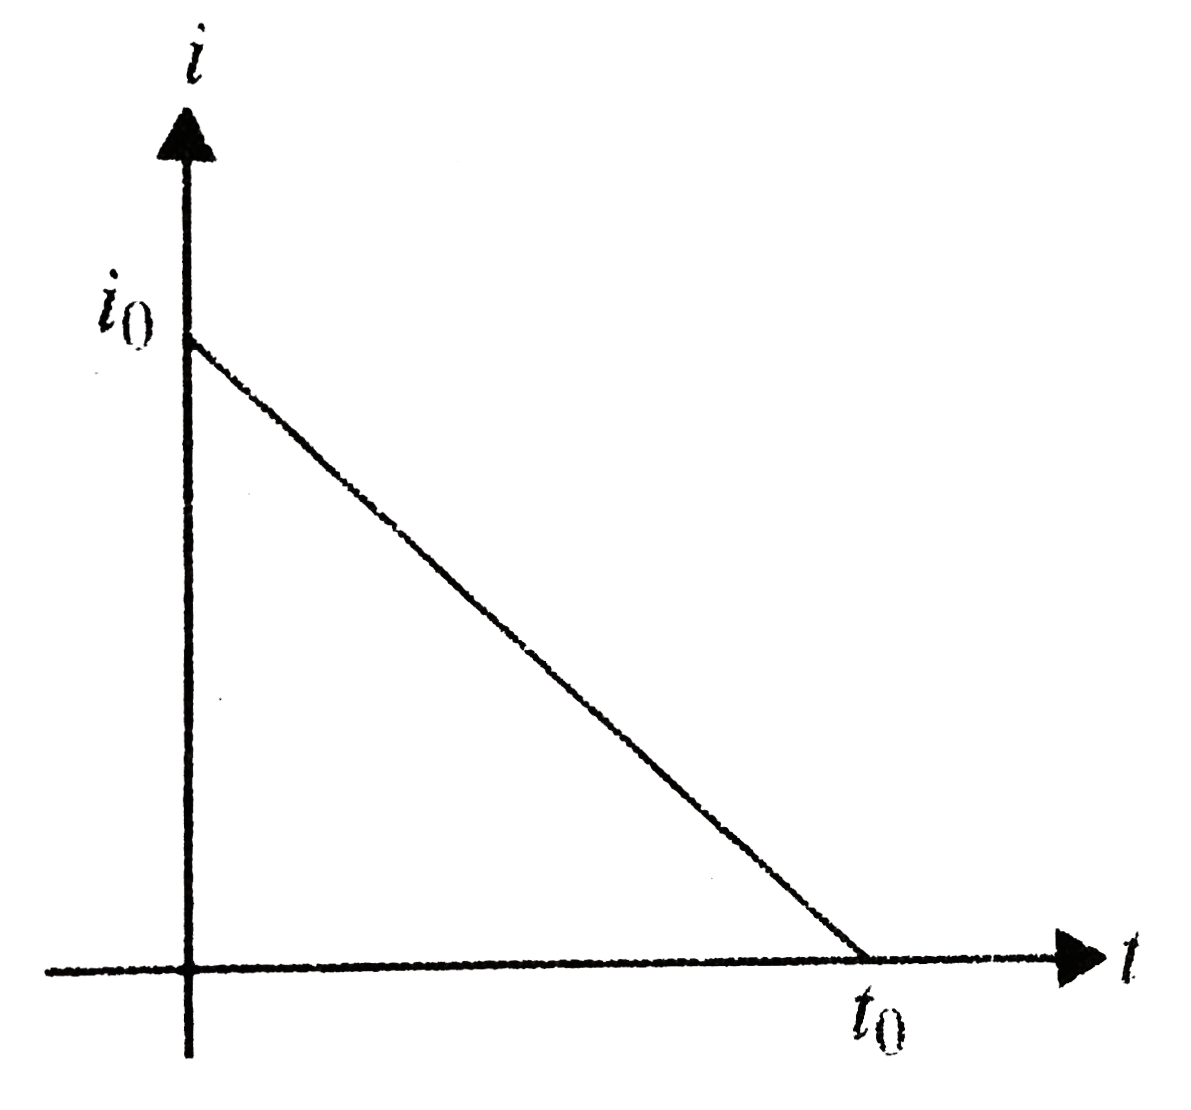
Total charge flowing through the conductor isView Solution

_PHY_E01_0010_Q01.png)