The current-voltage graph of a device is shown in figure. The resistance is negative in region.
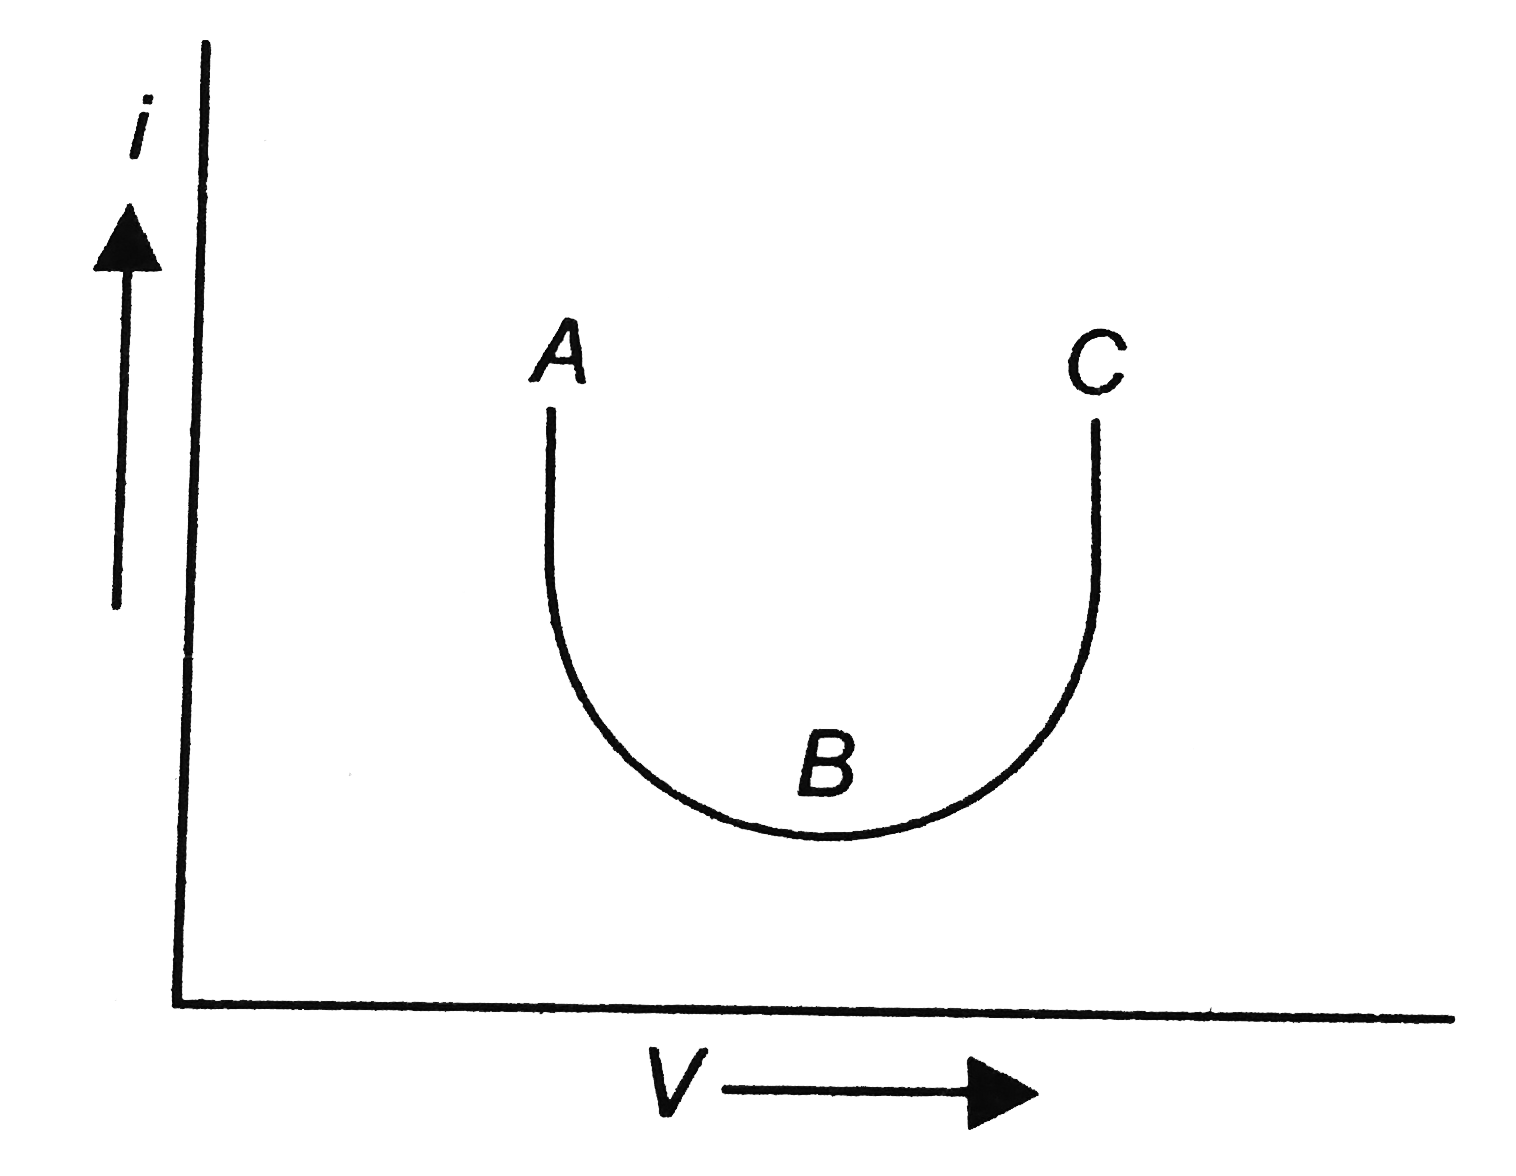
AB
BC
ABC
None of these
The correct Answer is:a
R=ΔVΔi is negative, when current decreases with increase of potential difference. This is exhibited by part AB.
Topper's Solved these Questions
- BOOK - A2ZCHAPTER - MOCK TESTEXERCISE - Mock Test 245videos
MOCK TEST
- BOOK - A2ZCHAPTER - MOCK TESTEXERCISE - Mock Test 344videos
MOCK TEST
- BOOK - A2ZCHAPTER - MAGNETISM AND MATTEREXERCISE - Section D - Chapter End Test30videos
MAGNETISM AND MATTER
- BOOK - A2ZCHAPTER - NUCLEAR PHYSICSEXERCISE - Section D - Chapter End Test29videos
NUCLEAR PHYSICS
Similar Questions
Knowledge Check
- Question 1 - Select One
The vector diagram of the current and voltage in a given circuit is shown in the figure. The components of the circuit will be -
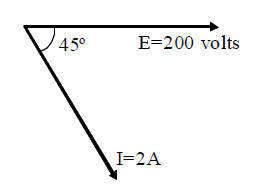 AL-C-RBL-RCL-C-R or L-RDC-R
 - Question 2 - Select One
Variation of current and voltage in a conductor has been shown in the diagram below. The resistance of the conductor is.
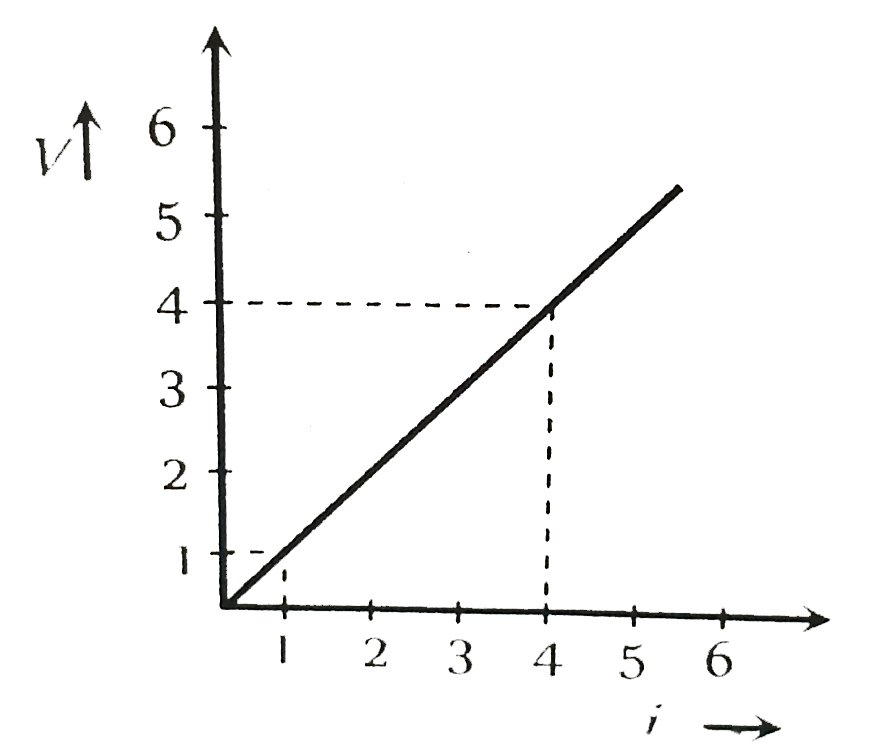 A4 ohmB2 ohmC3 ohmD1 ohm
 - Question 3 - Select One
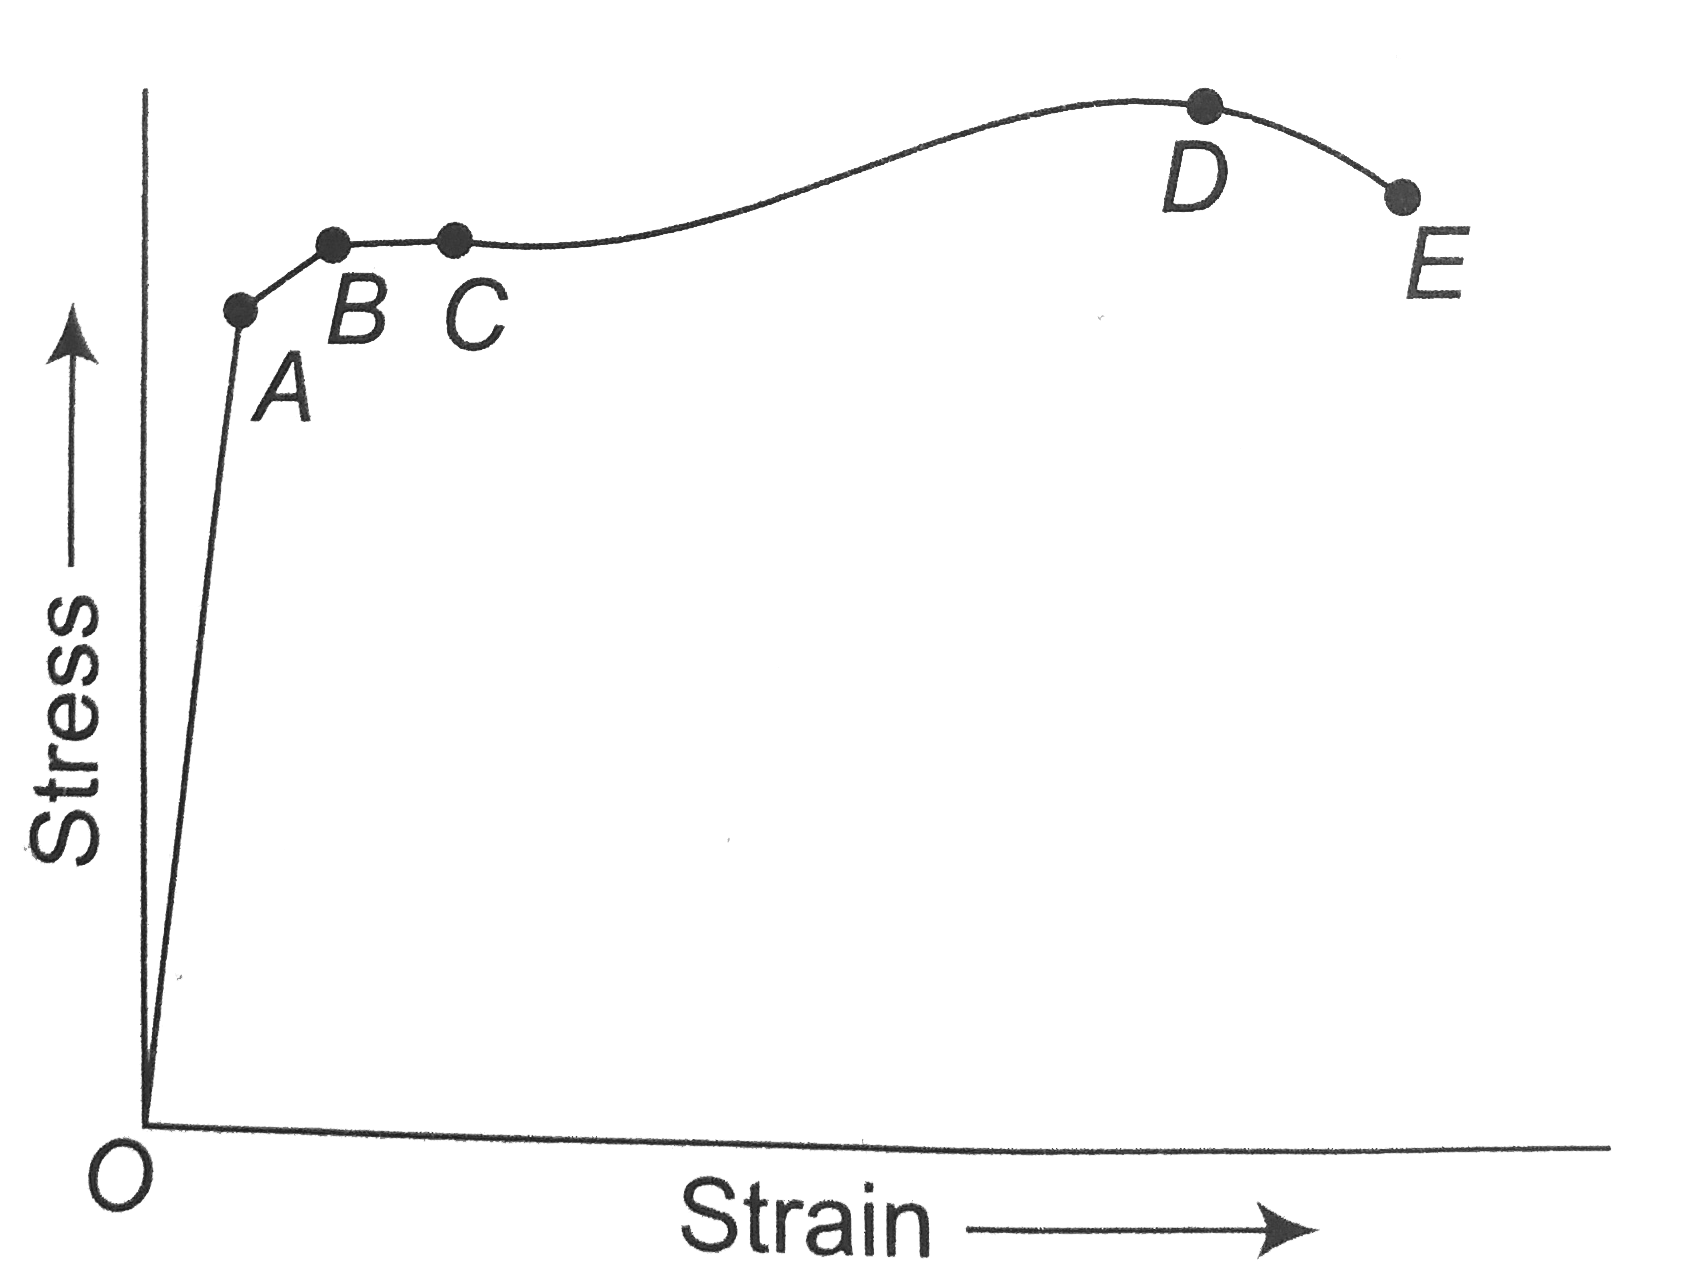
The stress strain graph for a metal wire is as shown in the figure. In the graph, the region in which Hooke's law is obeyed, the ultimate strength and fracture are represented byAOA,C,DBOB,D,ECOA,D,EDOB,C,D
Variation of current and voltage in a conductor is shown in the adjoining figure. The resistance of the conductor is
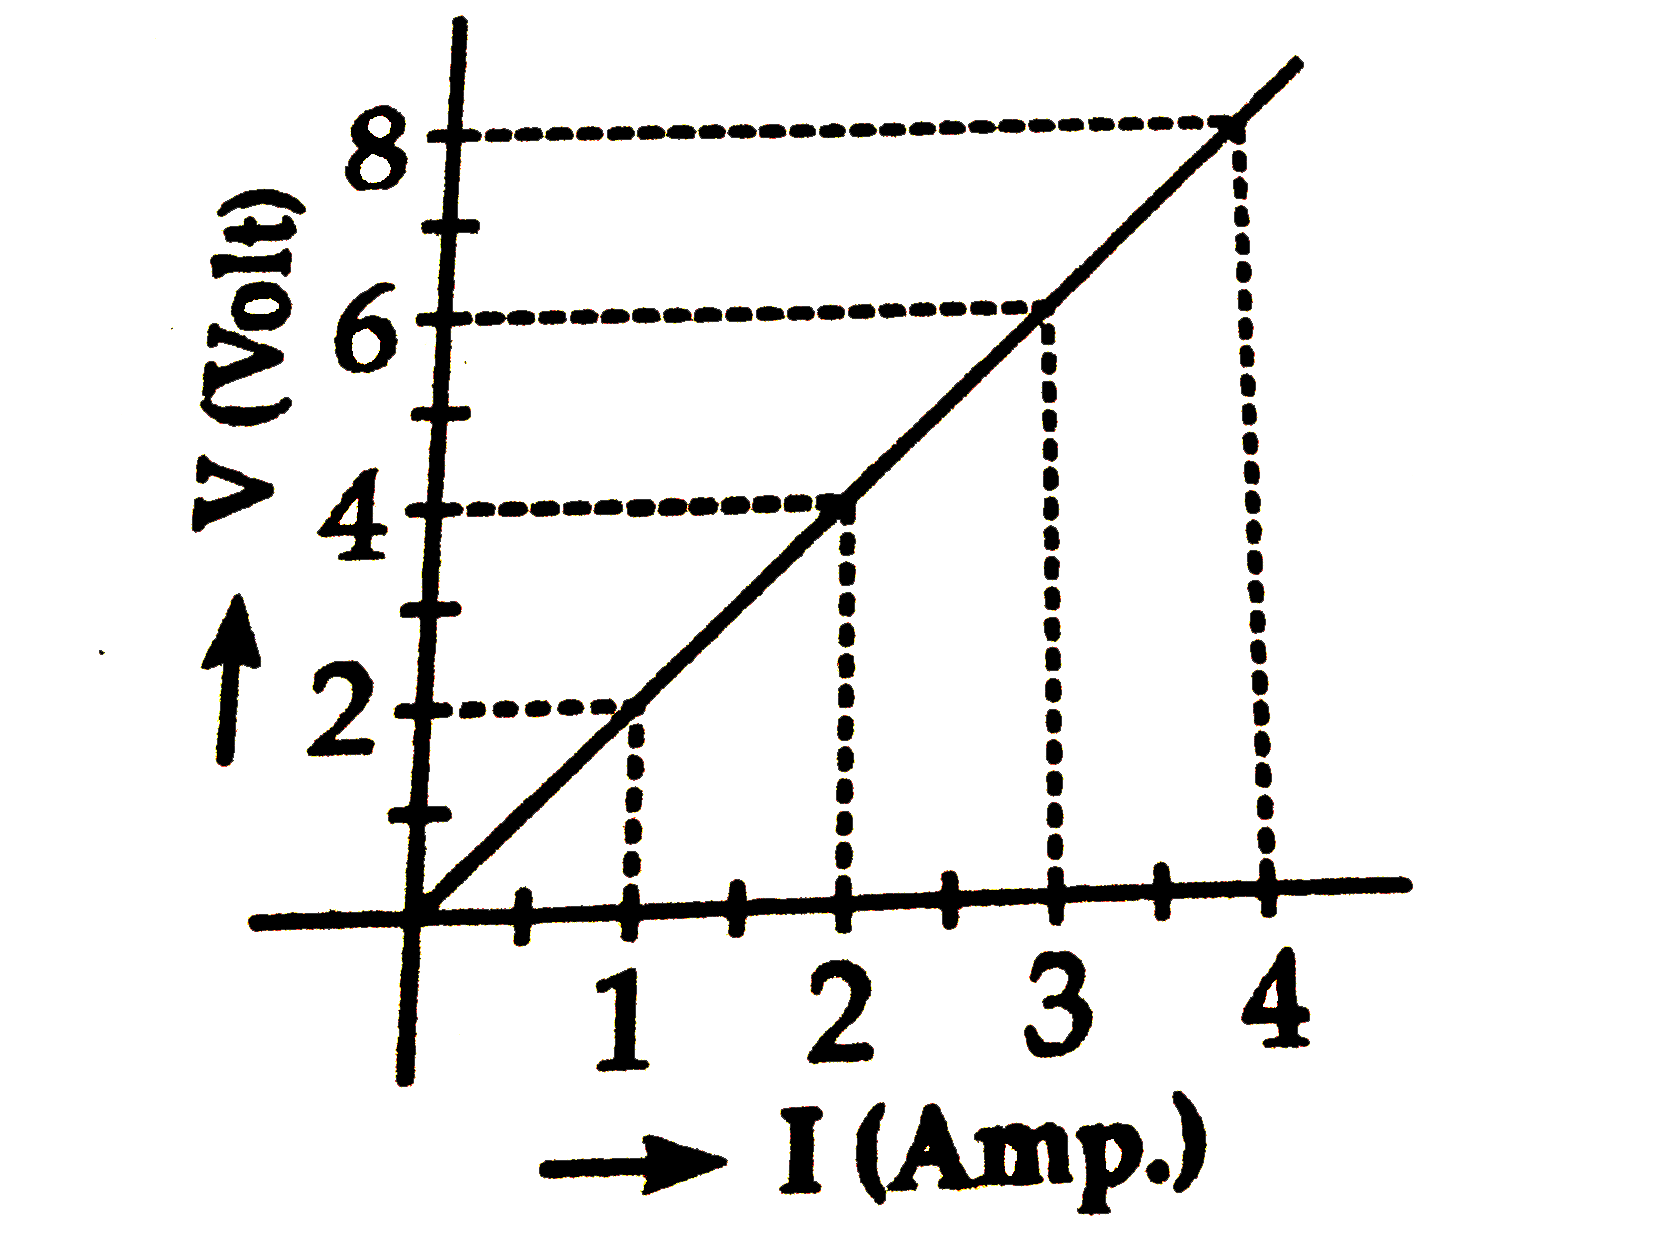 View Solution
The displacement time graph is shown in figure. The instantaneous velociyt is negative at the point.
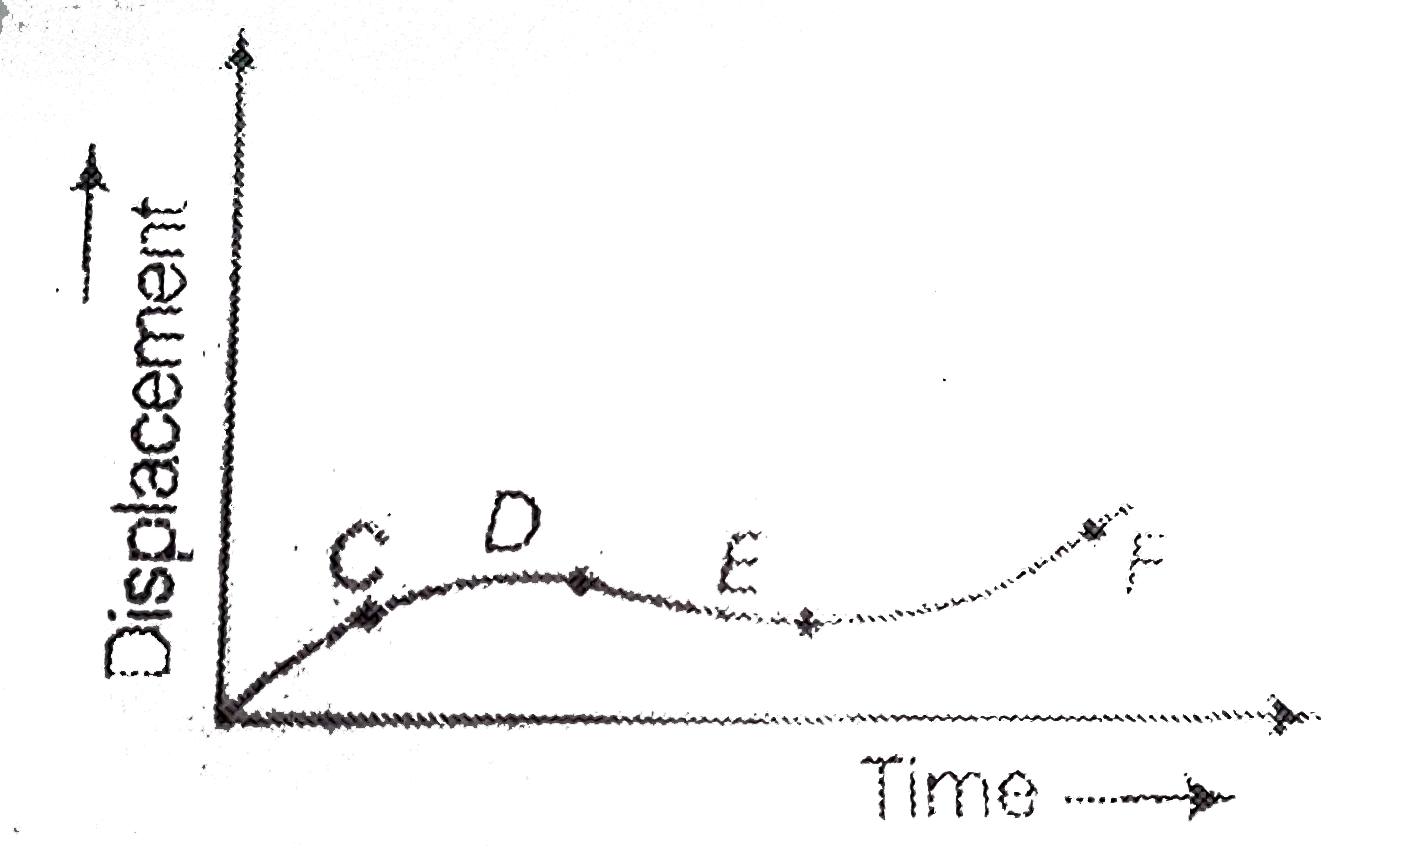 View Solution
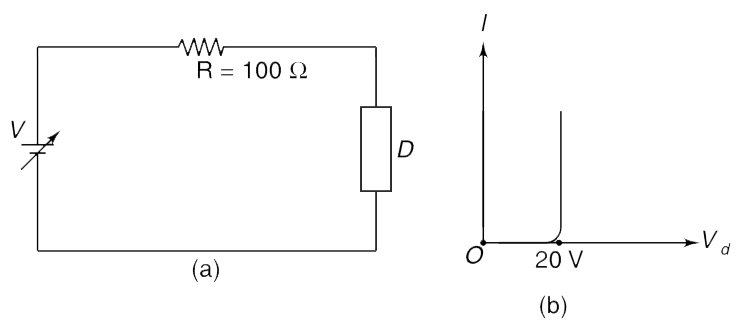
The current – voltage characteristic of an electric device is as shown in figure (b). The device gets damaged if power dissipated in it exceeds 1 Watt. This device is connected to a dc source of variable emf (V) and a resistance (R=100Ω) in series. What is possible range of V for which the device remains operational (i.e. consumes some power) and safe.
 View Solution
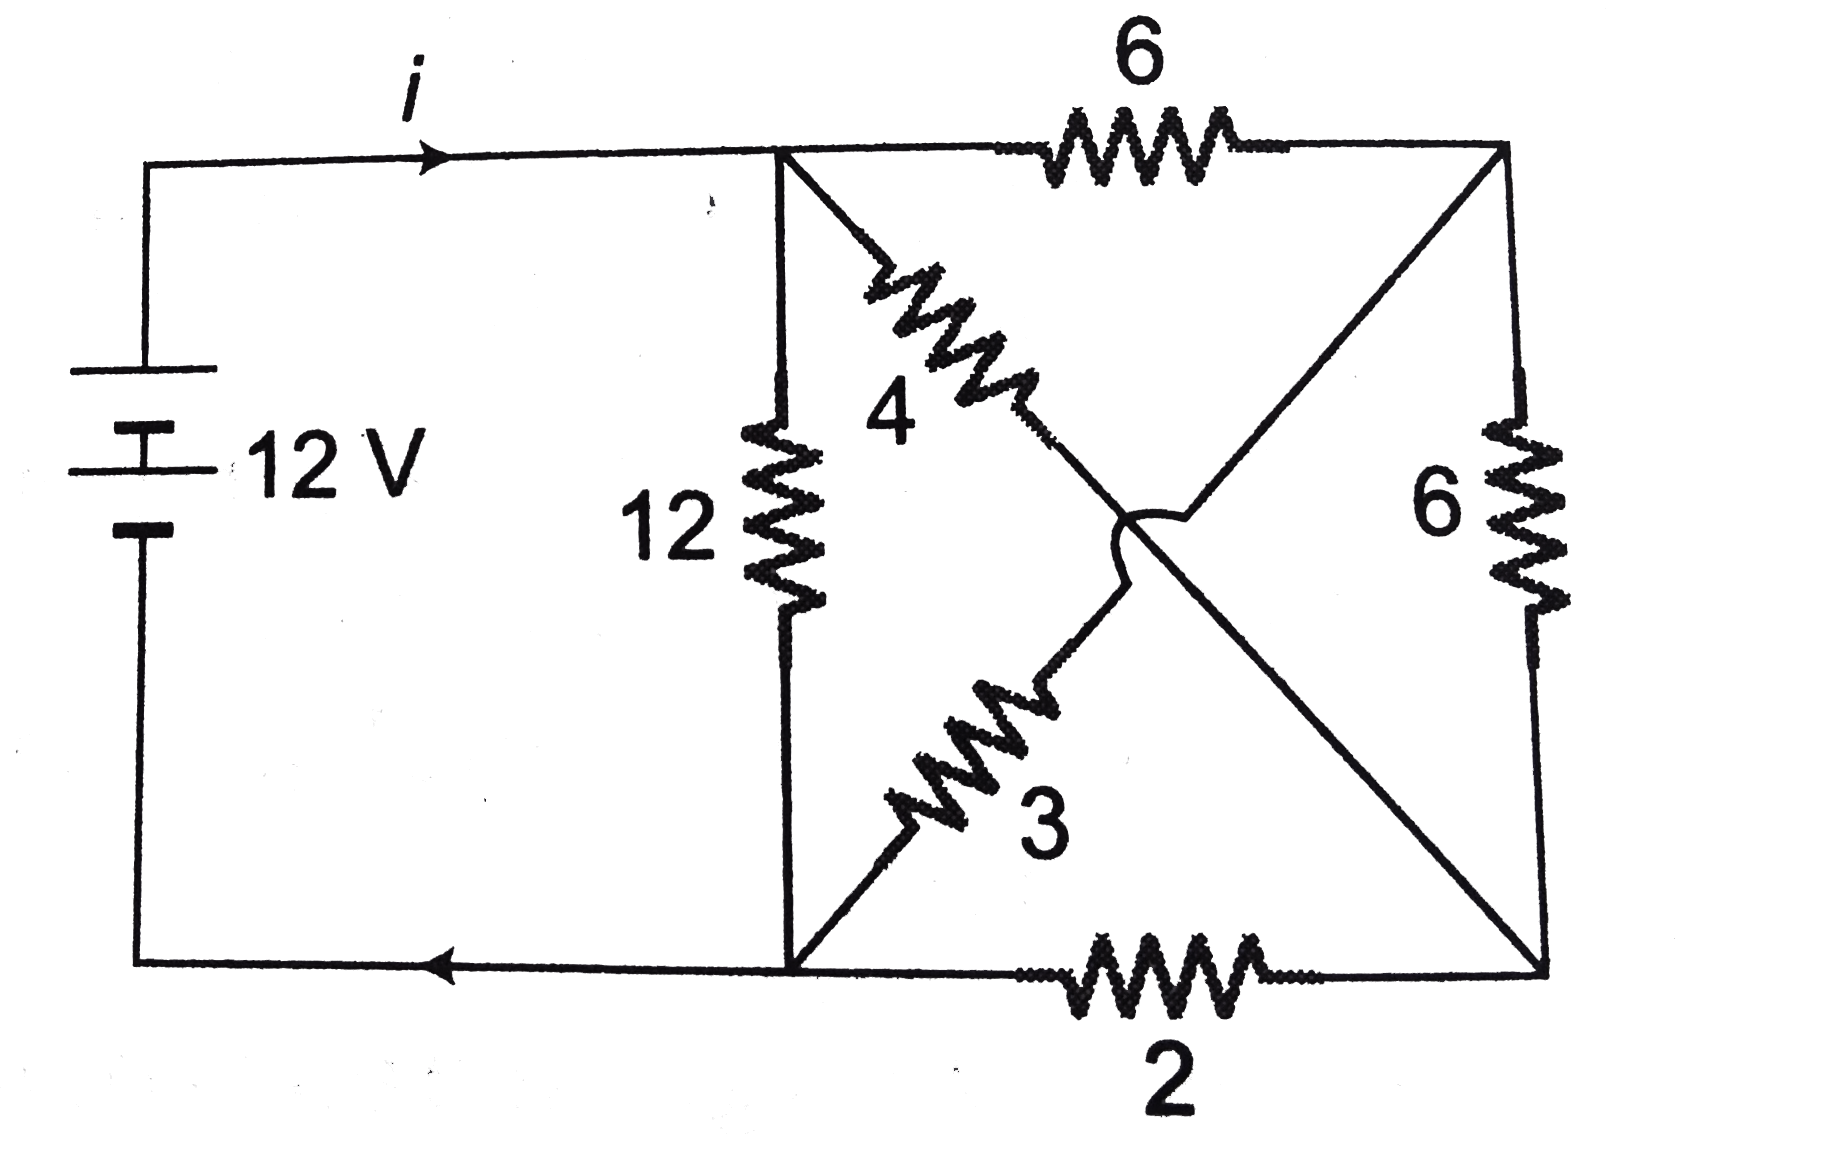
Compute the value of battery current in shown in figure. All resistance are in ohm.
 View Solution
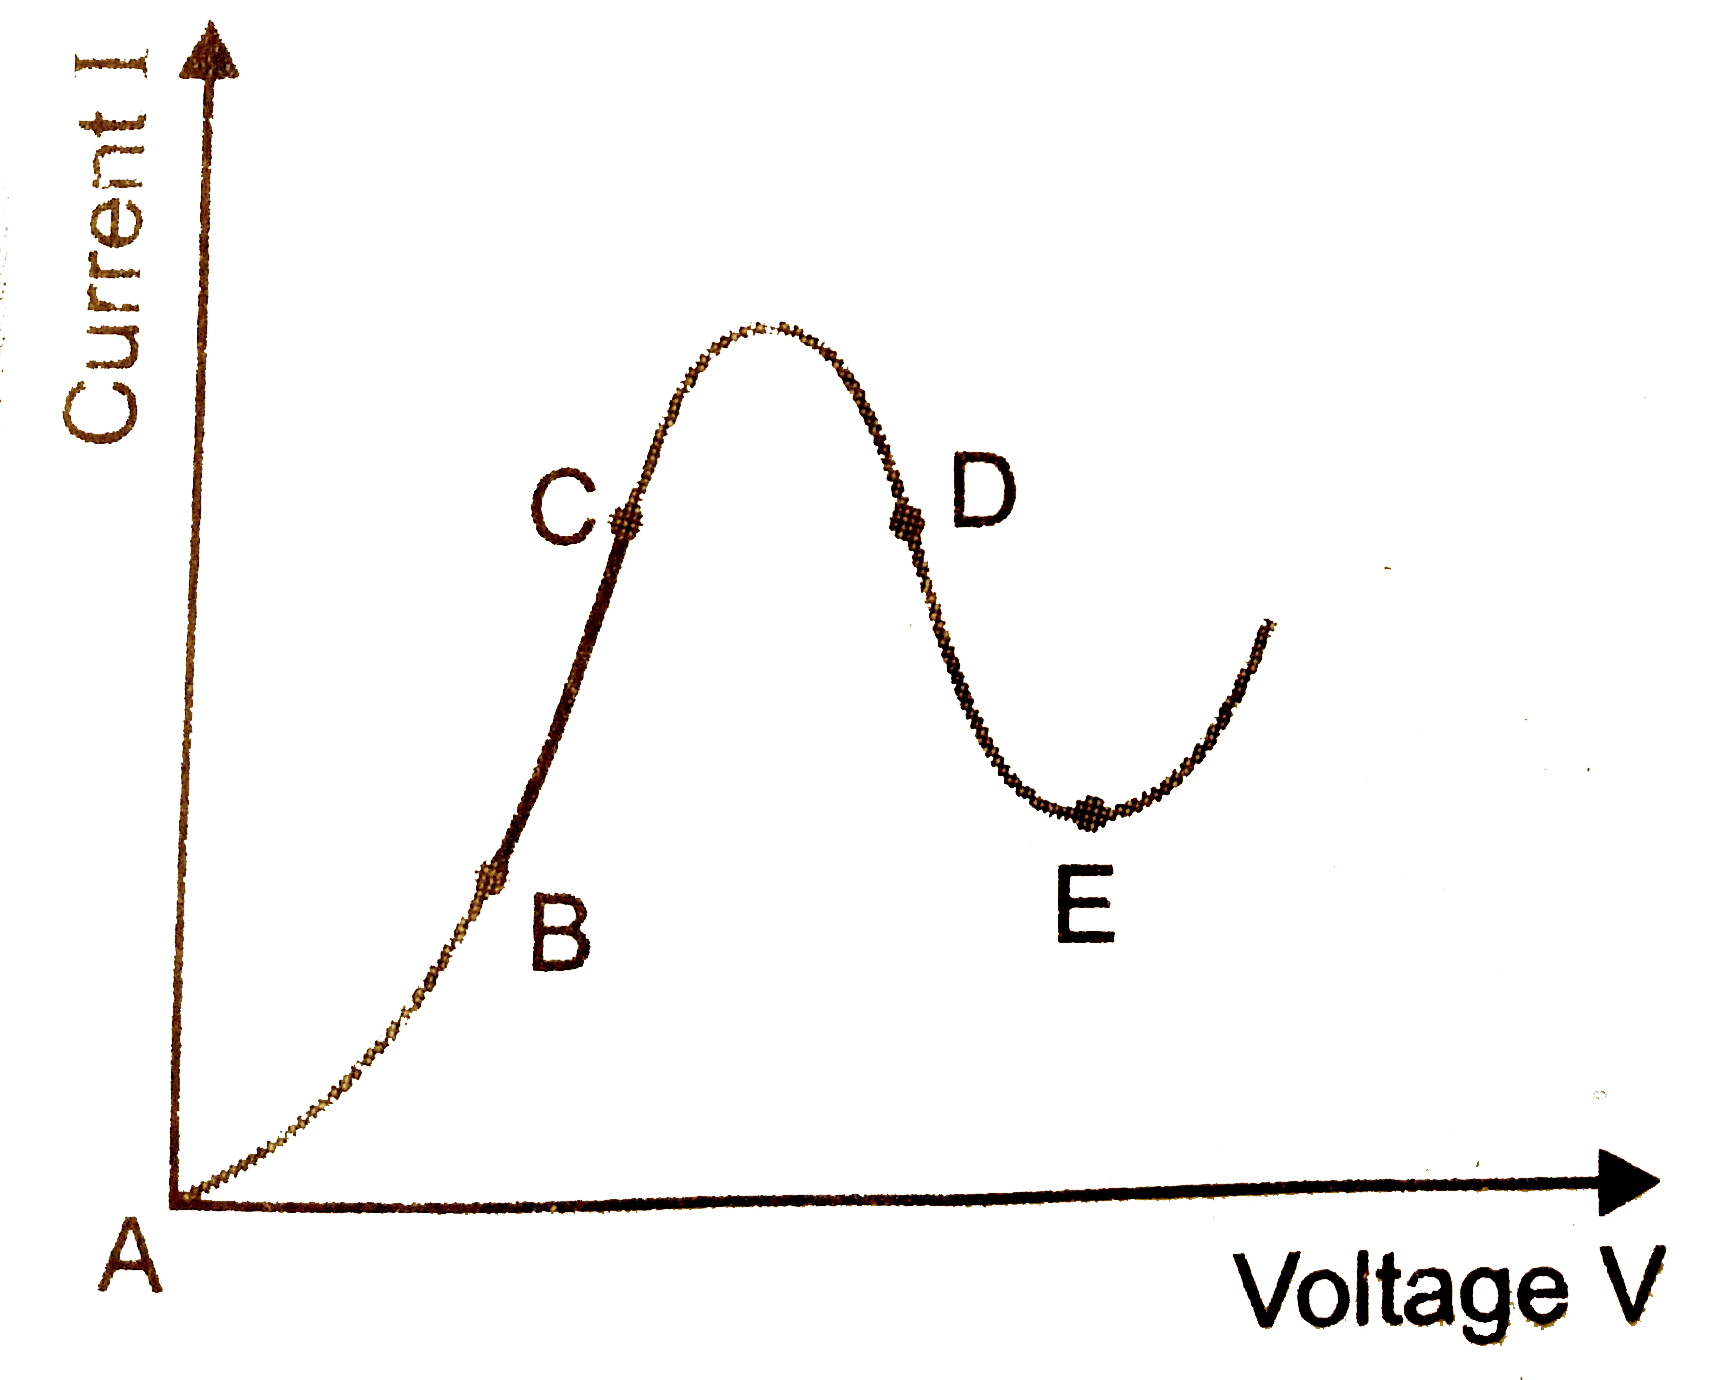
Graph showing the variation of current versus voltage for a material GaAs is shown in figure. Identify the region of (i) negative resistance (ii) where Ohm's law is obeyed.
 View Solution


