Explain the given graph :
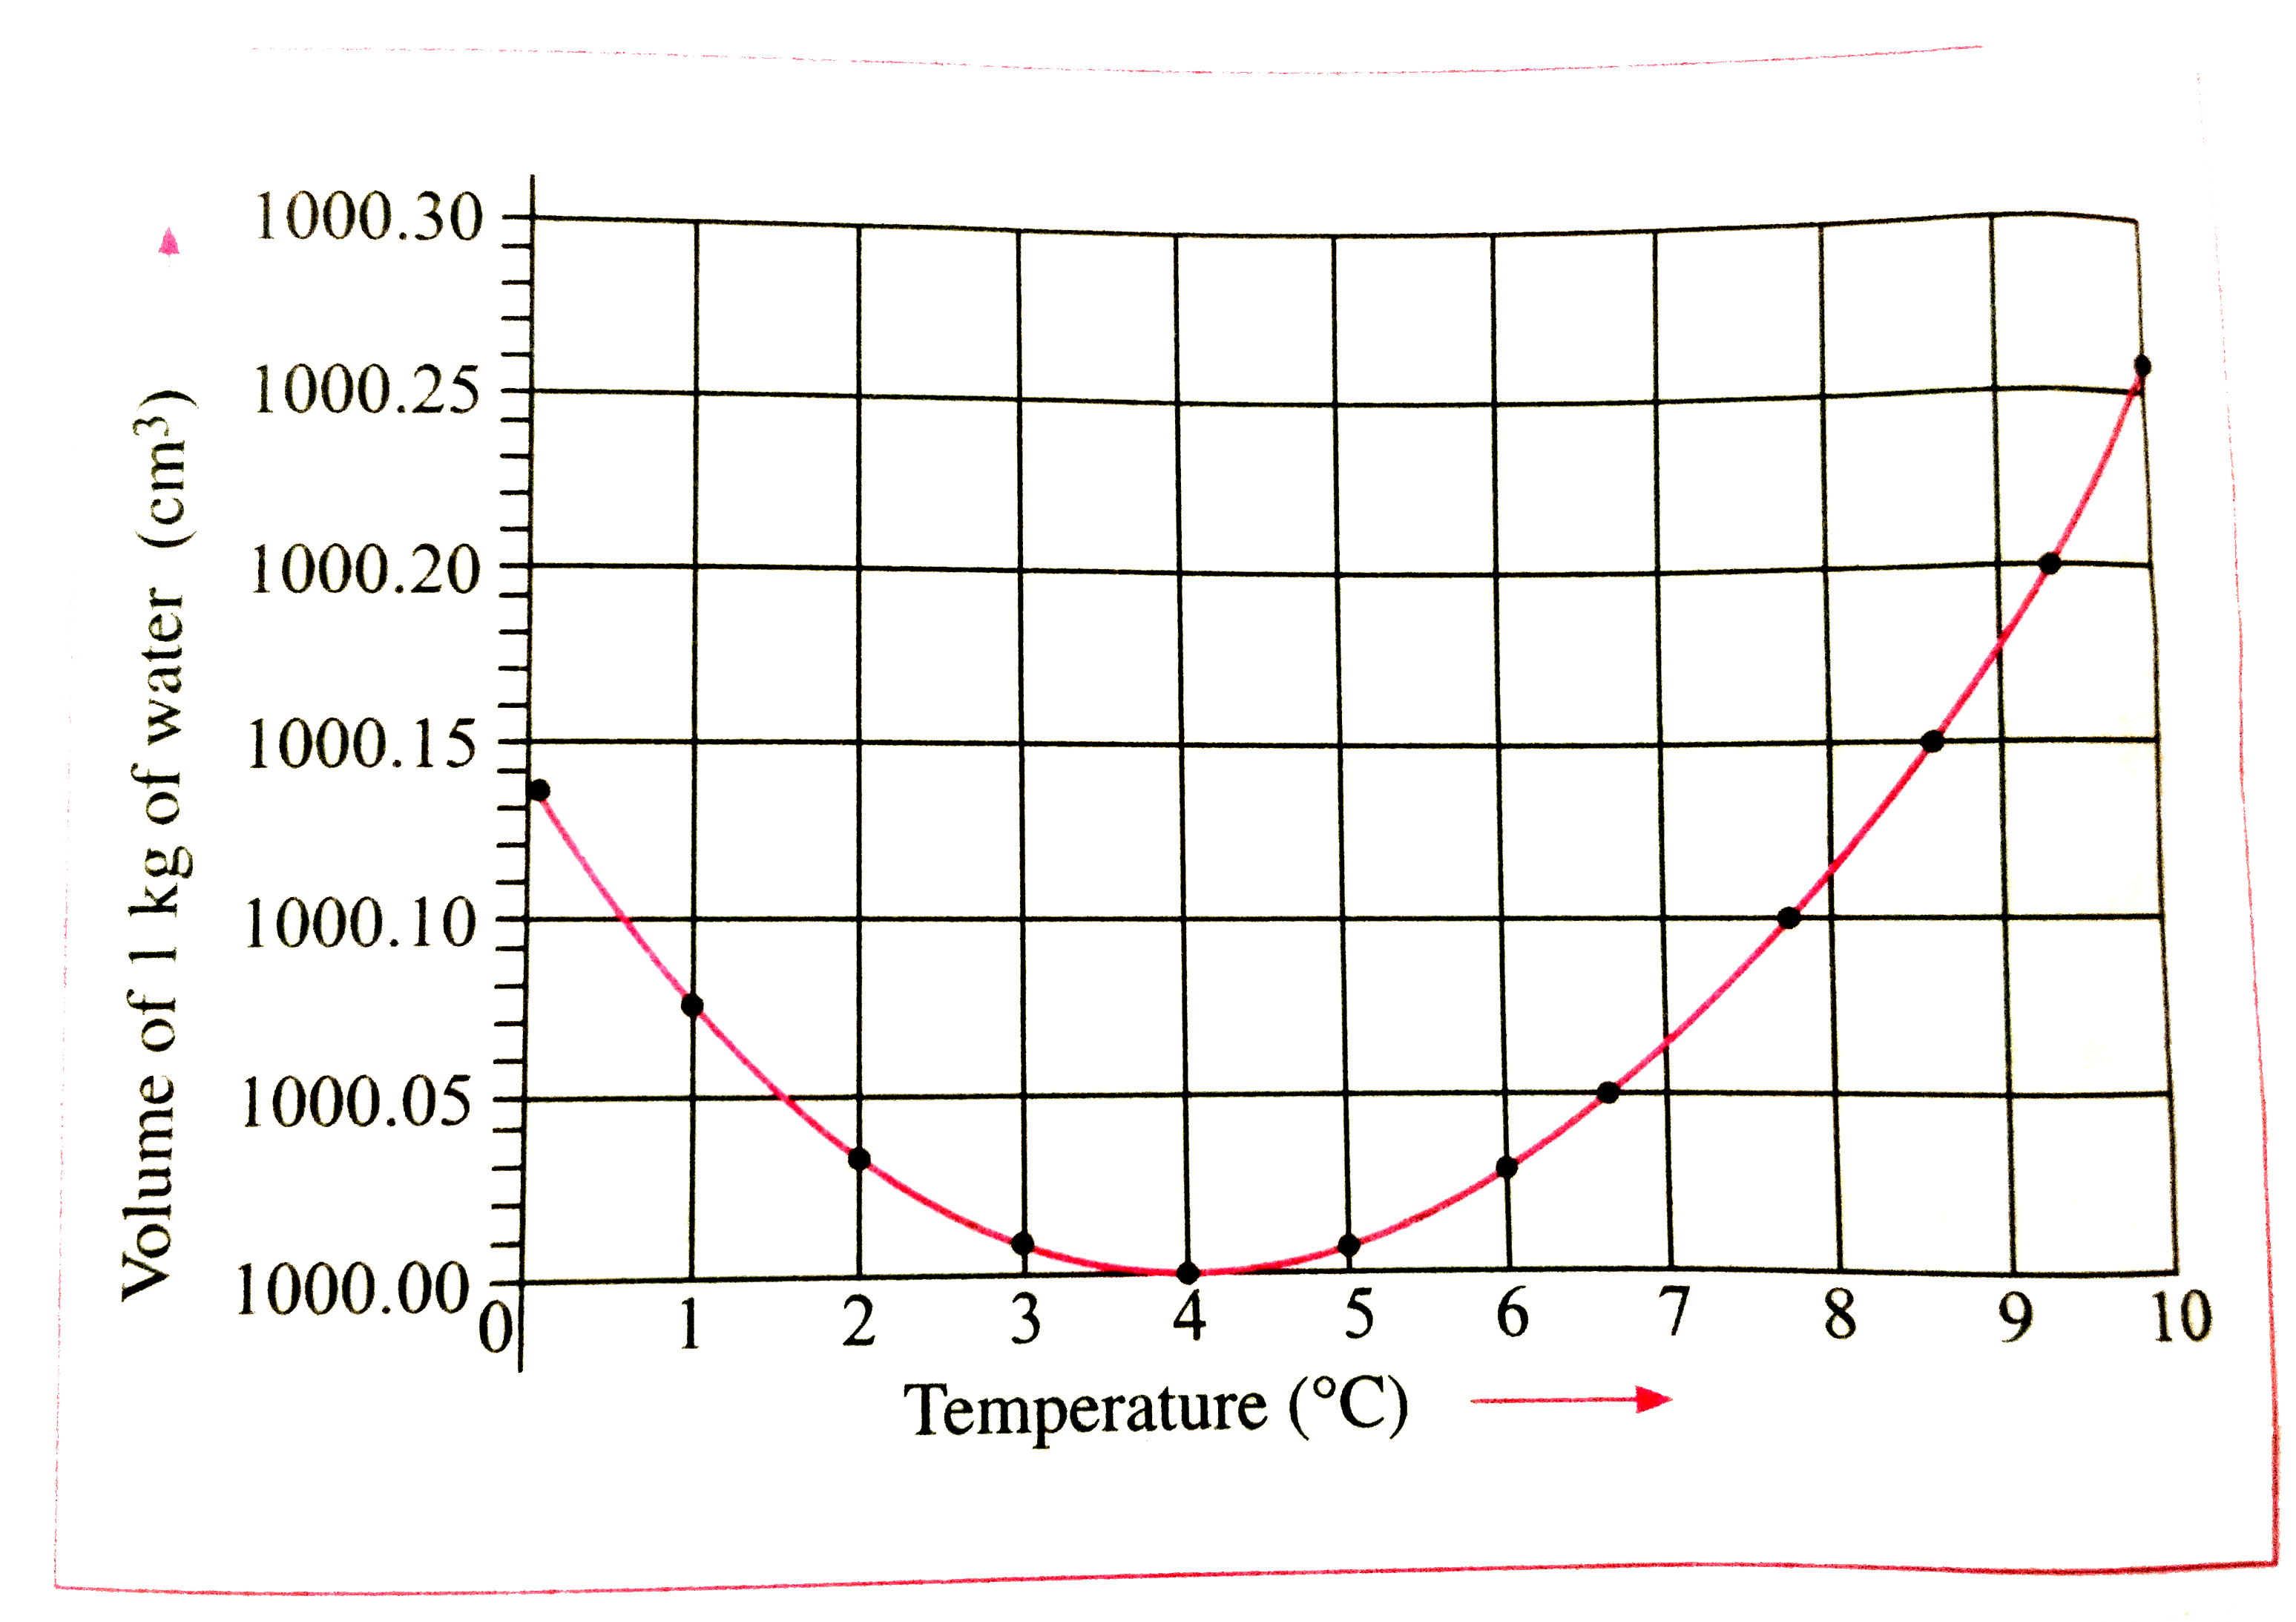
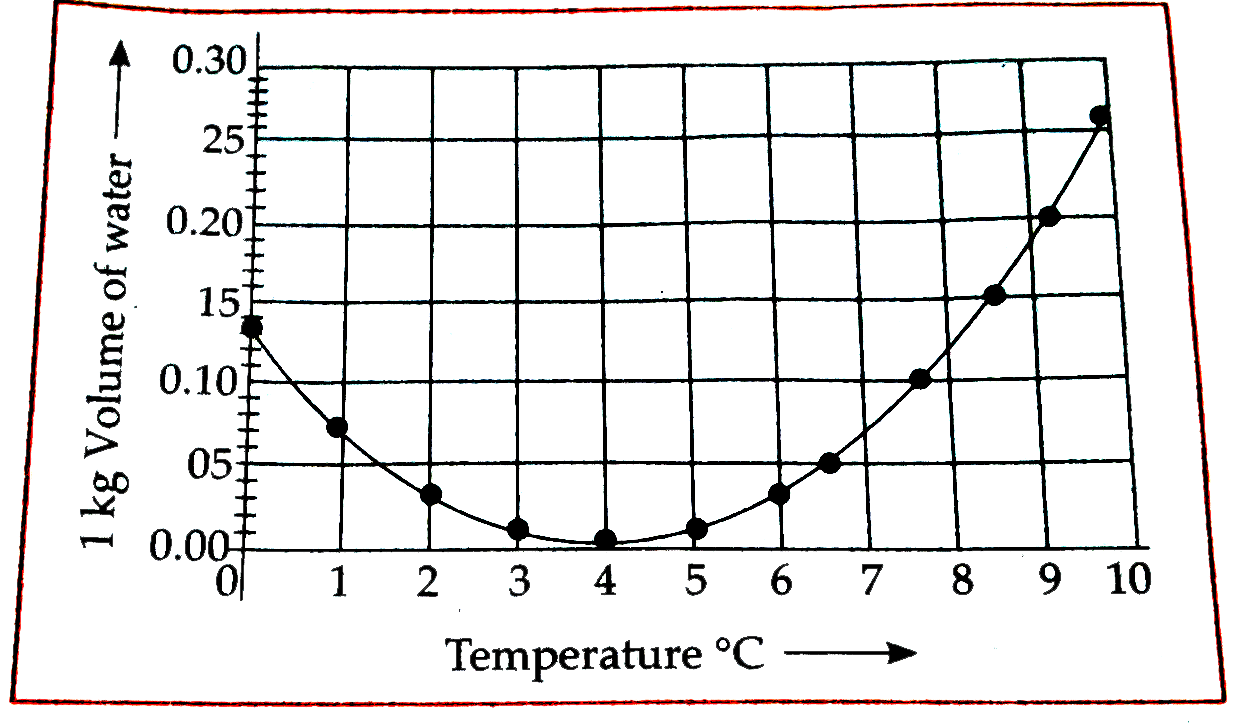
Observe the graph below . Temperature of water is raised from 0∘C , observe the change in volume at different temperatures and explain the behavior of water .
 Solution in Tamil
(i) AS water at 0∘C is heated upto 4∘C it contracts instaead of expanding . The volume of water at 4∘C is minimum . If water at 4∘C is further heaed then it expands and its volume increases.
(iii) This expectional behaviour which water shows between 0∘C to 4∘C it contracts instead of expanding . since volume at 4∘C is minimum, hence , density is maximum.
Topper's Solved these Questions
- HEATBOOK - CHETAN PUBLICATIONCHAPTER - HEATEXERCISE - Open Ended Question:
3 Videos
- HEATBOOK - CHETAN PUBLICATIONCHAPTER - HEATEXERCISE - Darw a neat and labelled diagram.
4 Videos
- HEATBOOK - CHETAN PUBLICATIONCHAPTER - HEATEXERCISE - Give Scientific Reasons:
6 Videos
- GRAVITATIONBOOK - CHETAN PUBLICATIONCHAPTER - GRAVITATIONEXERCISE - ASSIGNMENT-1
15 Videos
- LENSESBOOK - CHETAN PUBLICATIONCHAPTER - LENSESEXERCISE - Assignment
14 Videos
Similar Questions
While deciding the unit for heat , which temperature interval is chosen ? Why ?
View SolutionHope' s apparatus.
View SolutionTemperature of water at the surface of lake is – 20°C. Then temperature of water just below the lower surface of ice layer is
View SolutionThe value of g at the centre of the Earth is zero. Explain?
View SolutionThe defect of myopia can be corrected by using ___________ .
View SolutionA block of wood is floating in water at 0^@ C . The temperature of water is slowly raised from 0^@ C to 10^@ C . How will the precentage of volume of block above water level change with rise in temperature?
View SolutionA block of wood is floating on water at 0∘C with volume V0 above water. When the temperature of water increases from 0 to 10∘C, the change in the volume of the block That is above water is best described schematically by the graph
View SolutionA block of wood is floating on water at 0∘C with a certain volume V outside the water-level. The temperature of water is slowly raised from 0∘C to 20∘C . How will the volume V change with rise in temperature ?
View SolutionObserve the following graph. Considering the change in volume of water as its temperature is raised from 0∘C , discuss the difference in the behaviour of water and other substances. What is this behaviour of water called ?

View SolutionObseve the following graph. Considering the change in volume of water as it temperature is raised form 0∘C , dicuss the difference in the behaviour of water and other substance. What is this behaviour of water called ?

View SolutionWhat could be explained from the straight horizontal line observed at the beginning and end of the temperature v/s time graph of water when heated continuously and uniformly?
View SolutionExplain the variation of temperature with heat for water at 1 atm with a graph.
View SolutionA graph is plotted between pressure and volume at different temperature. On the basis of the graph what changes will you observe in the volume if (i) the pressure is increased at constant temperature (ii) the temperature is decreased at constant pressure
View SolutionExplain the variation of temperature with heat for water at 1 atm with a graph.
View SolutionA block of wood is floating on water at 0∘C, with a certain volume V above water level. The temperature of water is slowly raised from 0∘C. How will the volume V change with the rise of temperature?
View Solution
