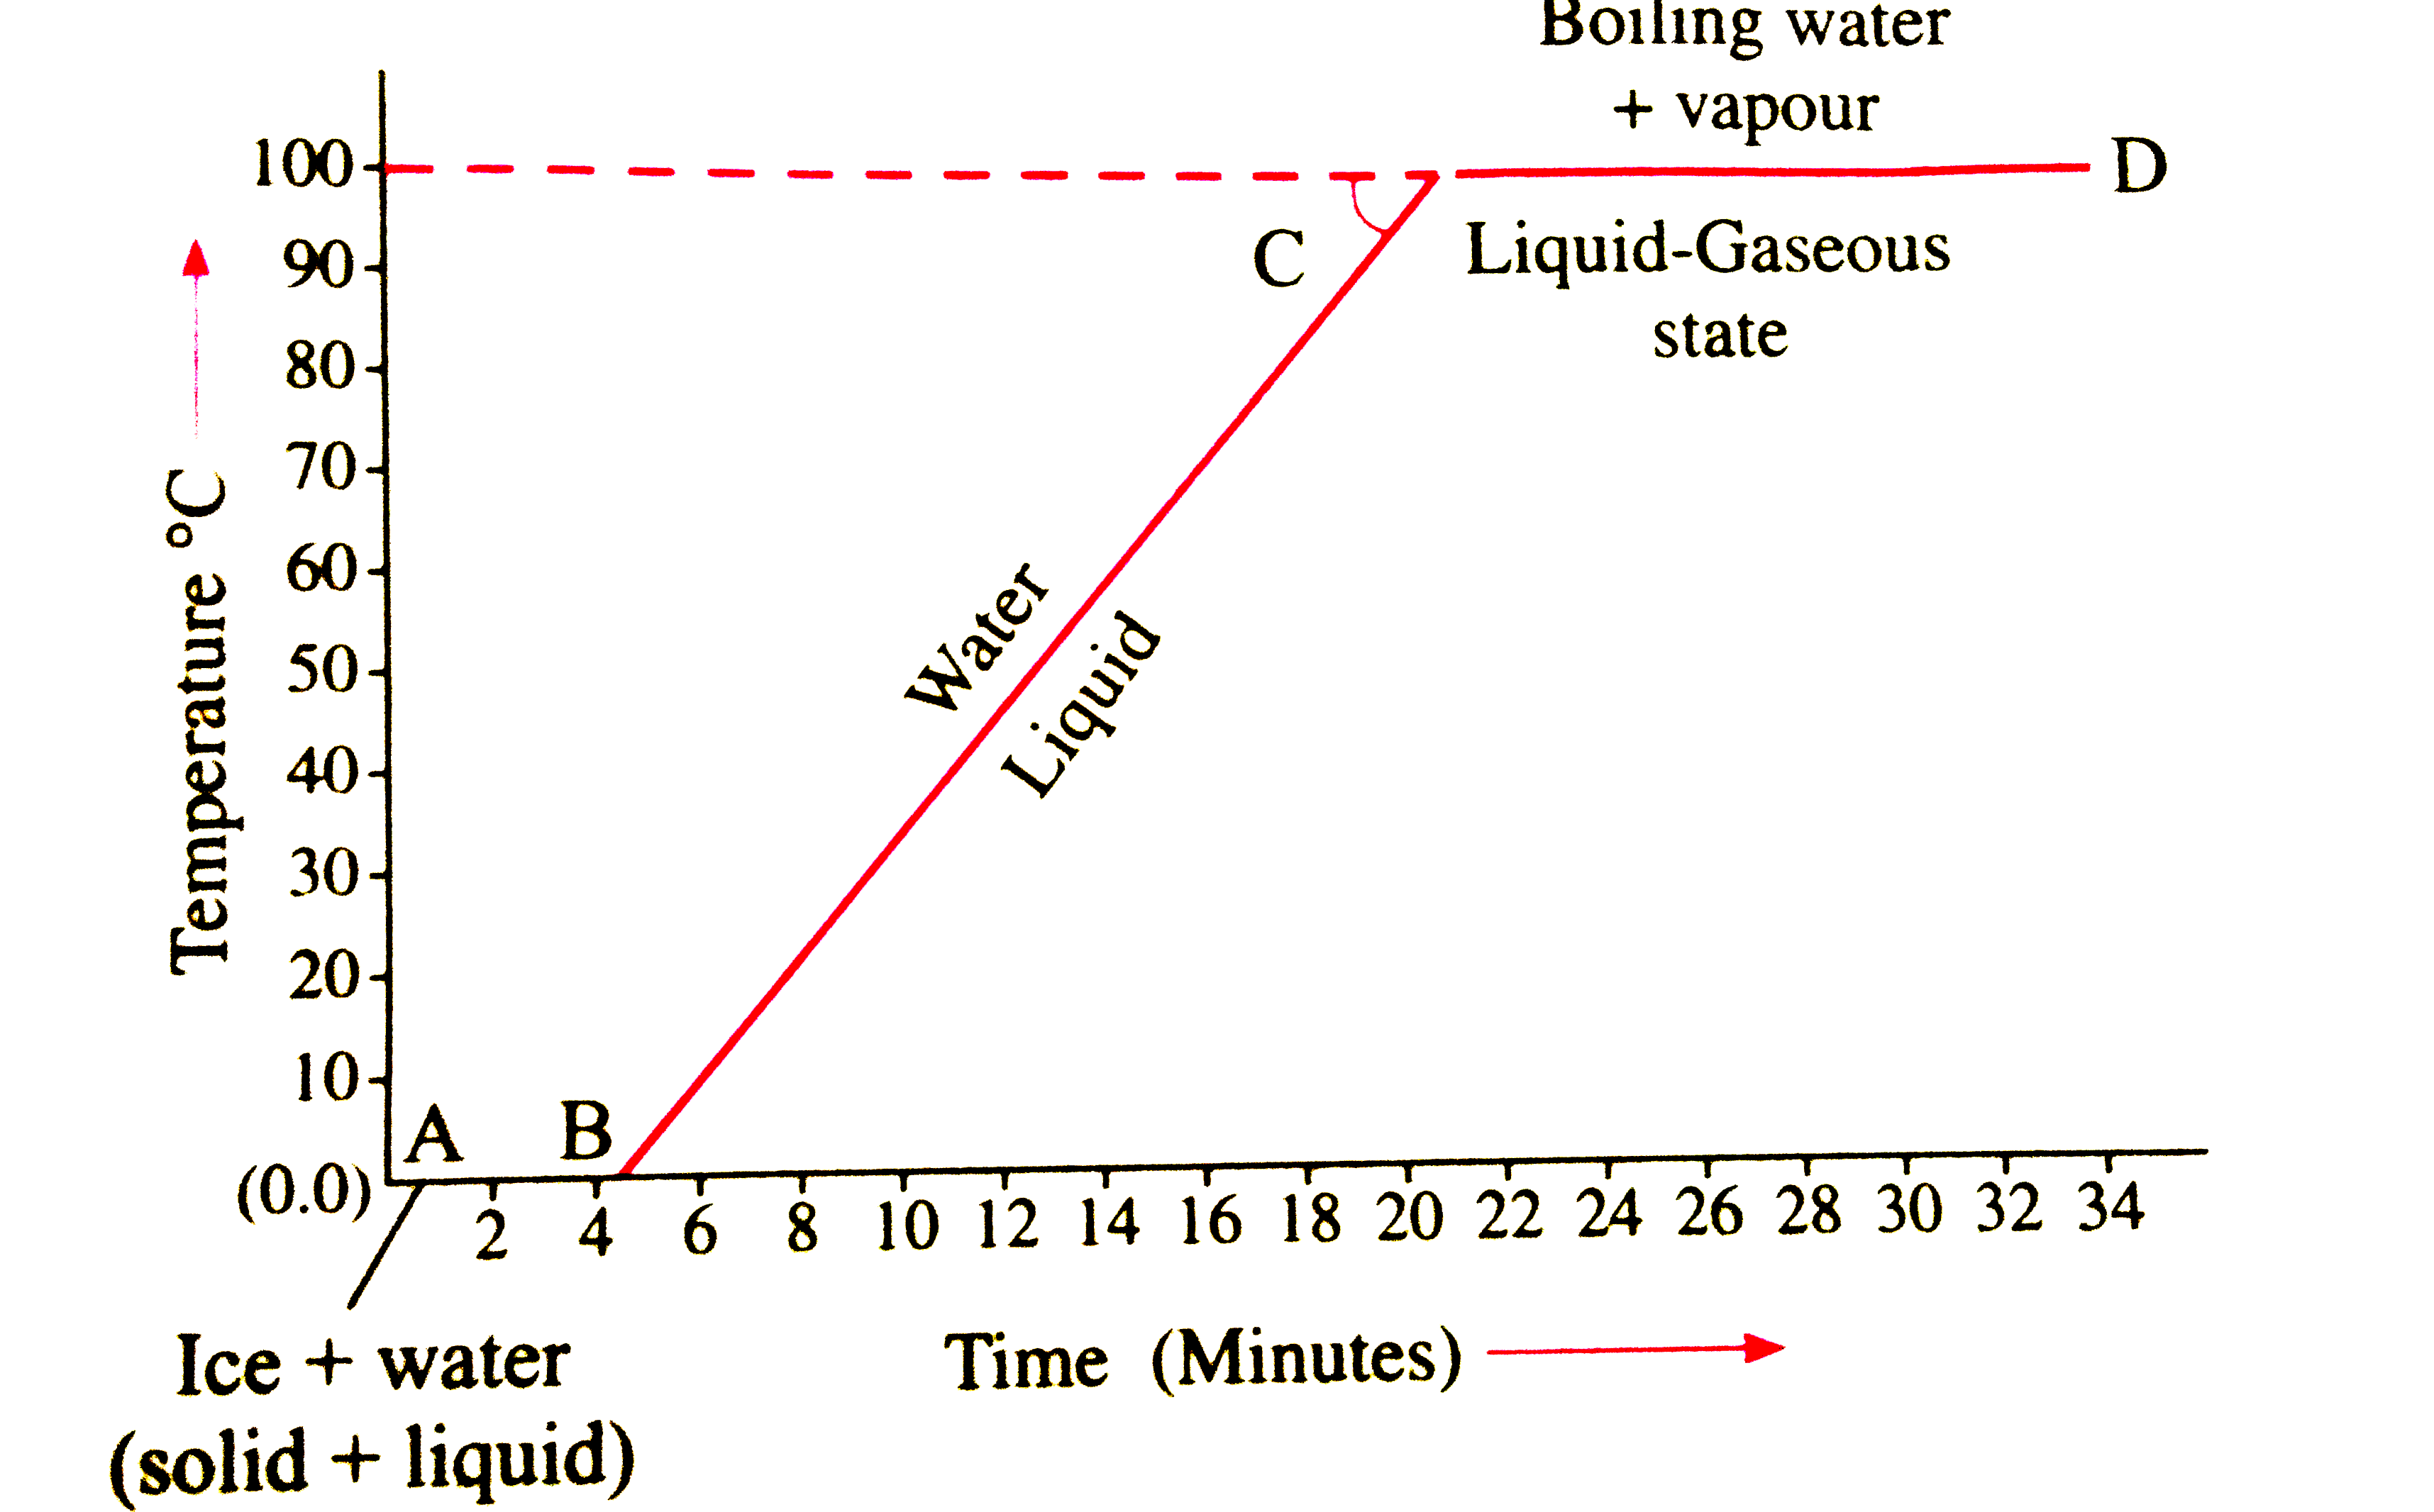
Explain the following graph:

Text Solution
(i) The graph shown in the temperature - time graph of Ice transforming into water and steam.
(ii) AB shows that , at constant temperature of 0∘C ice changes to water .
(iii) The tempertaure at which ice changes to water, is called melting point of ice i.e., 0∘C .
(iv) Now, water at 0∘C starts heating and its temperature gradullay increases to 100∘C .
(V) BC, shows increase in temperture form 0∘C to 100∘C without a change is state .
(vi) CD shows that at constant temperature of 100∘C water changes to vapor .
(vii) The temperature at which water changes to vapour is called boling point of water i.e., 100∘C.
|
Topper's Solved these Questions
- HEATBOOK - CHETAN PUBLICATIONCHAPTER - HEATEXERCISE - Open Ended Question:
3 Videos
- HEATBOOK - CHETAN PUBLICATIONCHAPTER - HEATEXERCISE - Darw a neat and labelled diagram.
4 Videos
- HEATBOOK - CHETAN PUBLICATIONCHAPTER - HEATEXERCISE - Give Scientific Reasons:
6 Videos
- GRAVITATIONBOOK - CHETAN PUBLICATIONCHAPTER - GRAVITATIONEXERCISE - ASSIGNMENT-1
15 Videos
- LENSESBOOK - CHETAN PUBLICATIONCHAPTER - LENSESEXERCISE - Assignment
14 Videos
Similar Questions
Knowledge Check
Which among the following graphs explains the photoelectric effect?
A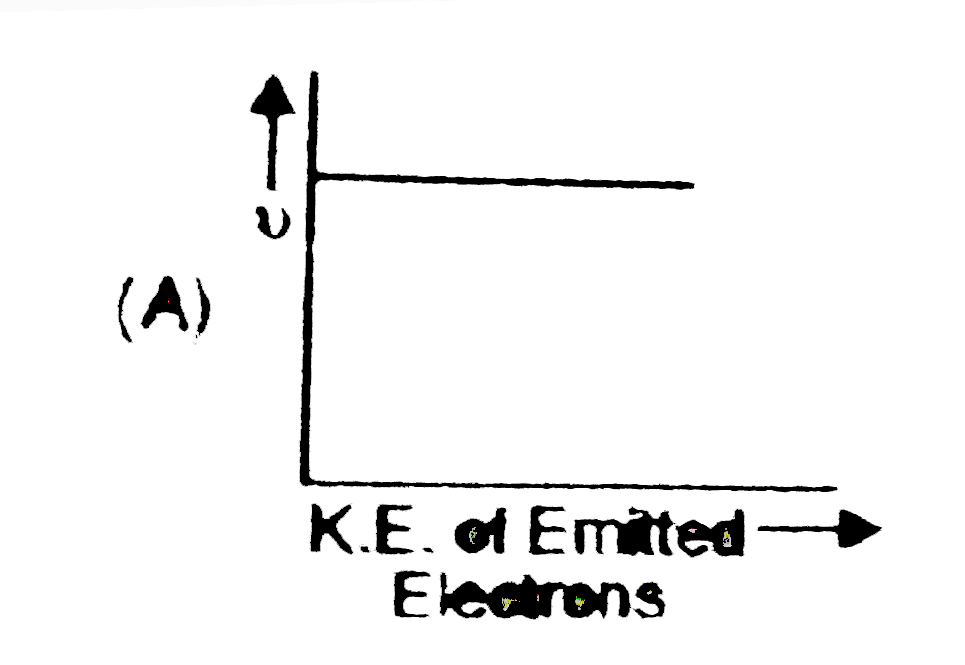 B
B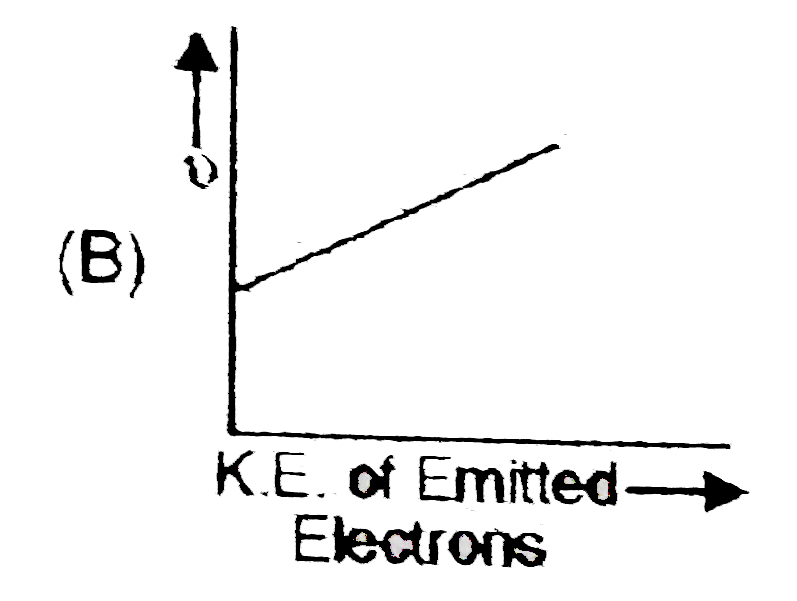 C
C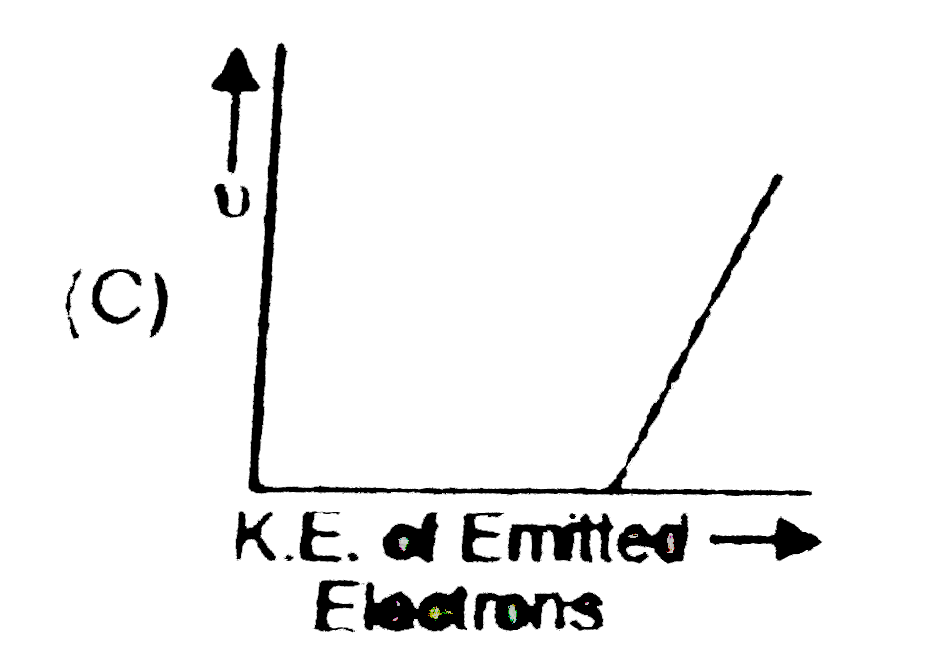 D
D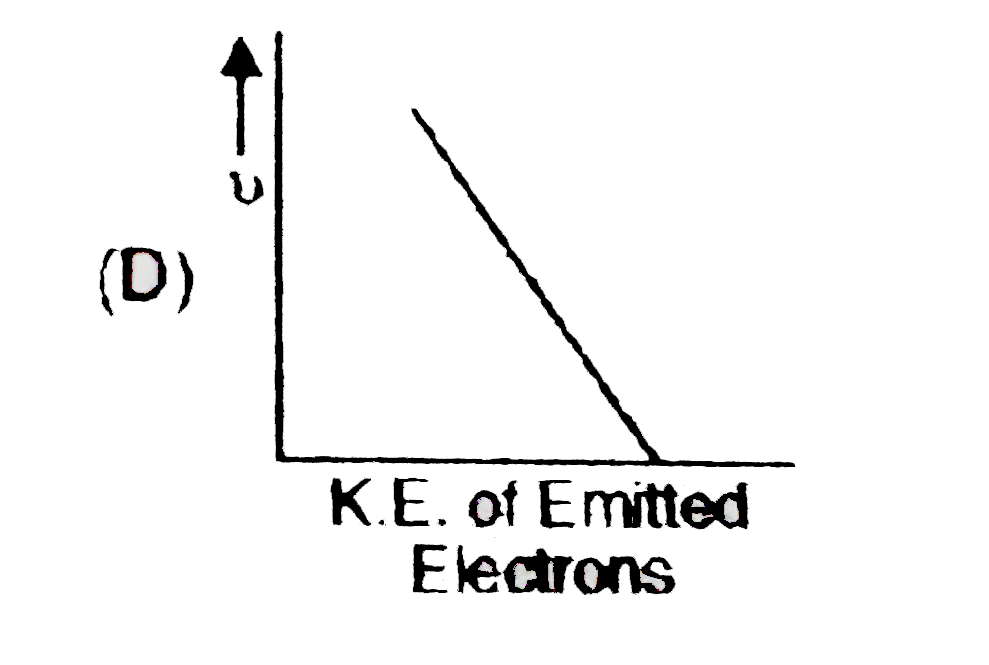
State whether the following graph can be seen in nature or not. Explain.
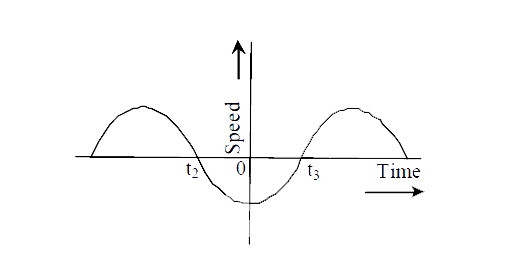 AYesBNoCSometimeDAt a perticular instant
Which of the following graphs are graphs of a function?
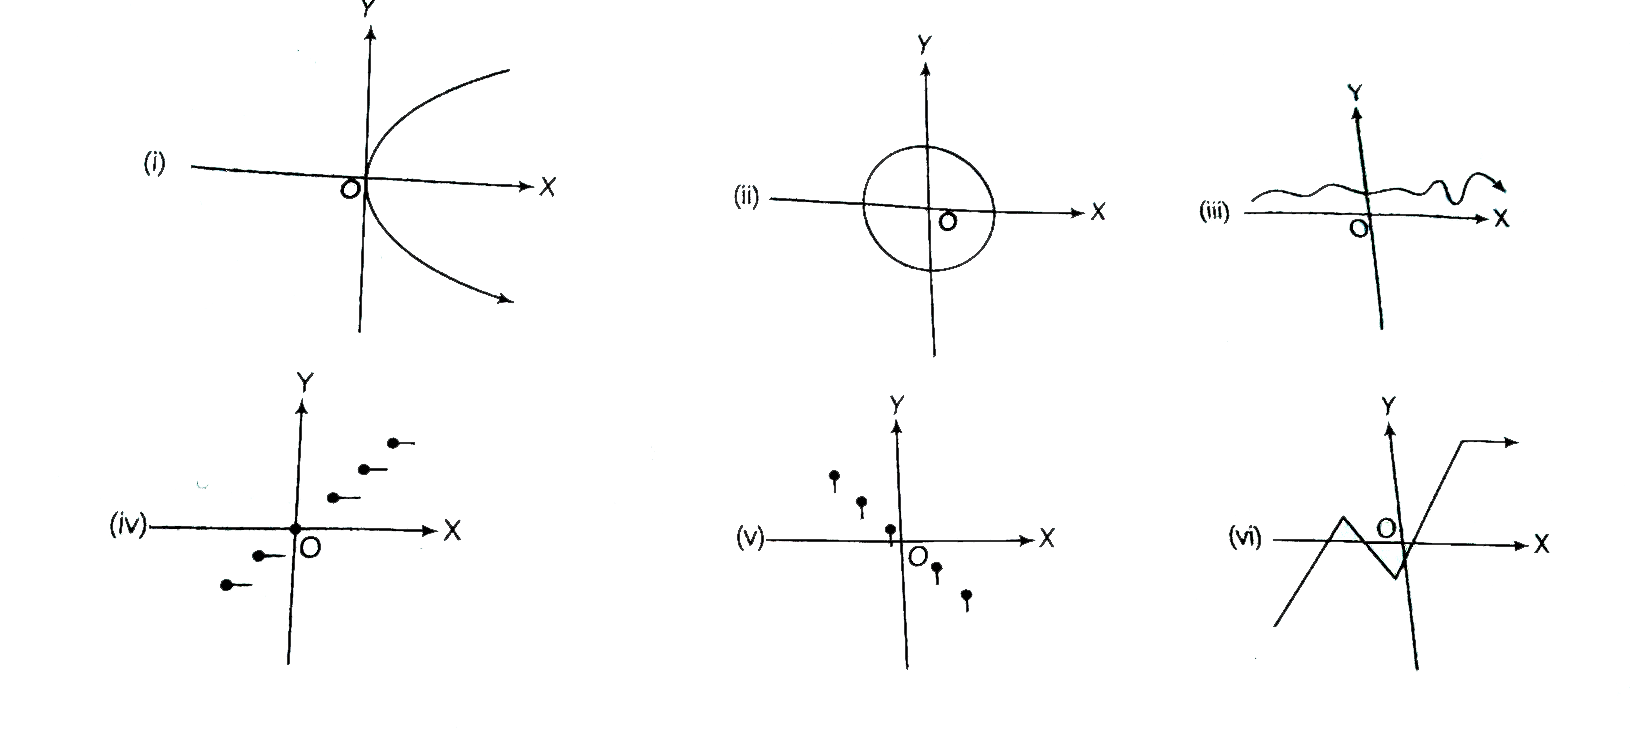
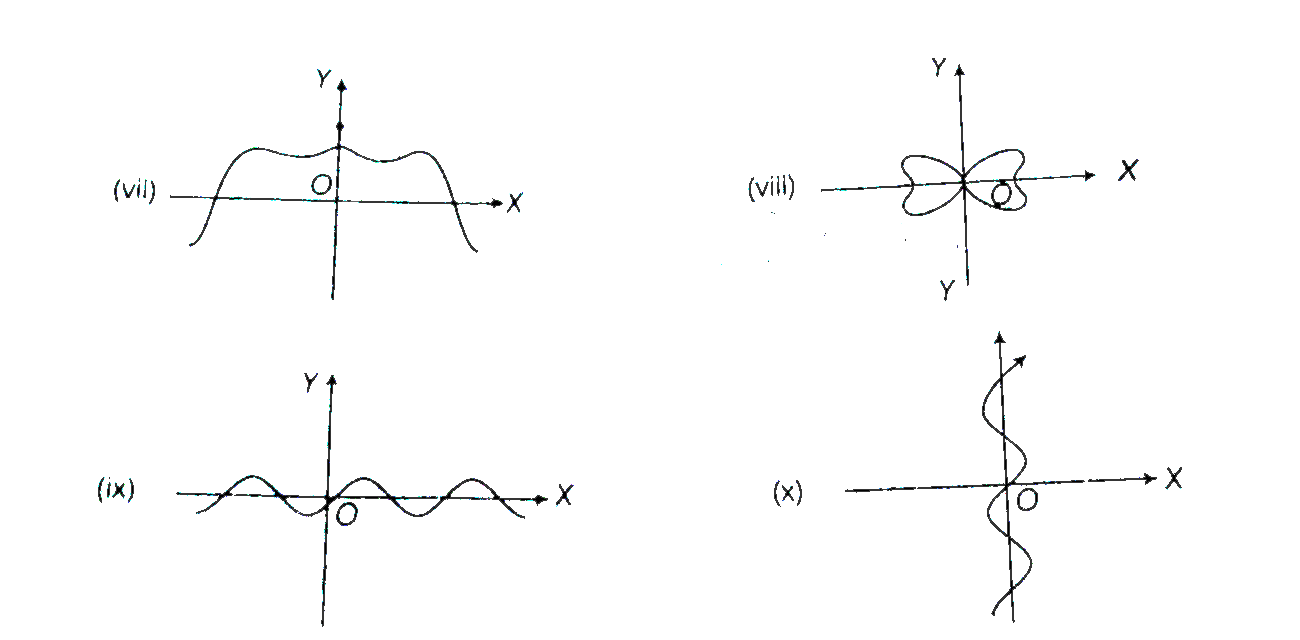
View SolutionExplain with the help of a graph the variation of conductivity with temperature of a metallic conductor.
View SolutionResonance is an example of
View SolutionShow graphically variation of AC with time. Explain the nature of the graph.
View SolutionWhich of the following distance - time graph is not possbile ? Explain why?
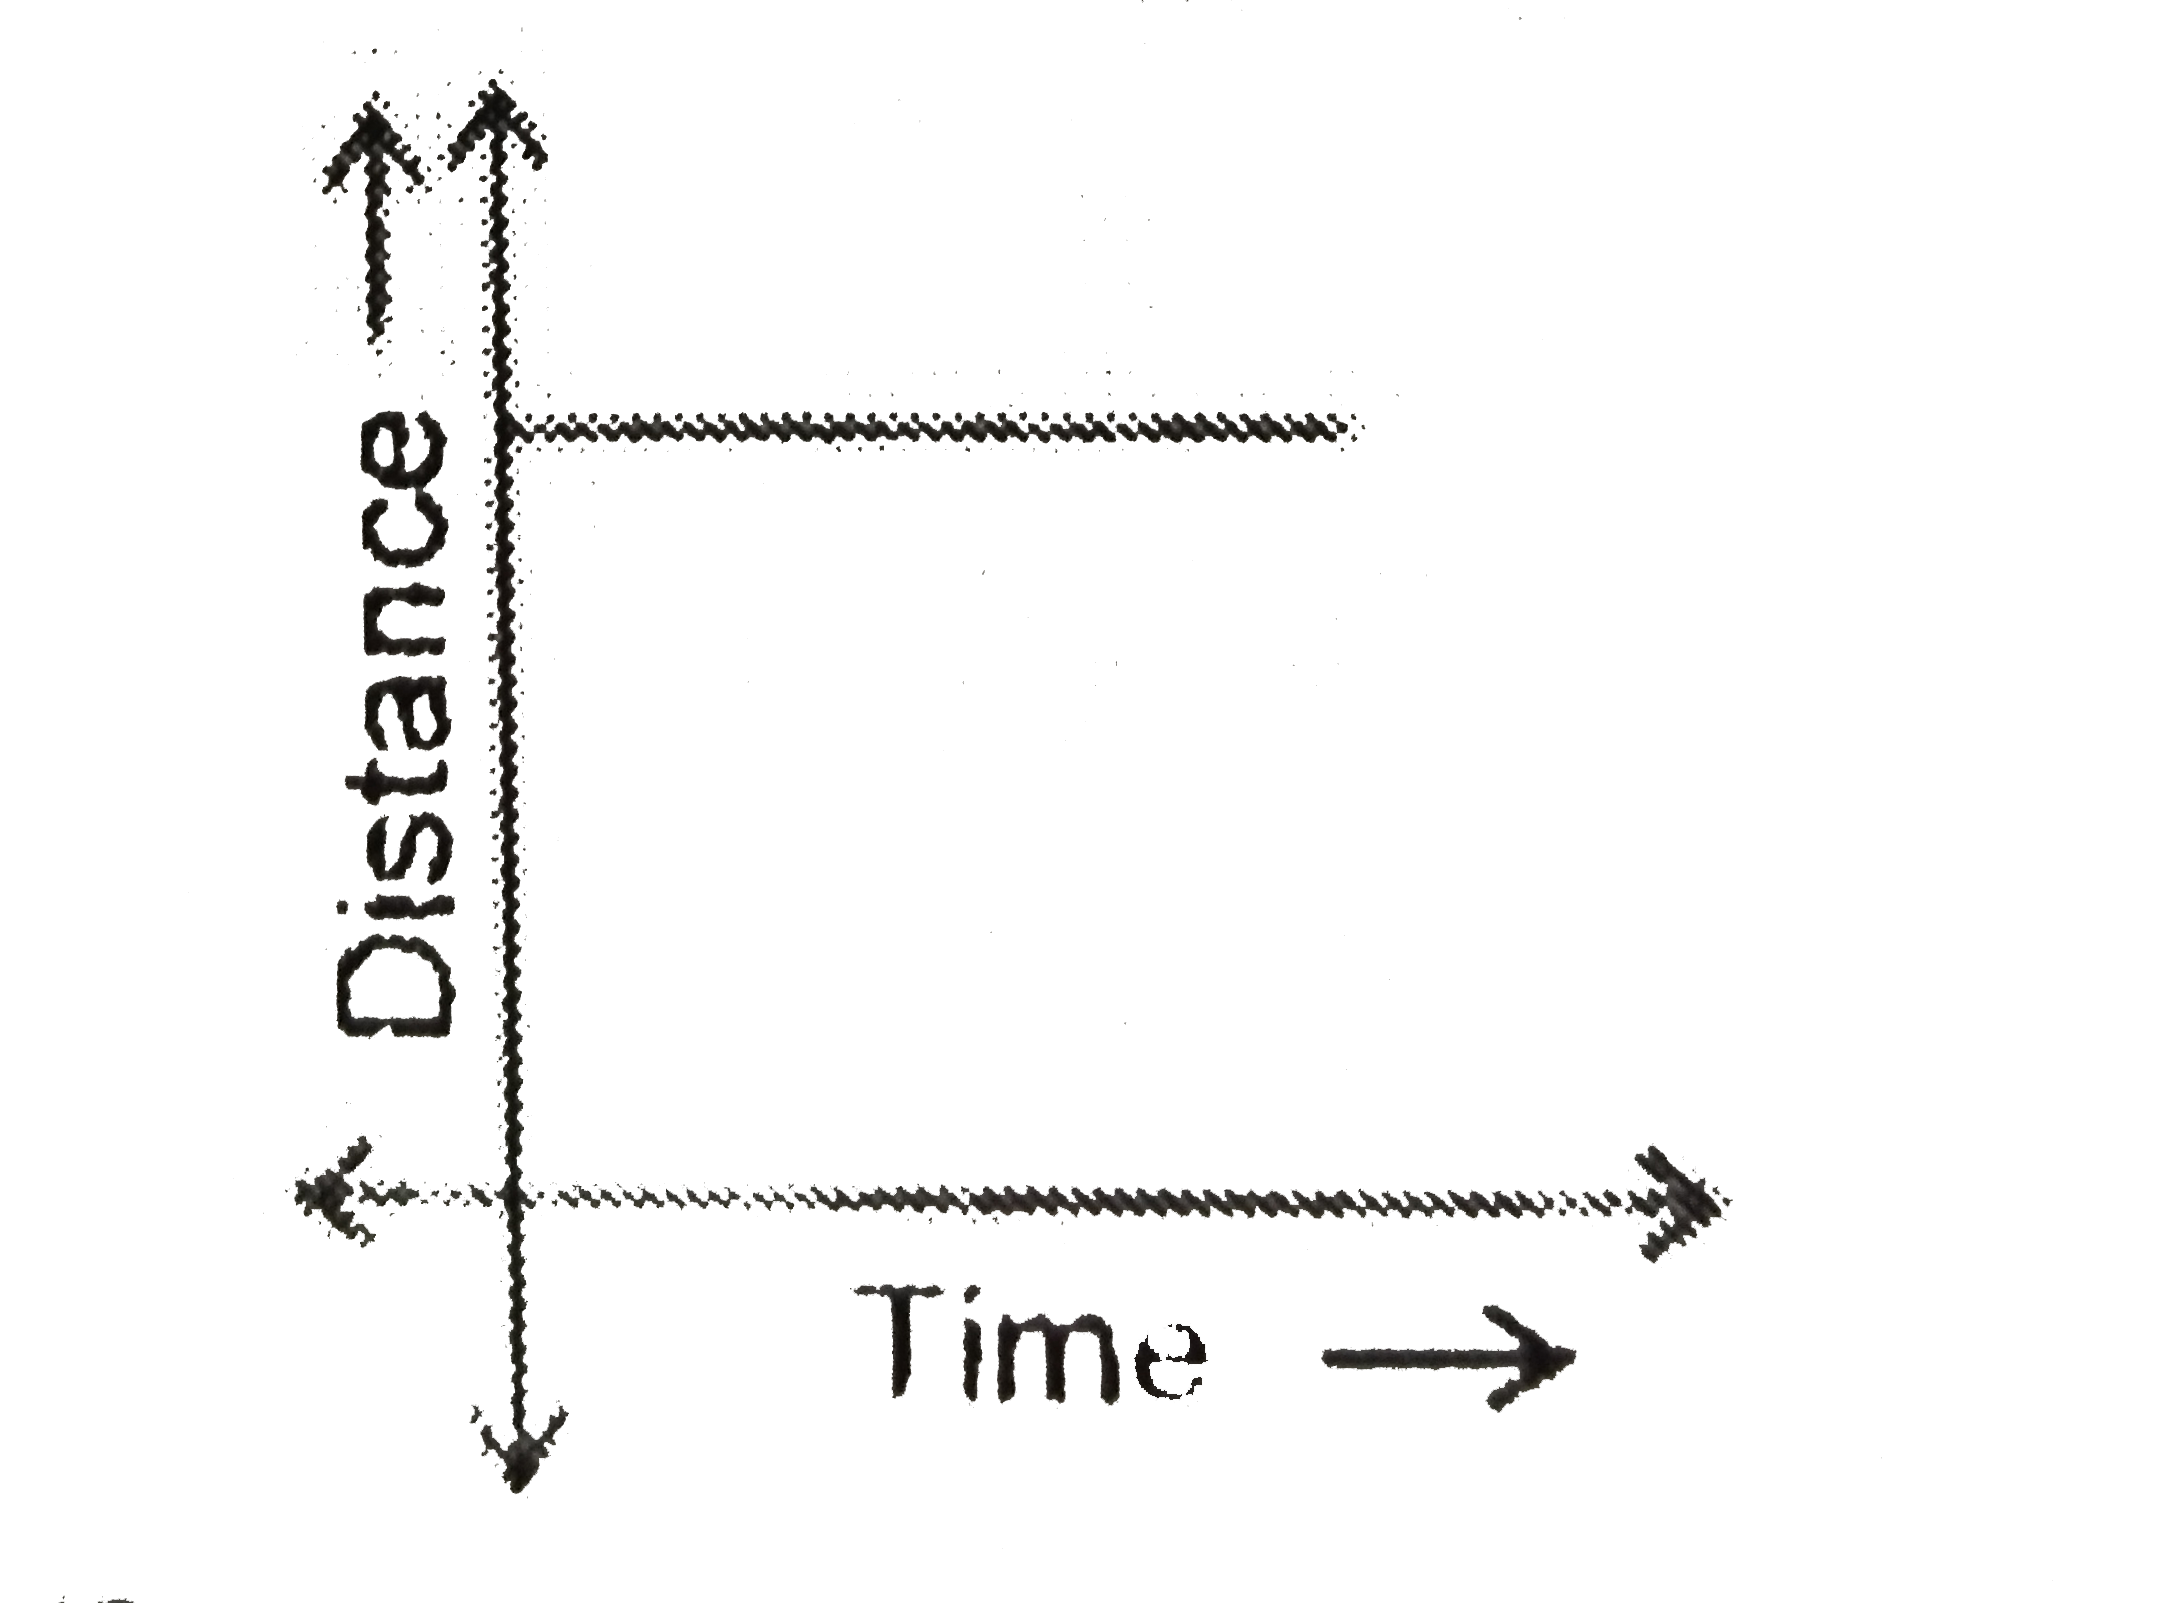
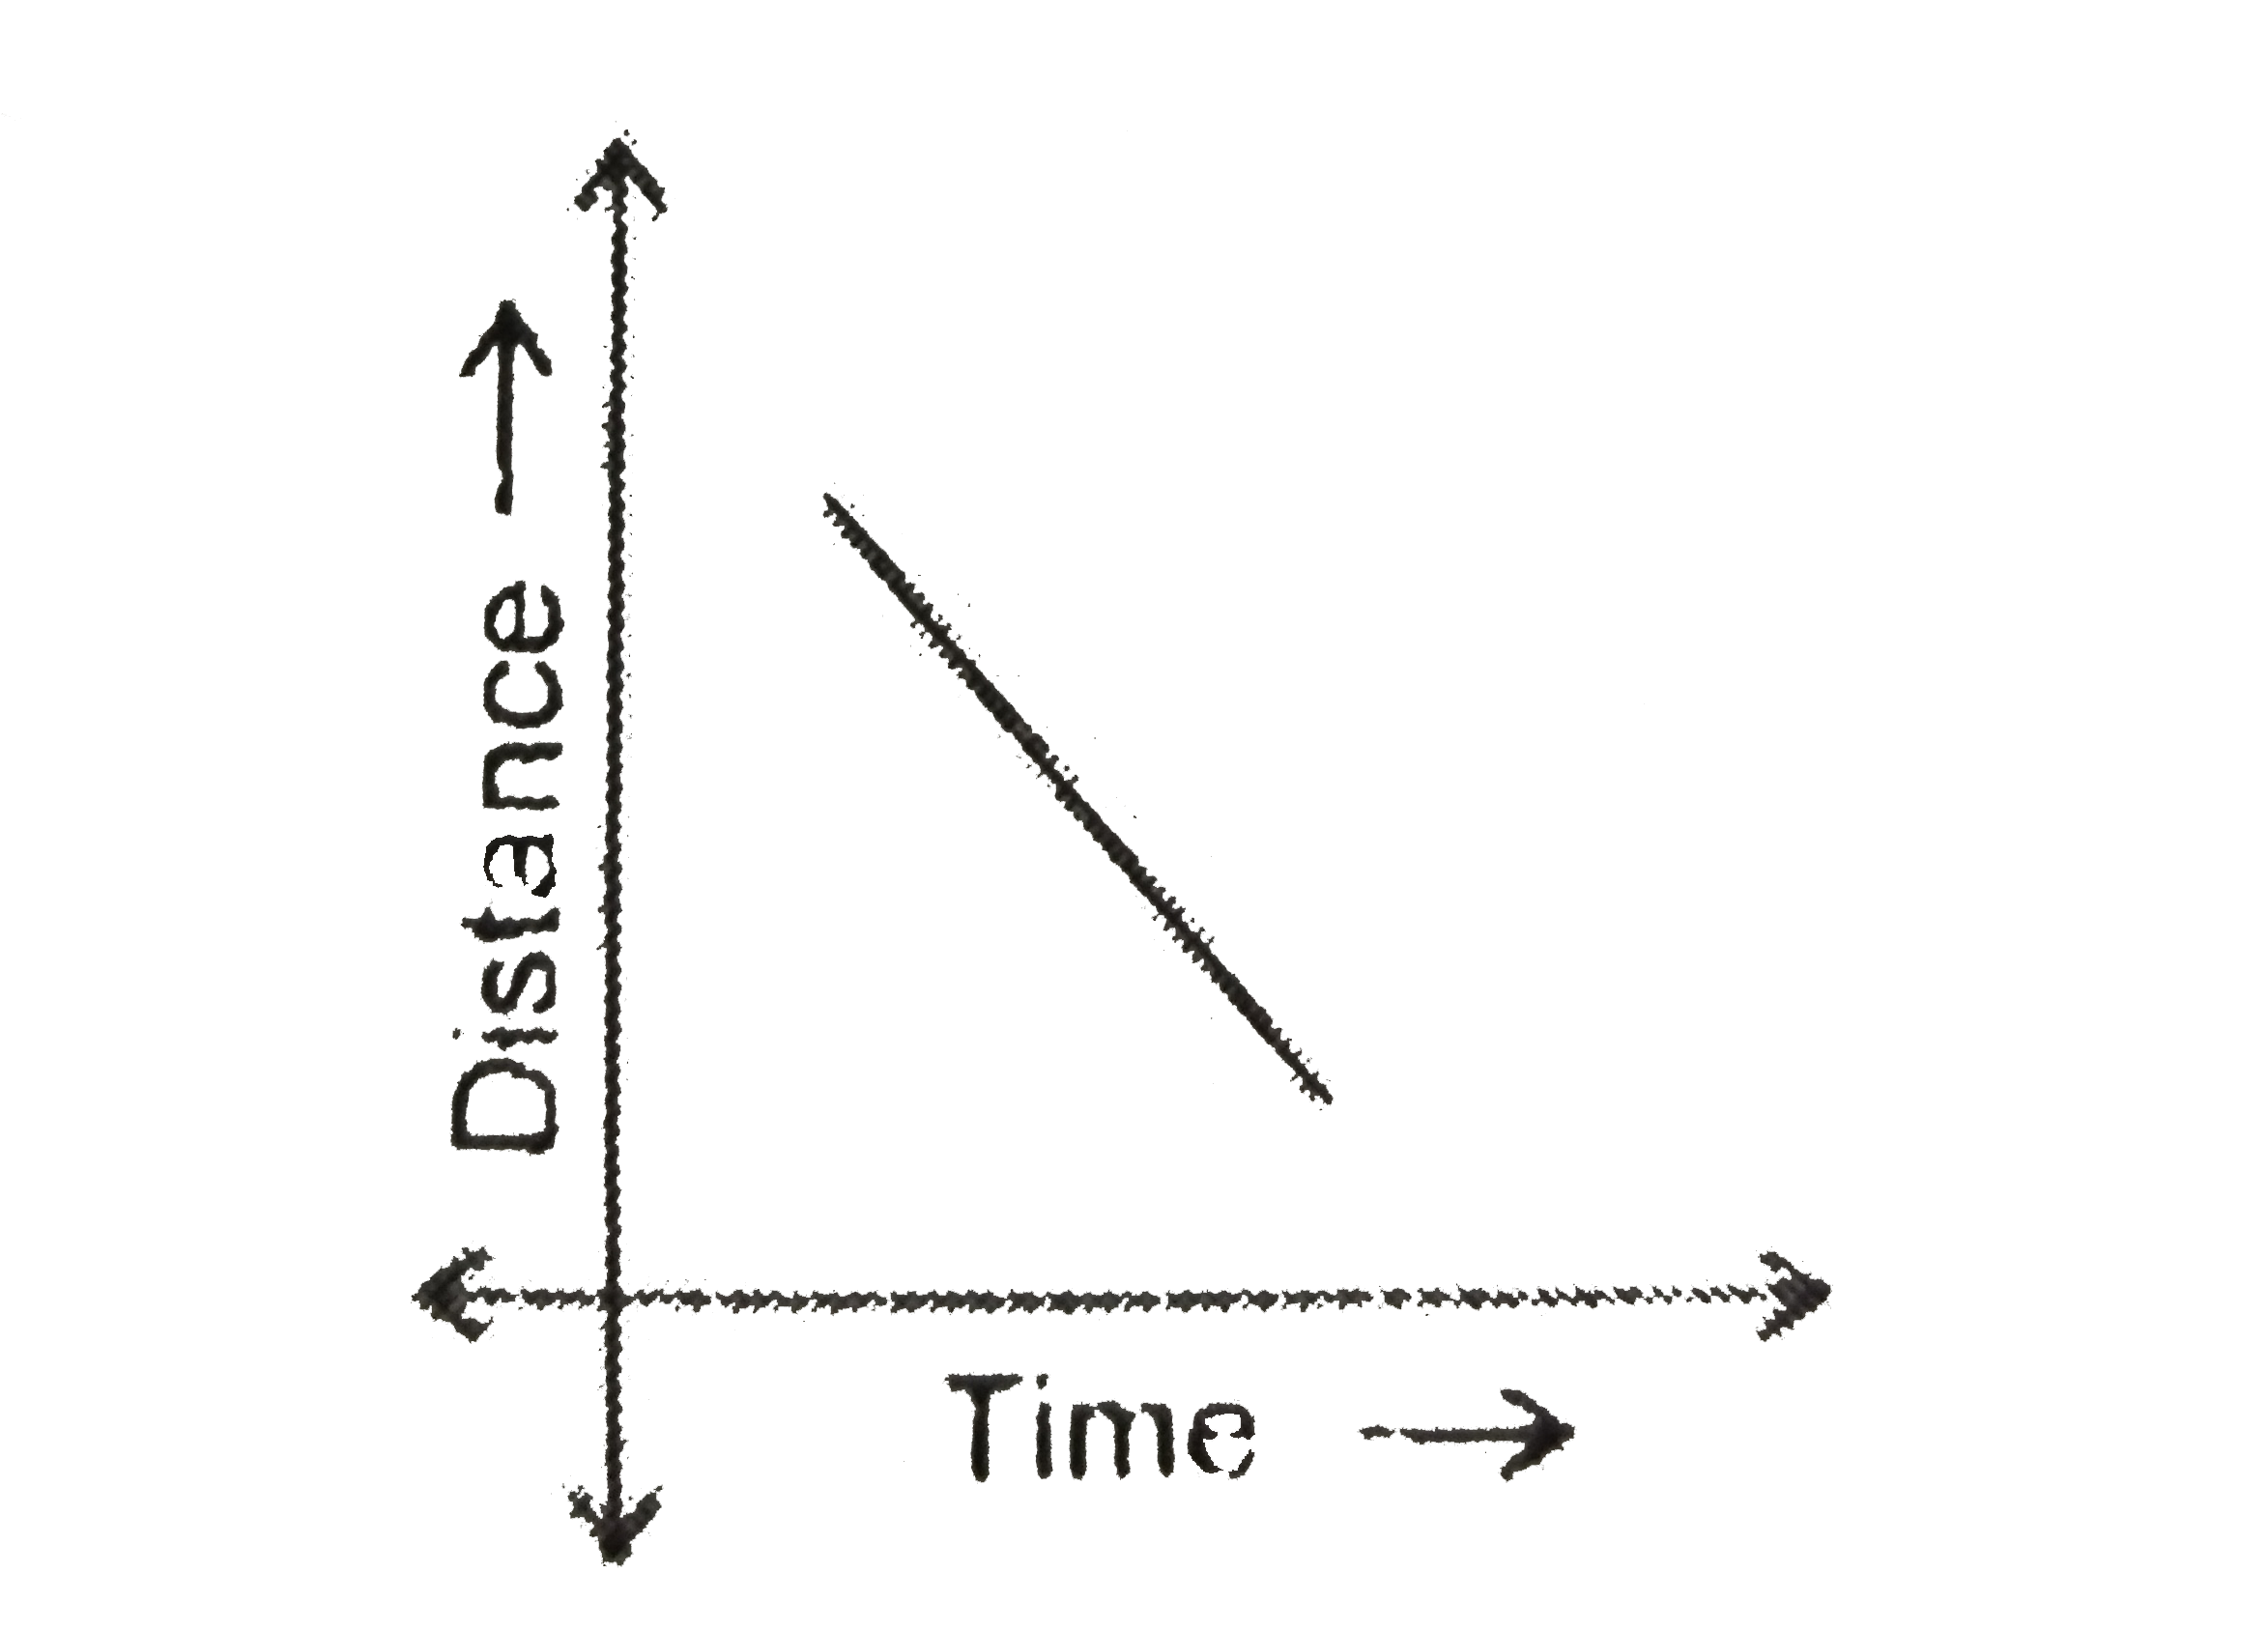
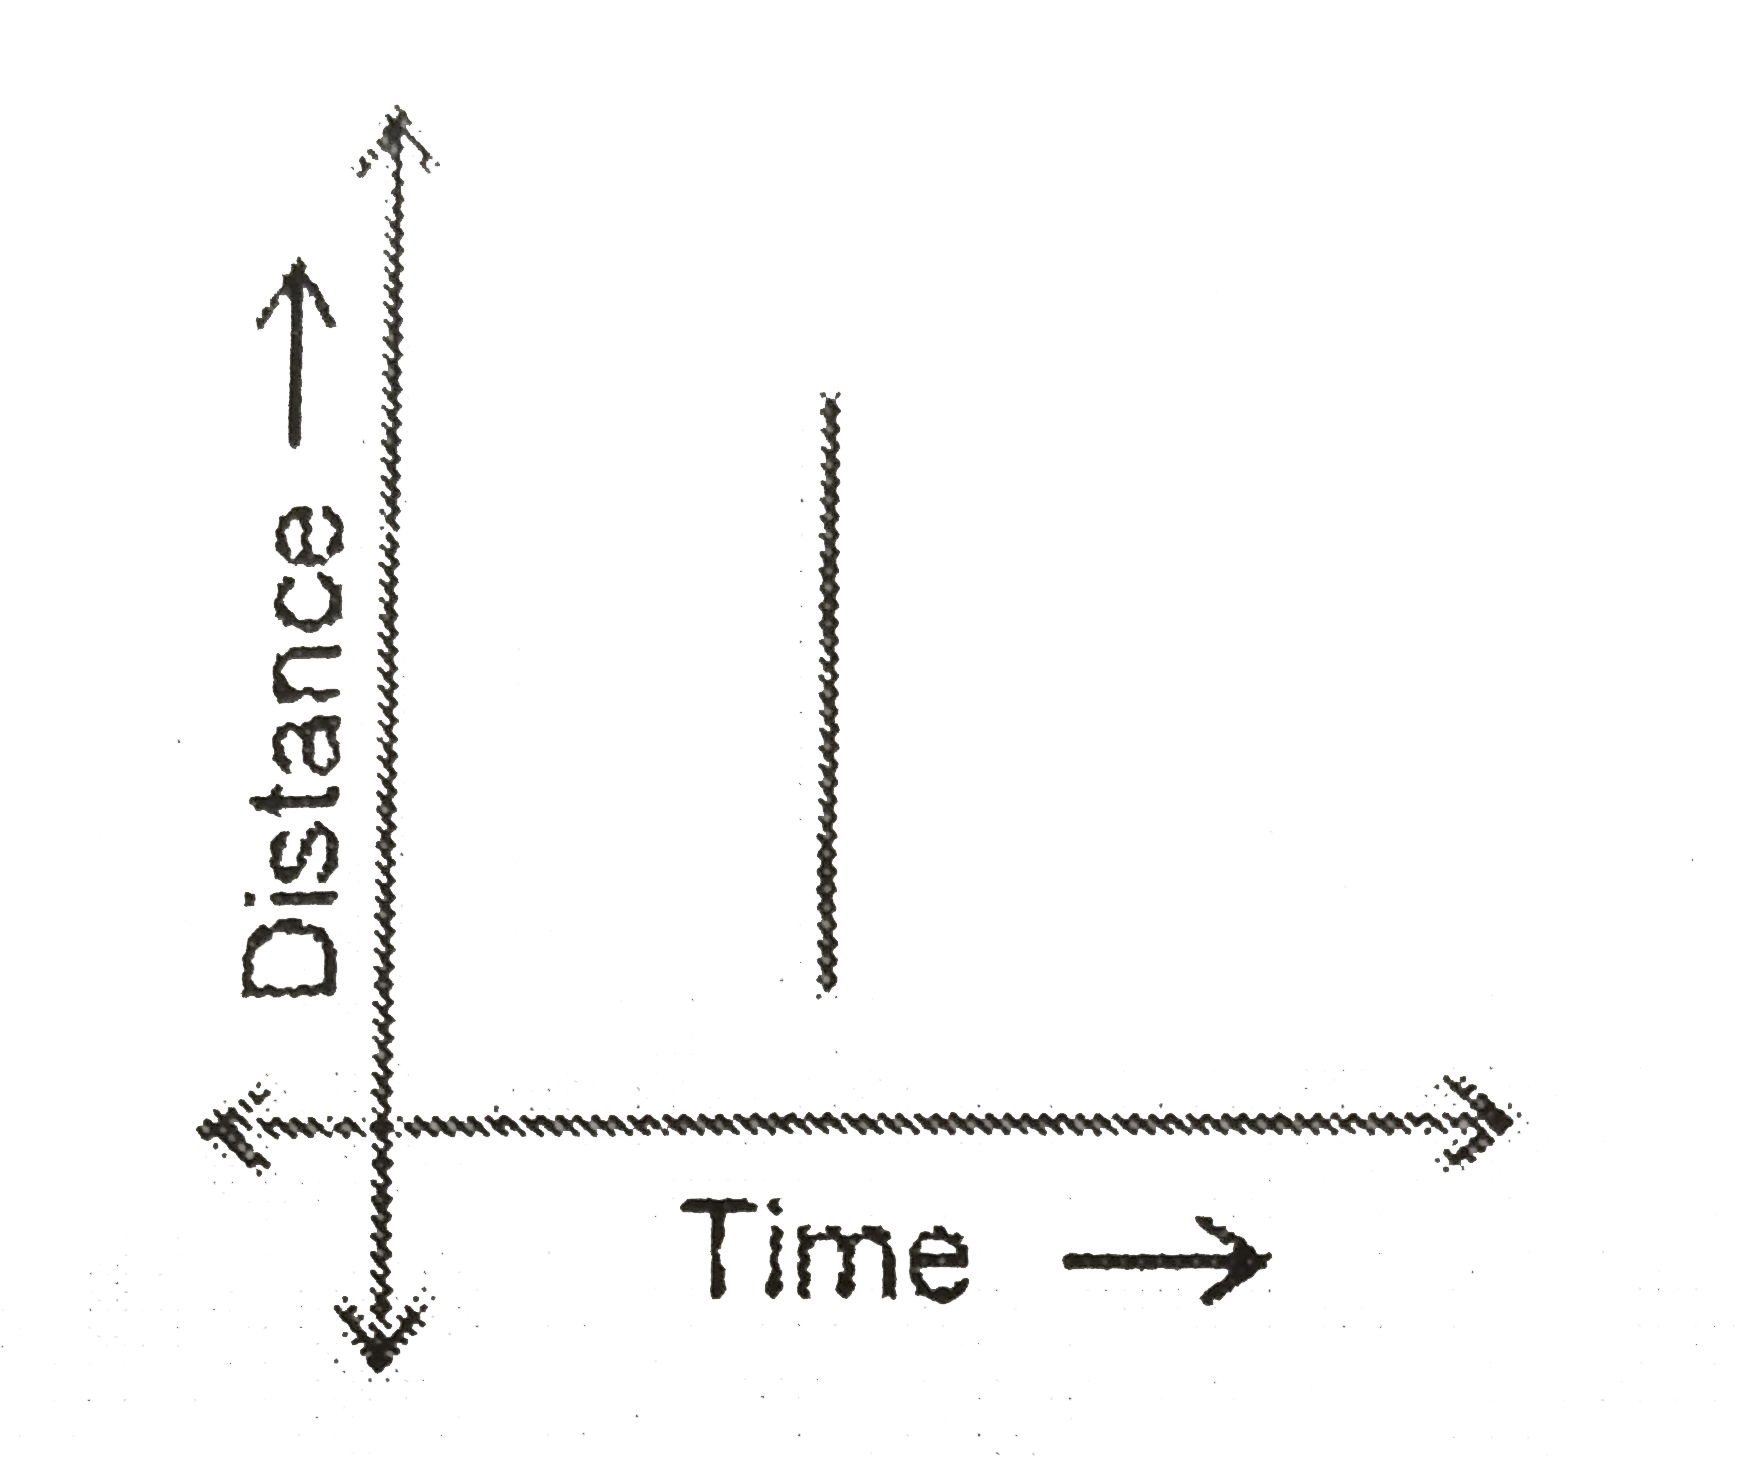
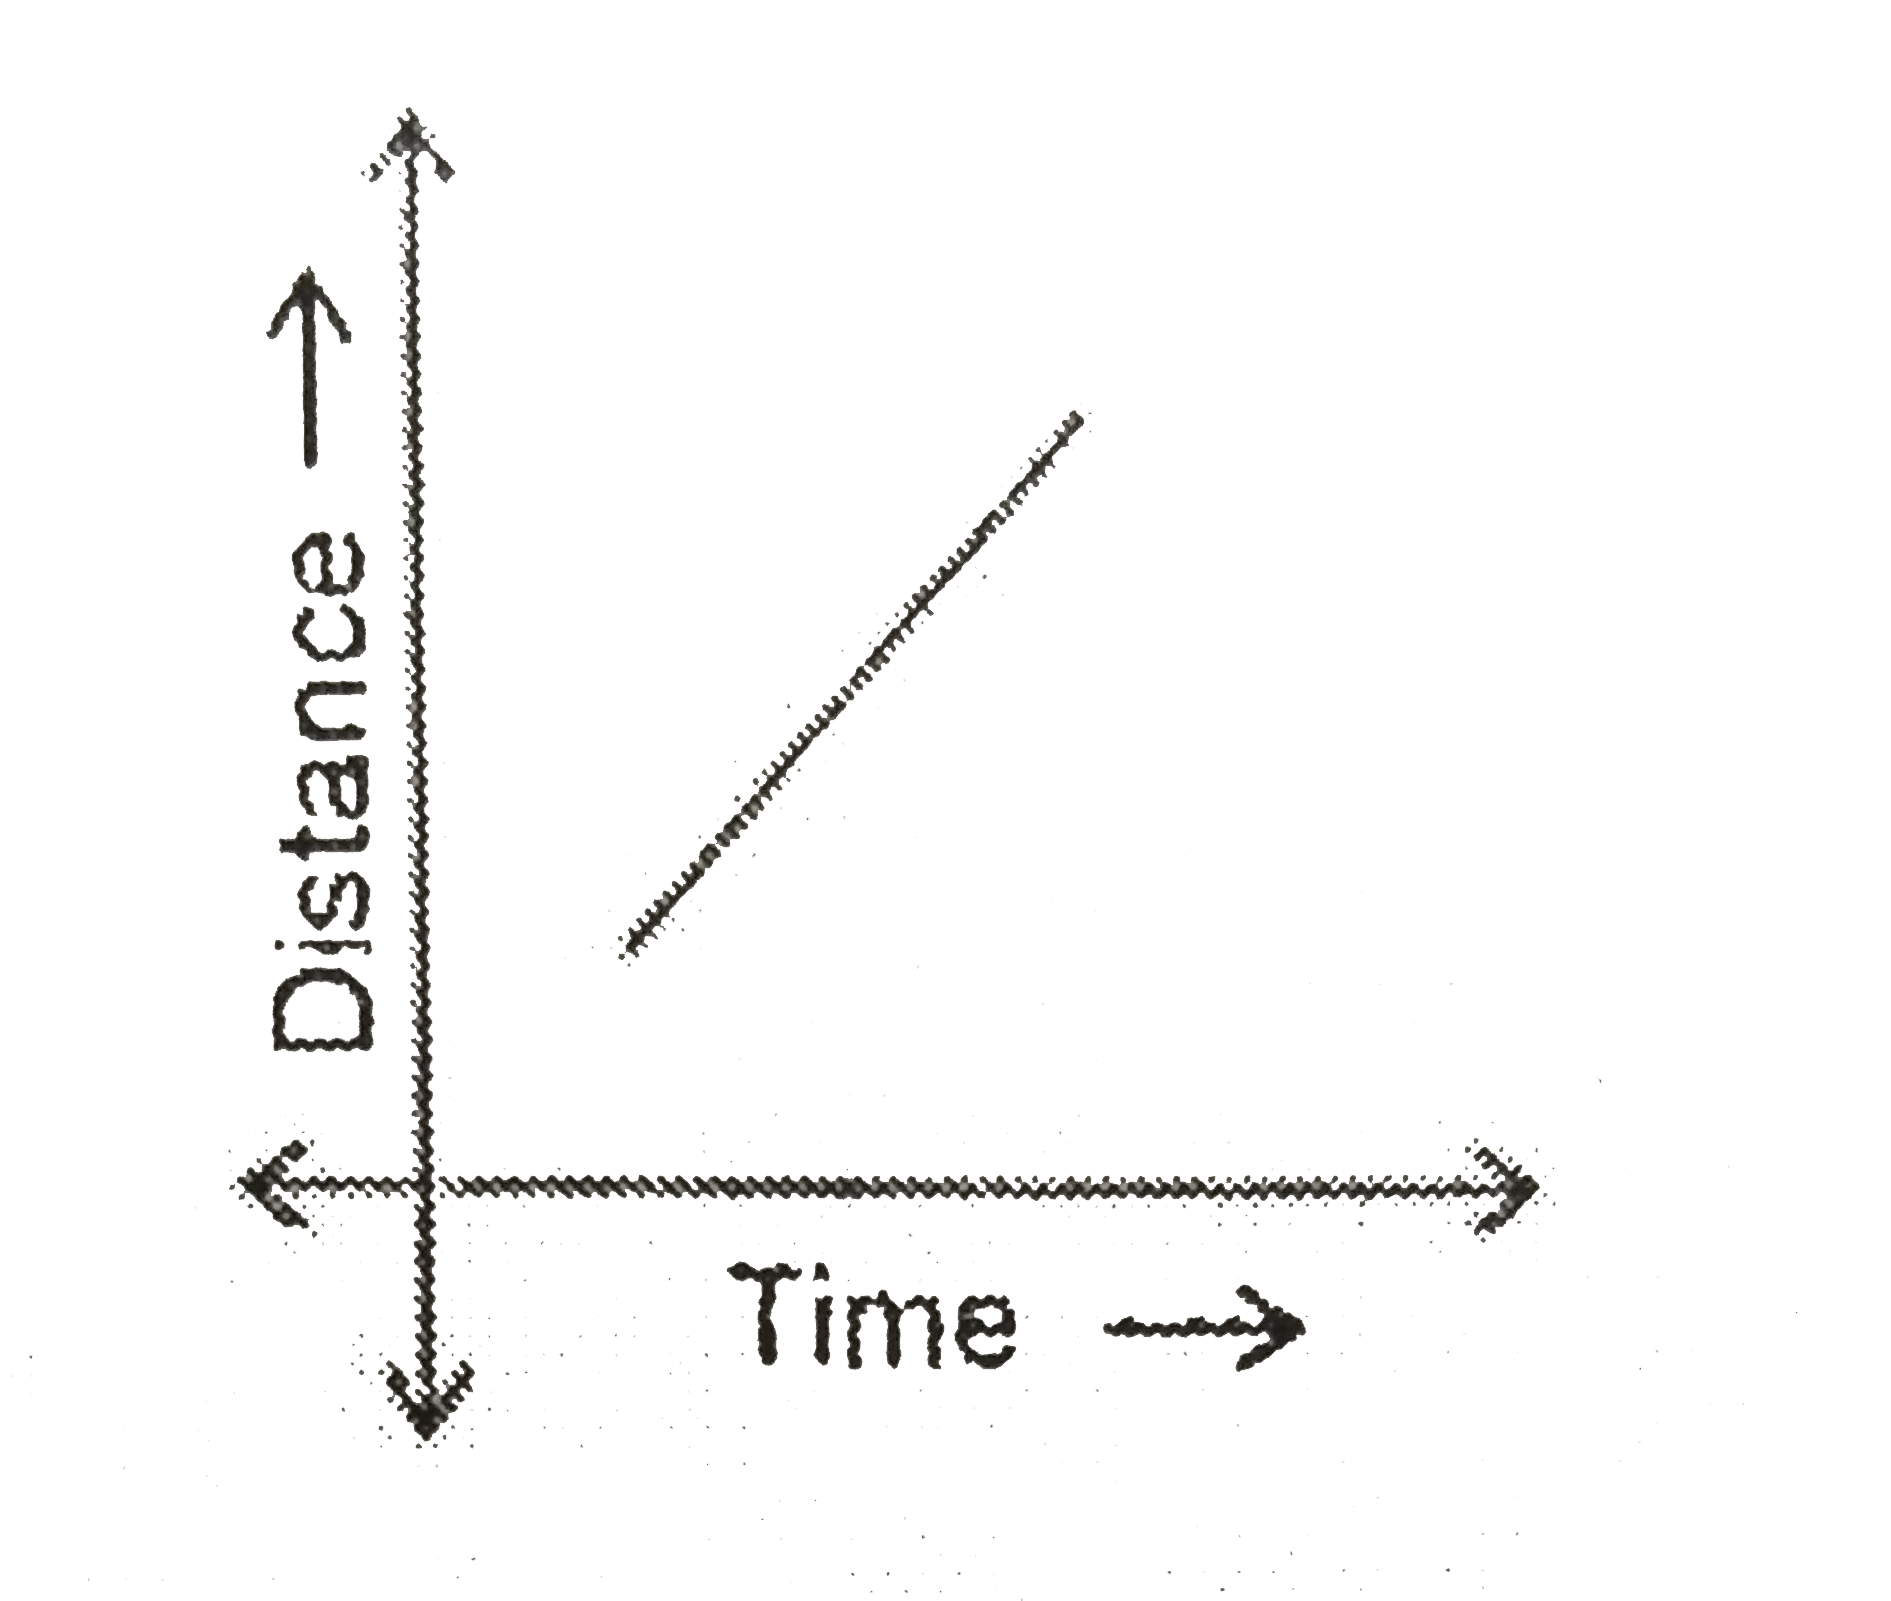
View SolutionExplain the reading and interpretation of bar graphs.
View Solution

