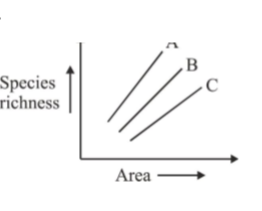
In the above graph, which slope represents more species richness ?
A
A
B
B
C
C
D
All have equal species richness
Video Solution
Text Solution
The correct Answer is:A
|
Answer
Step by step video & image solution for In the above graph, which slope represents more species richness ? by Biology experts to help you in doubts & scoring excellent marks in Class 12 exams.
Updated on:21/07/2023Topper's Solved these Questions
Similar Questions
Knowledge Check
Which set represents isoelectronic species ?
ANa+,Mg2+,Al3+,Cl−BNa+,Ca2+,Sc3+,F−CK+,Cl−,Mg2+,Sc3+DK+,Cl−,Ca2+,Sc3+Which set represents isoelectronic species?
ABe,Al3+,Cl−1BCa2+,Cs+,BrCNa+,Ca2+,Mg2+DN3−,F−,Na+Which graph represents positive acceleration ?
A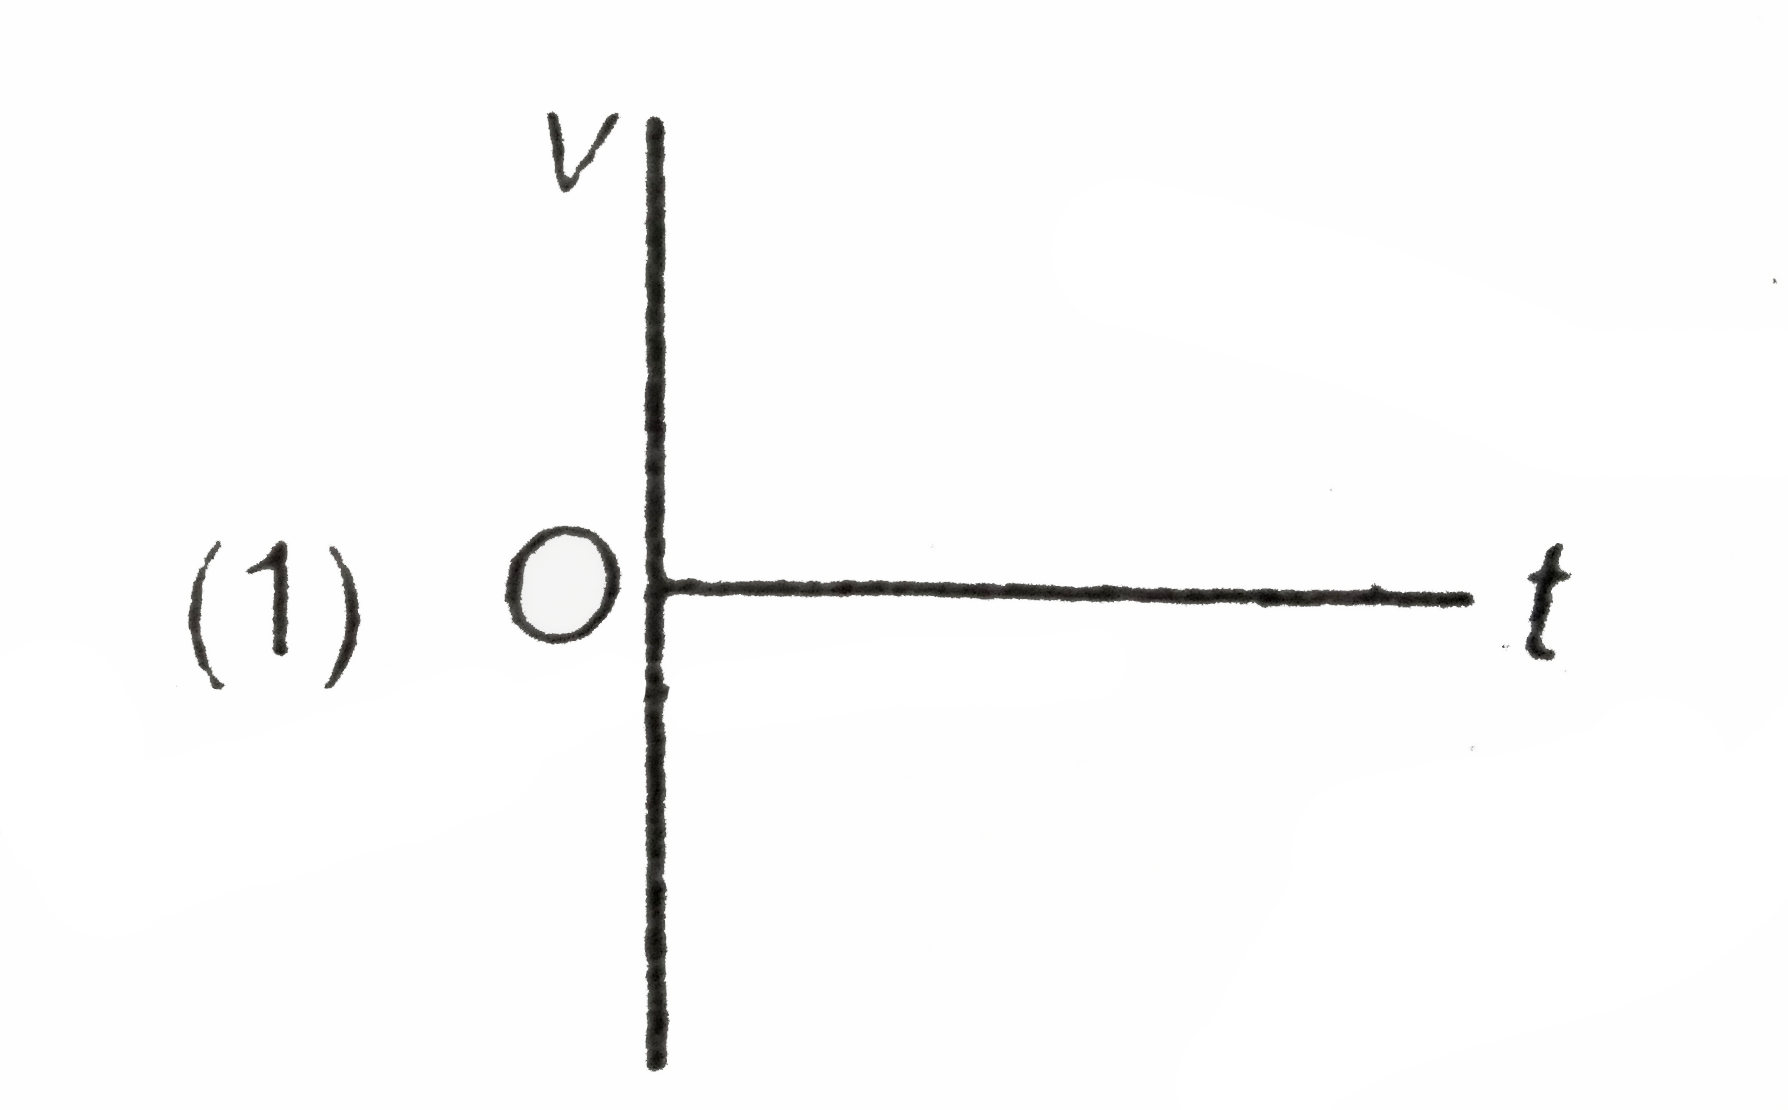 B
B C
C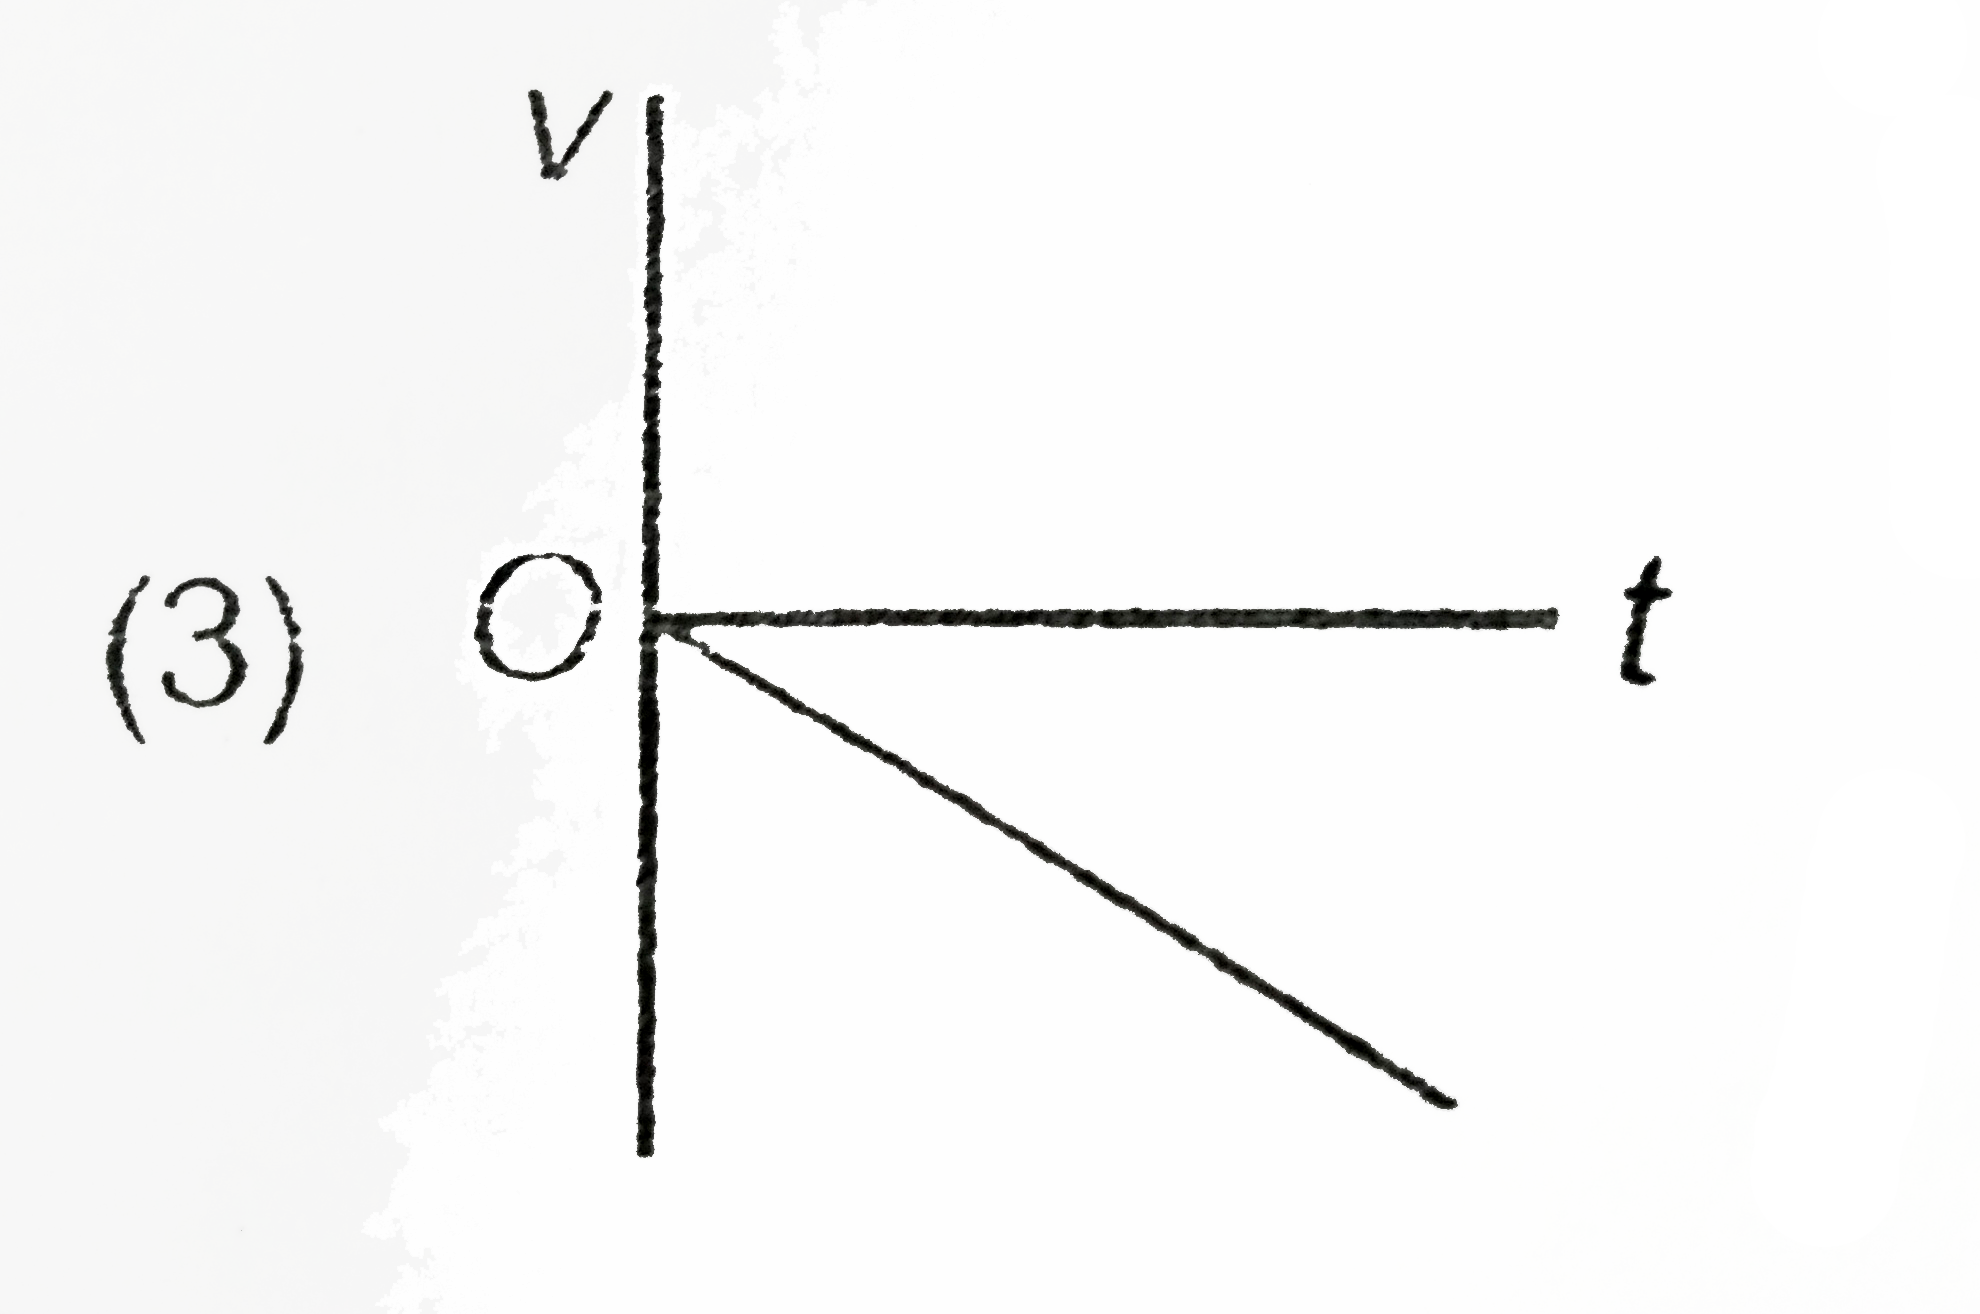 D
D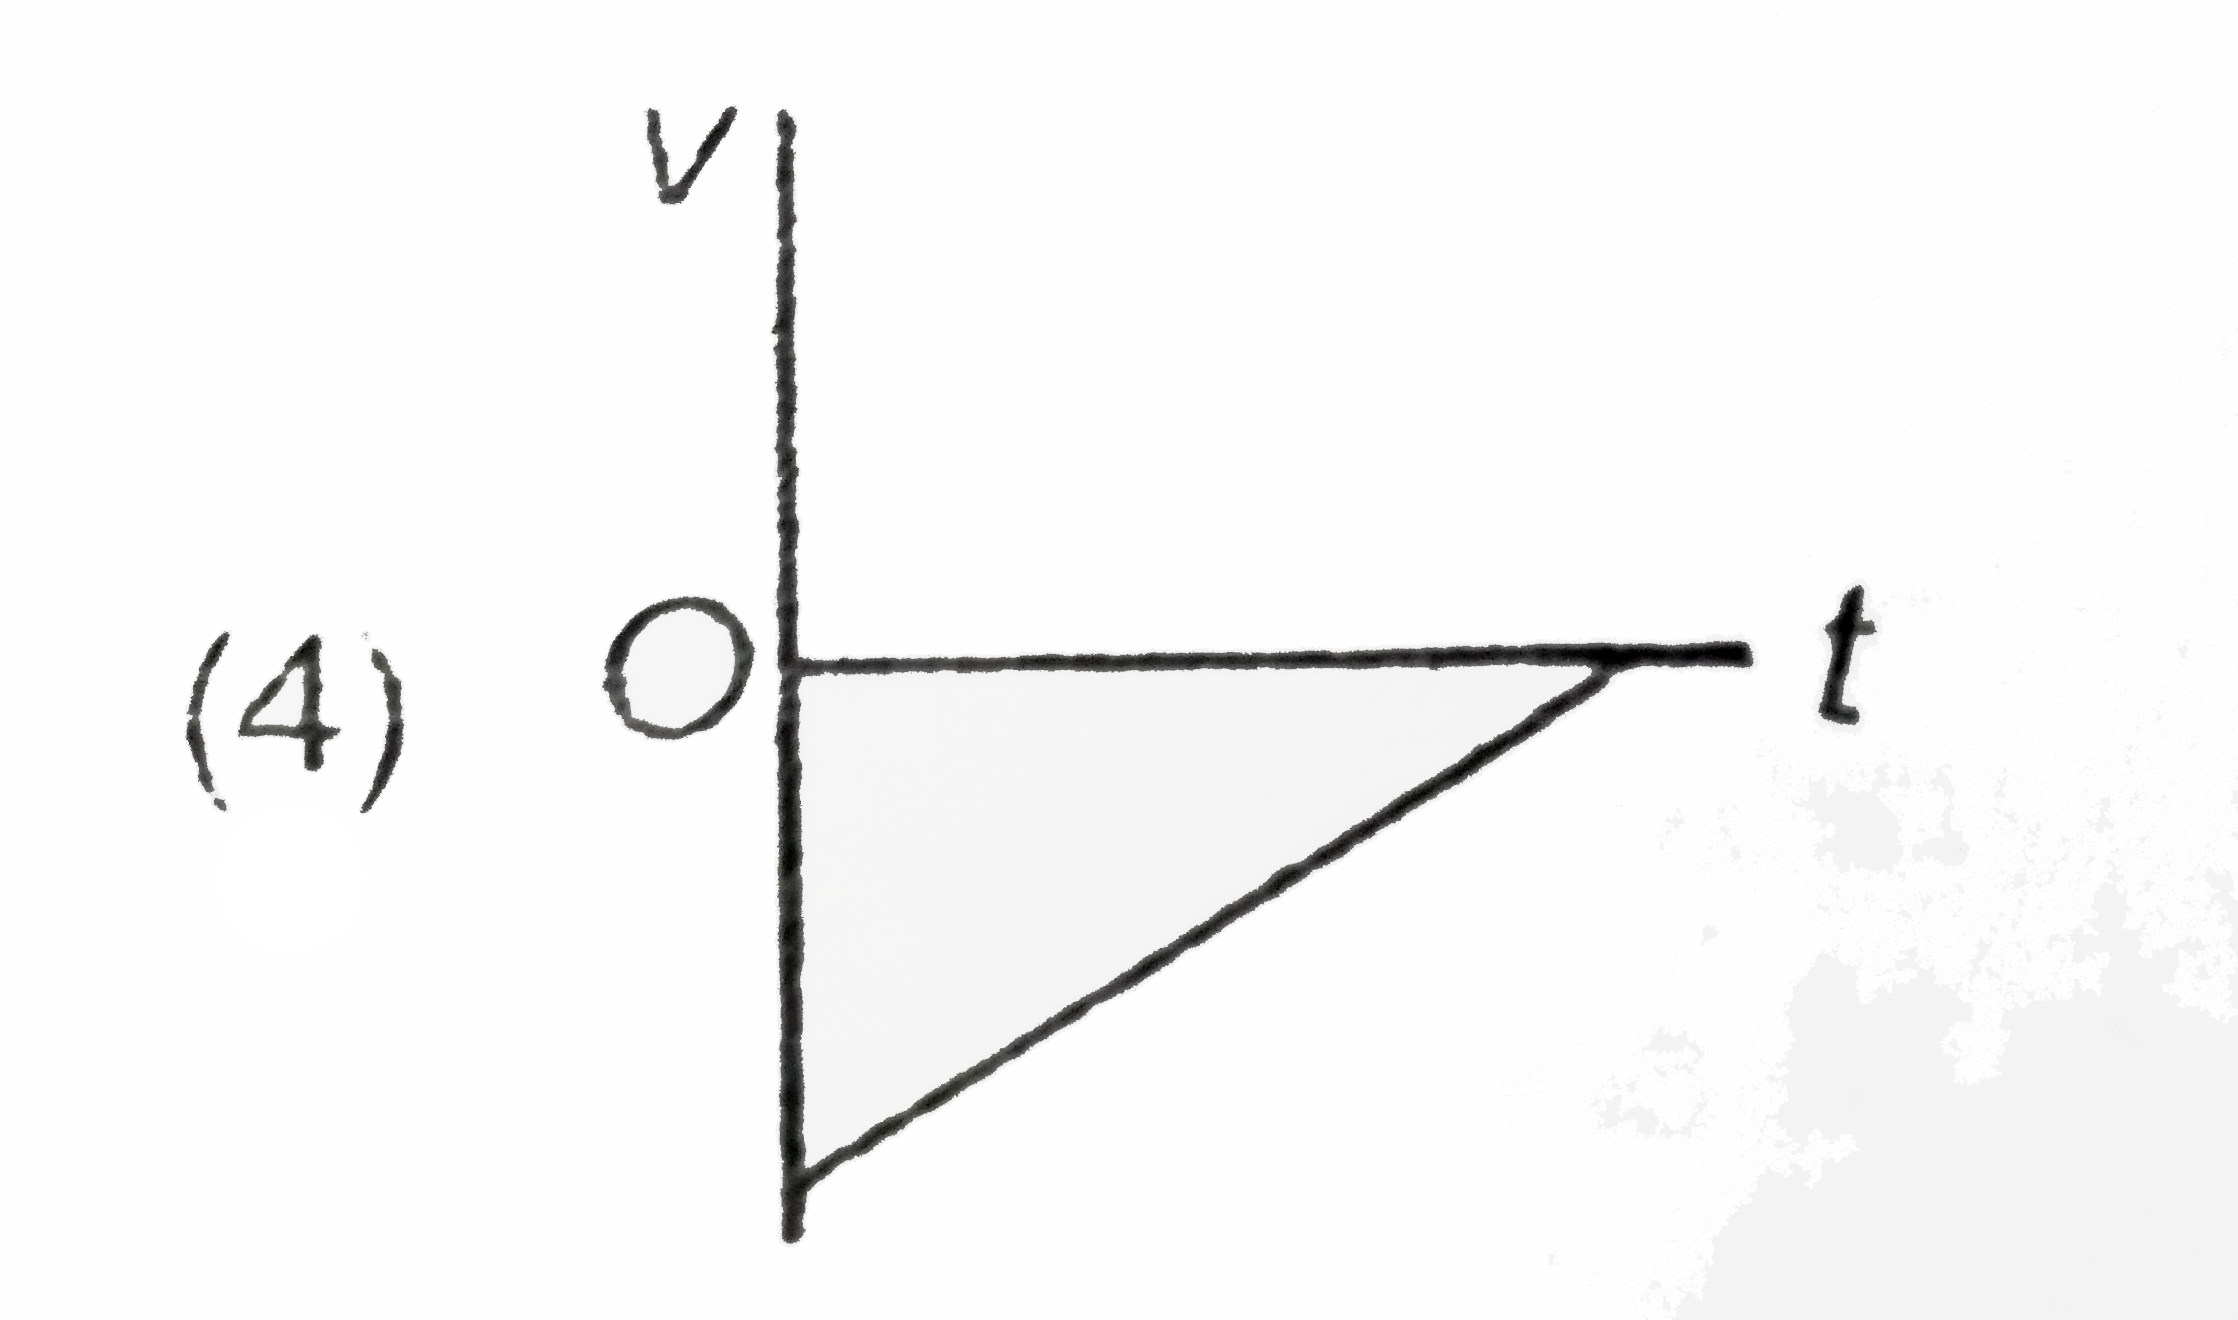
Which graph represents an objects at rest ?
View SolutionWhich of the following graph represents e−x?
View SolutionThe relation between specises richness and area is described on a logarithmic scale by the equation [where S = species richness, A = area, Z = slope of the line (regression coefficient ), C= Y - intercept]
View SolutionWhich graph represents the uniform acceleration
View SolutionWhich one of the following graphs represents motion?
View Solution

