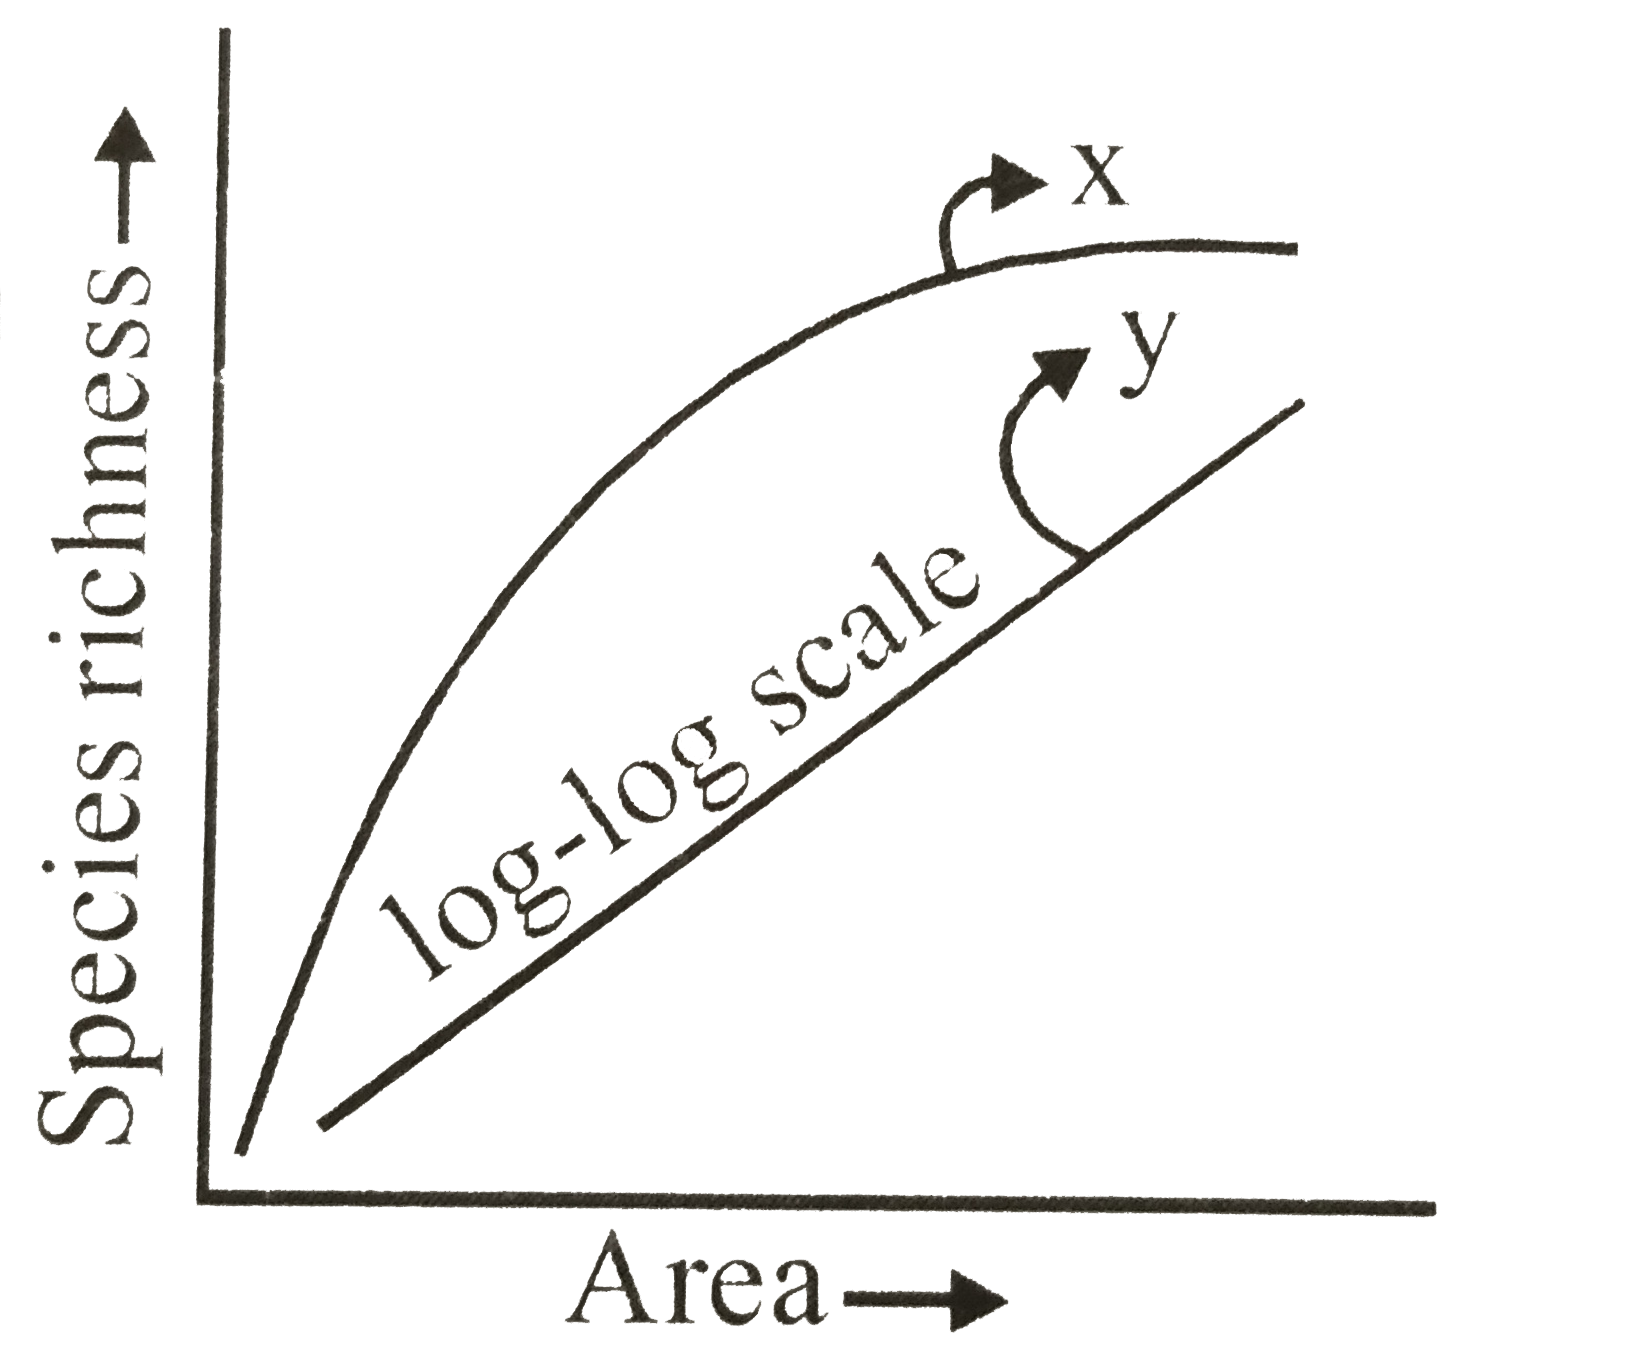
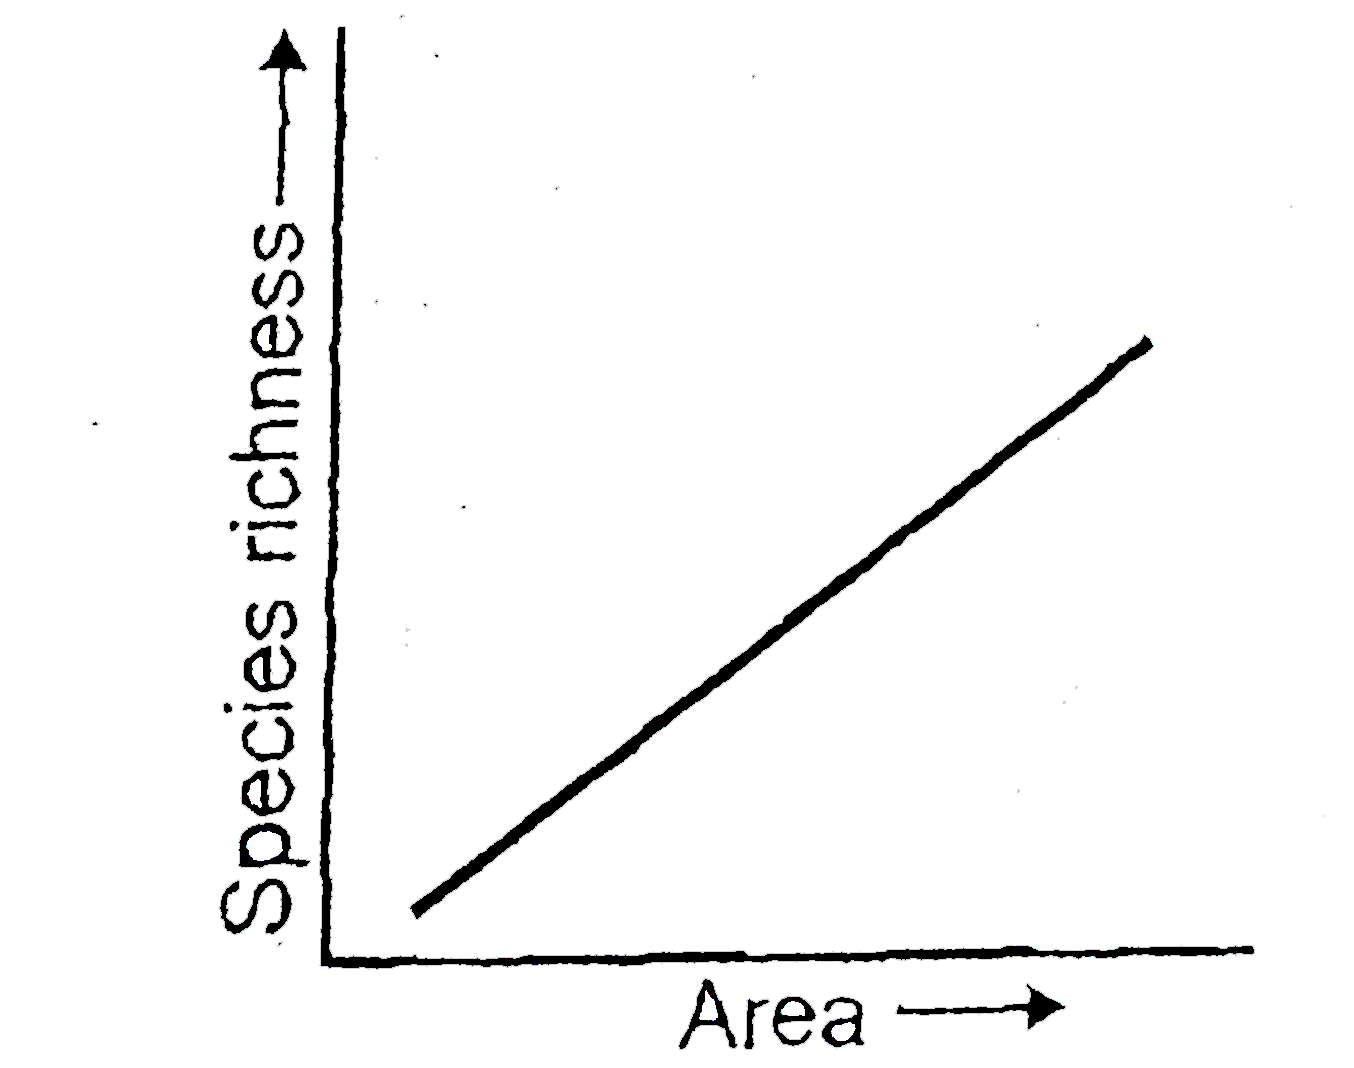
The relation between specises richness and area is described on a logarithmic scale by the equation [where S = species richness, A = area, Z = slope of the line (regression coefficient ), C= Y - intercept]
log S = log C
log S = Z log A
logS=logC−ZlogA
logS=logC+ZlogA
The correct Answer is:D
Step by step video, text & image solution for The relation between specises richness and area is described on a logarithmic scale by the equation [where S = species richness, A = area, Z = slope of the line (regression coefficient ), C= Y - intercept] by Biology experts to help you in doubts & scoring excellent marks in Class 12 exams.
Topper's Solved these Questions
- BOOK - GRB PUBLICATIONCHAPTER - BIODIVERSITY AND CONSERVATIONEXERCISE - NCERT CORNER (EXEMPLAR PROBLEMS)30videos
BIODIVERSITY AND CONSERVATION
- BOOK - GRB PUBLICATIONCHAPTER - BASIC CONCEPTS OF IMMUNOLOGYEXERCISE - TRANSPLANTATION95videos
BASIC CONCEPTS OF IMMUNOLOGY
- BOOK - GRB PUBLICATIONCHAPTER - BIOTECHNOLOGY : APPLICATION IN AGRICULTURE AND HEALTHEXERCISE - Assertion-Reason Type Questions21videos
BIOTECHNOLOGY : APPLICATION IN AGRICULTURE AND HEALTH
Similar Questions
Knowledge Check
- Question 1 - Select One
The relation between specles richness and area Is described on a logarithmic scale by the equaton (where 8 - specles richness, A= area, Z = slope of the line (regression co-efficient), C=Y-Intercept].
Alog S= log C-Z log ABlog S= Z log AClog S = log C+ Z log ADlog S = log C - Question 2 - Select One
The relation between species richness and area is correctly depicted by
ALogS=logC−ZlogABLogS=ZlogACLogS=logC+ZlogADLogS=logC - Question 3 - Select One
The relation between species richness and area for a wide variety of taxa (angiosperm plants, birds, bats, freshwater fishes) is a
AParabolaBRectangular hyperbolaCEllipseDStraight line

Study the above graph and answer the following questions -
(i) Identify x and y
(ii) The relation between species richness and area can be denoted as generally
(iii) The value of z lies in range of
(iv) On a log scale the relation between species richness and area isView SolutionWhich of the statement are in accordance with the observation of geographer Alexander von Humboldt ?
I. Within a region species, richness increases with increasing explored area but within a limit.
II. The relation between species richness and area is a rectangular hyperbole.
III. The richness of species decreases with the increasing explored area.
IV. There is no relation between the explored area and species richness .View SolutionOn a logarithmic scale the correct representation of species area relationship is represented by the equation
View SolutionIn the equation of the species - area relationship , the letter 'C' and 'Z' represent:
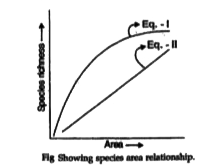
View SolutionThe great German naturalist and geographer Alexander von Humboldt observed that within a region species richness increased with increasing explored area, but only up to a limit. In fact, relation between species richness and area for a wide variety of taxa (angiosperm plants, birds, bats, freshwater fi ishes) turns out to be a rectangular hyperbola. Now find out correct equations shown in the graph.
 View Solution

