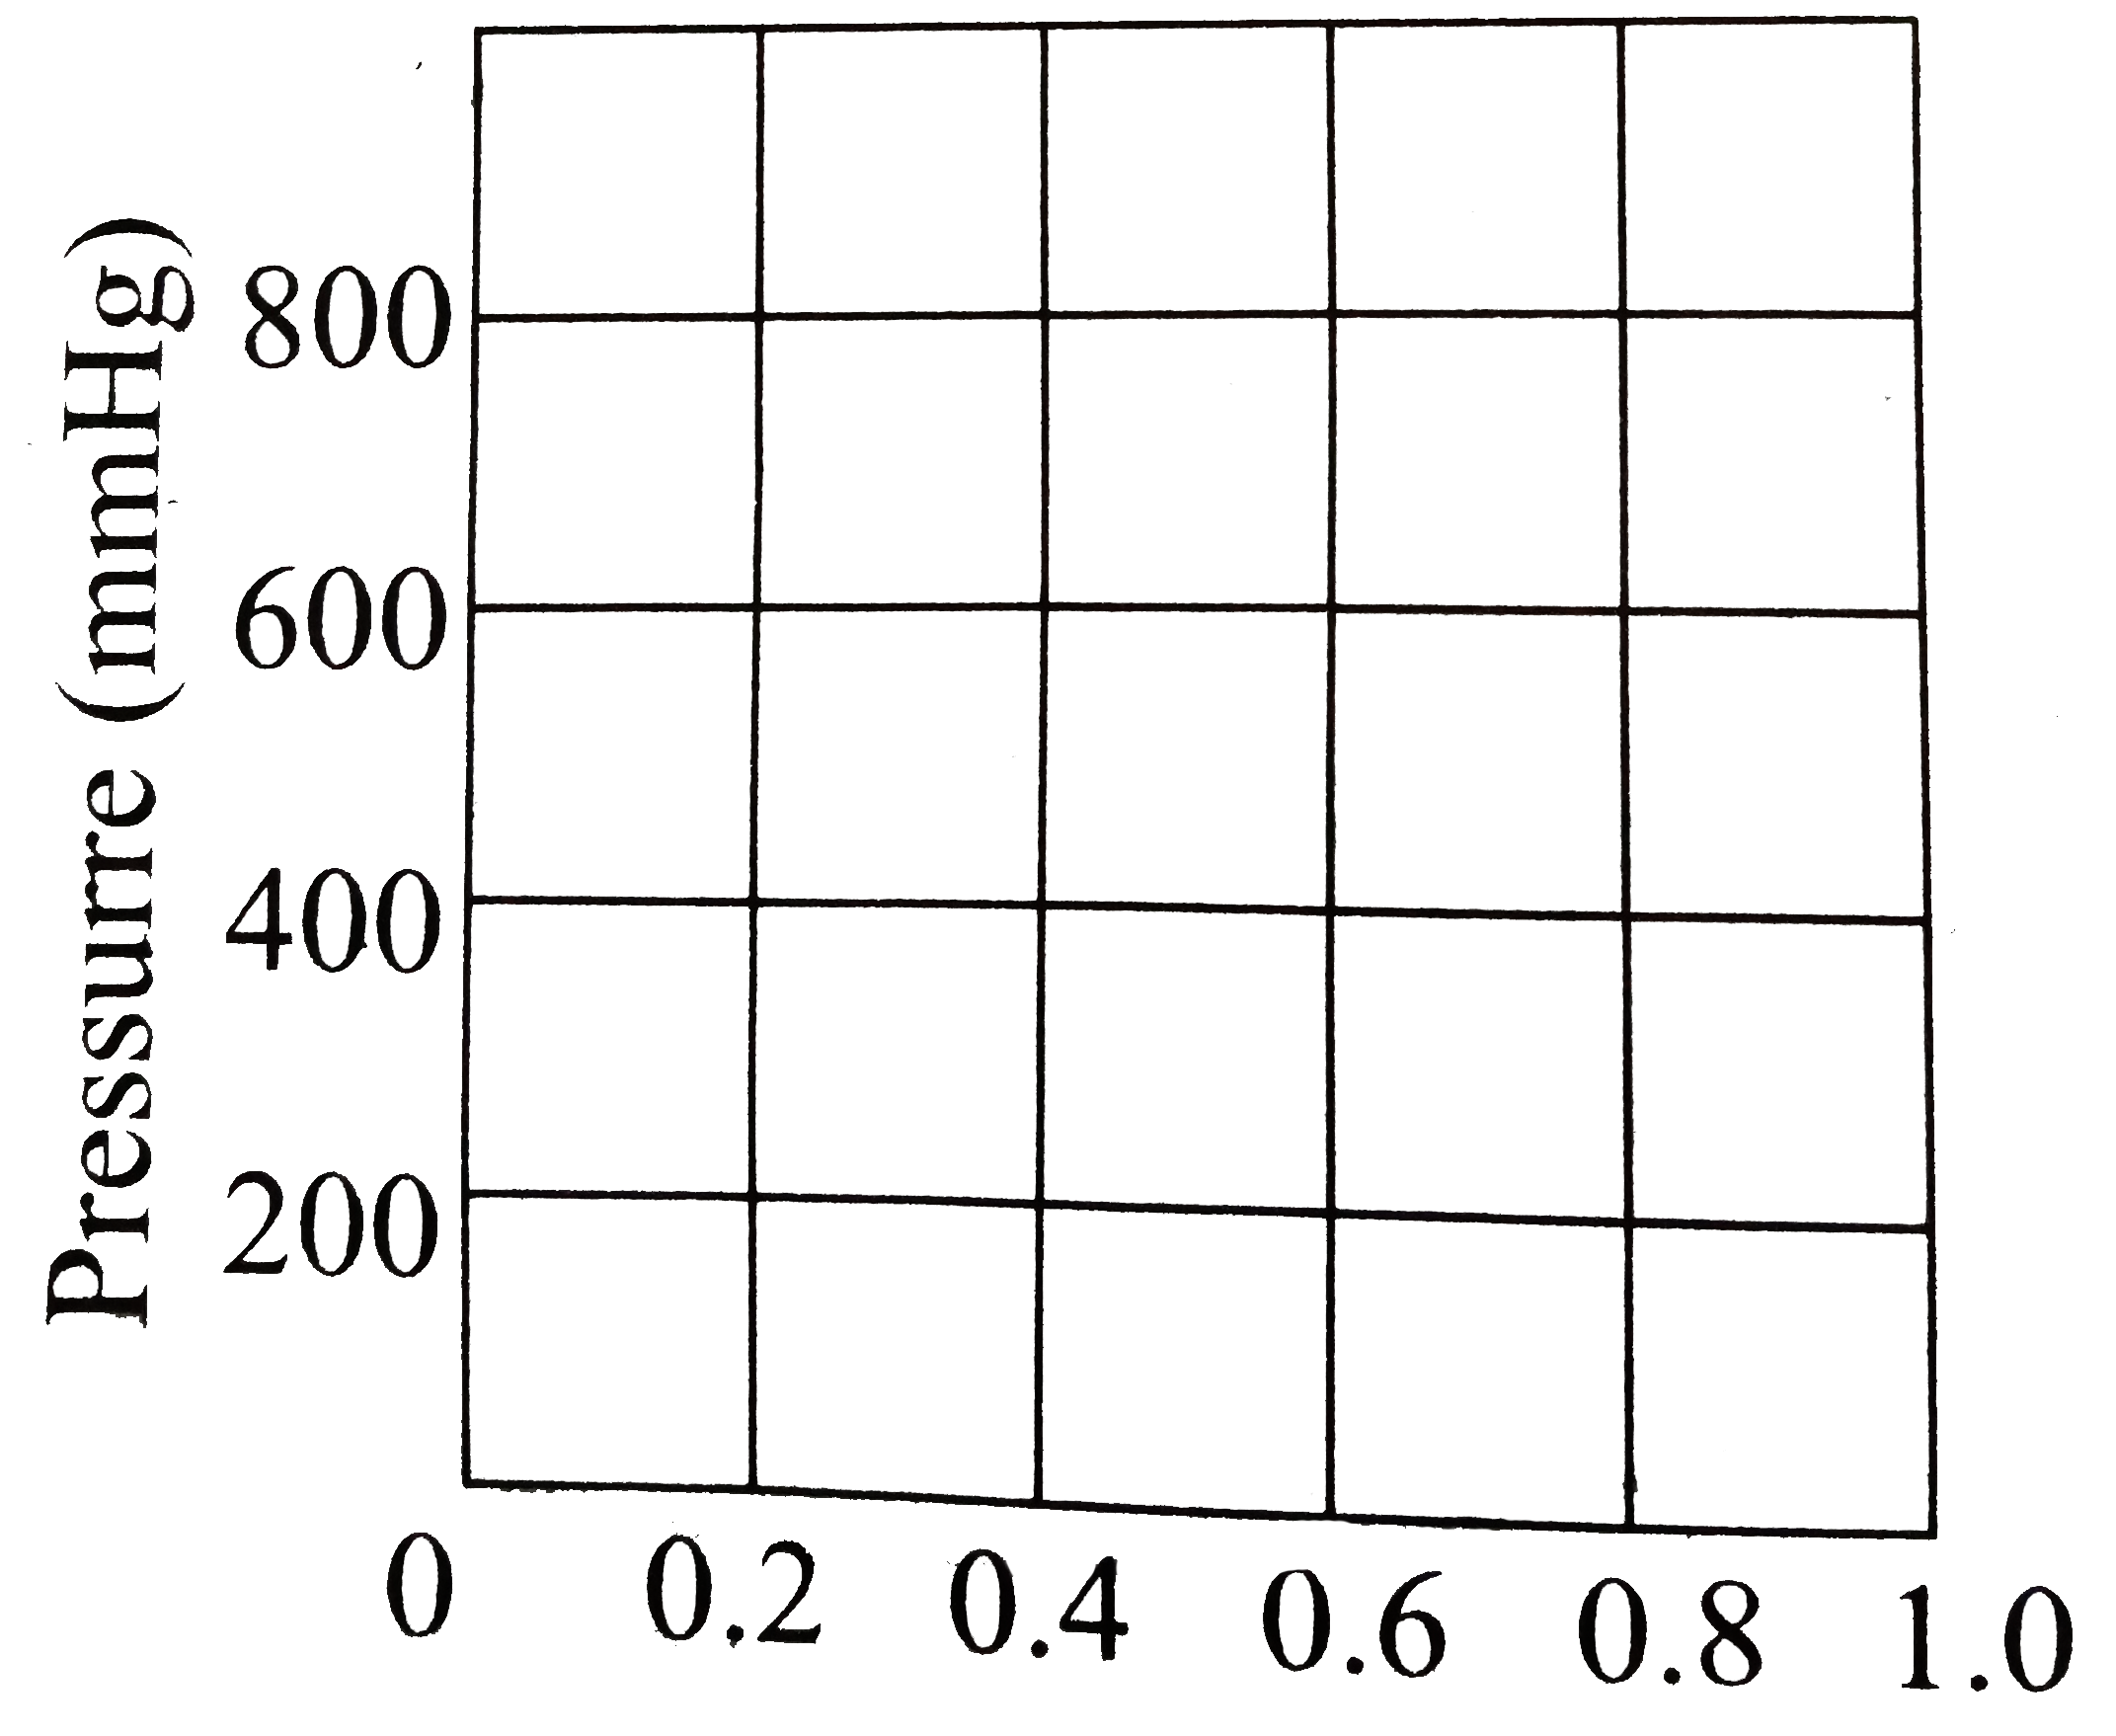
Given P−x curve for a non ideal liquid mixture (fig.) Identify the correct T−x curve for the same mixture.
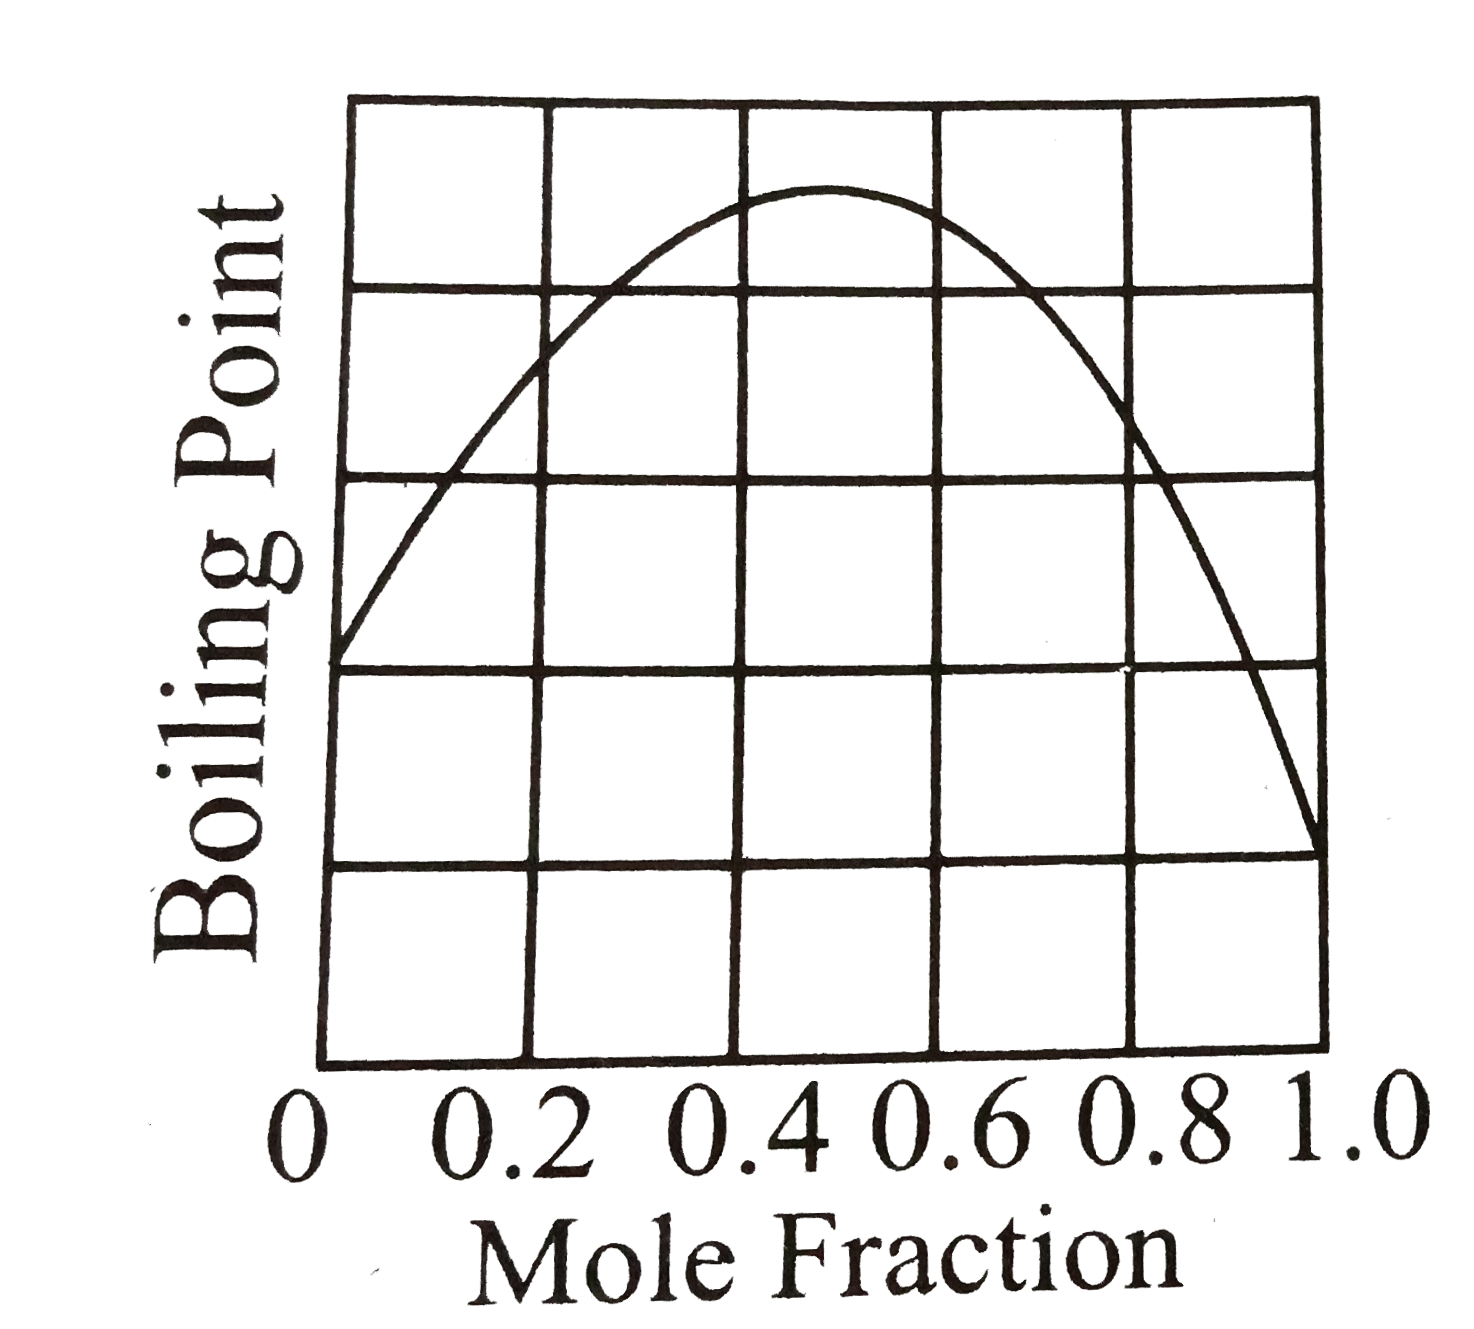
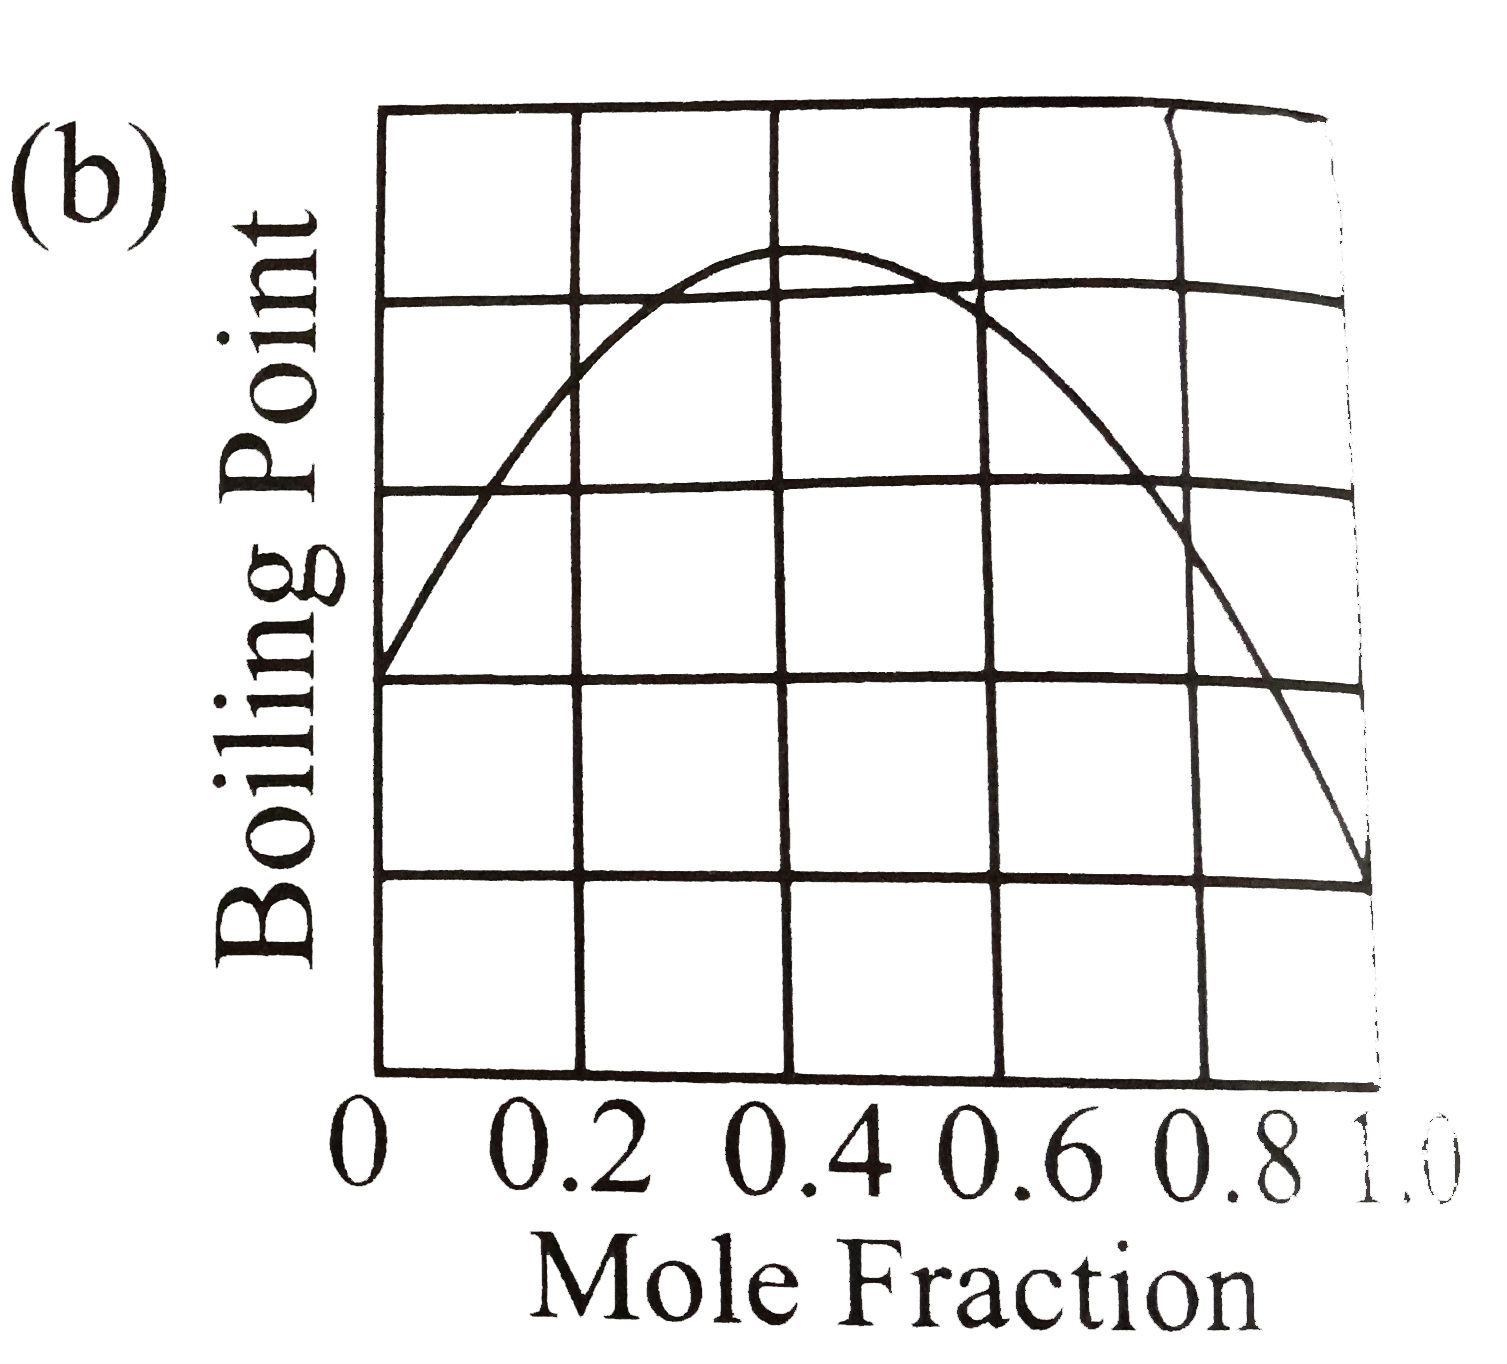
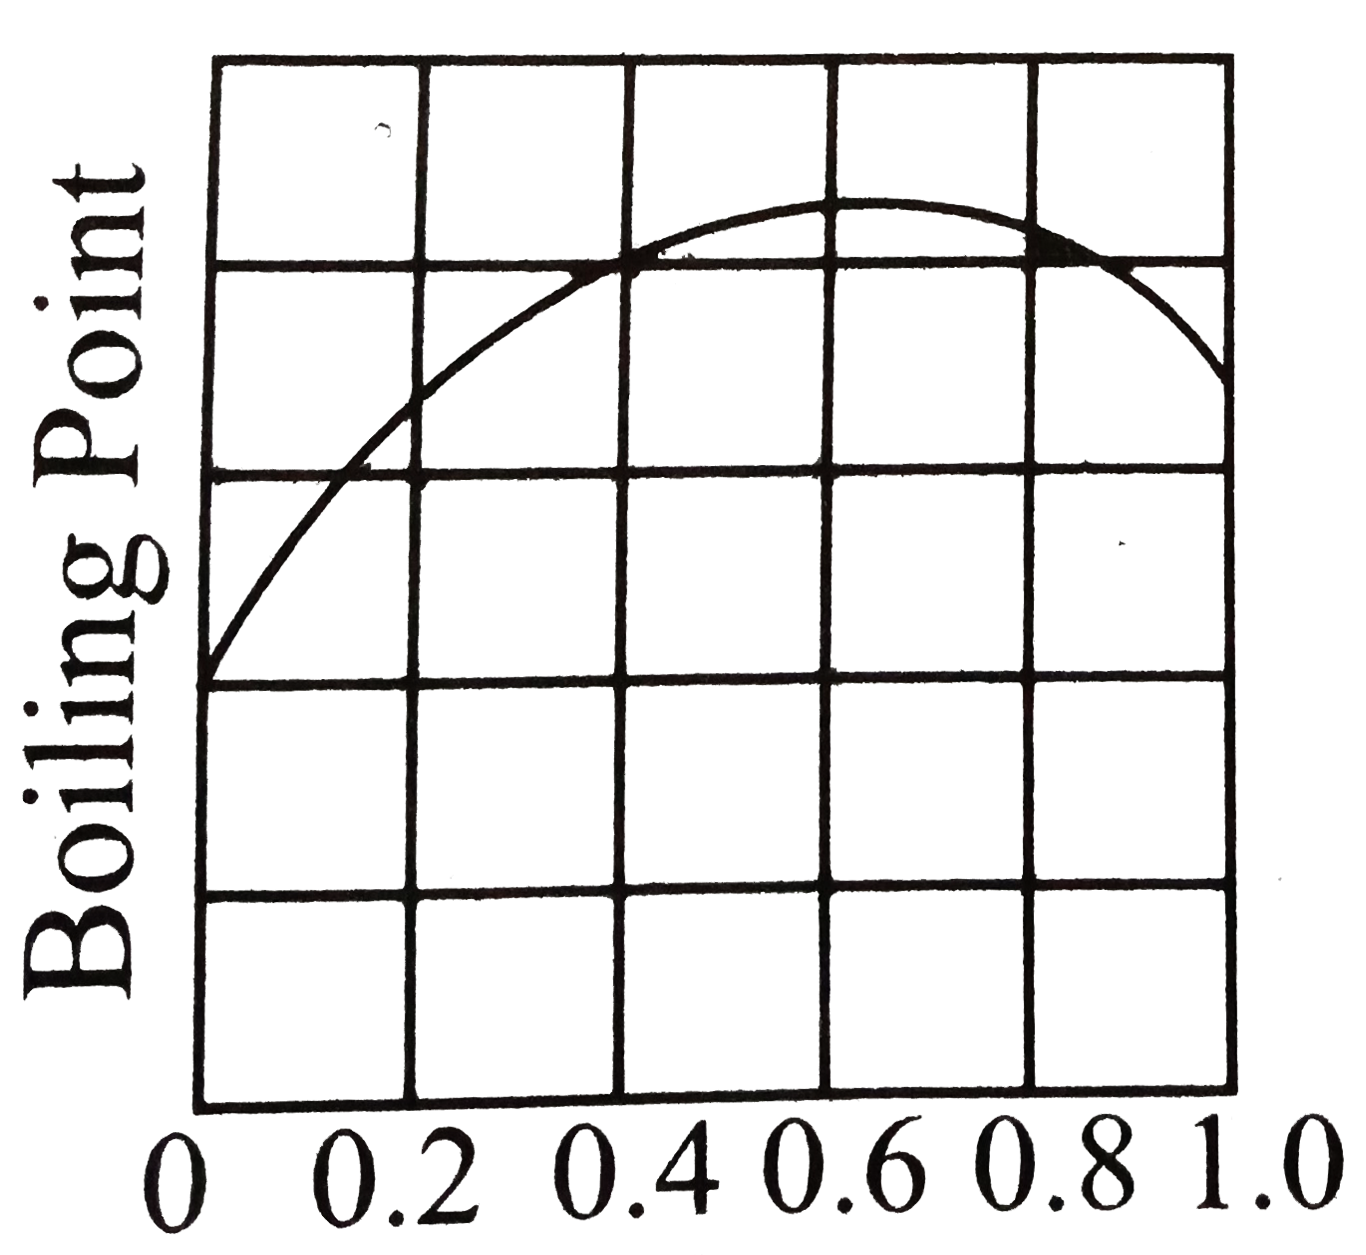
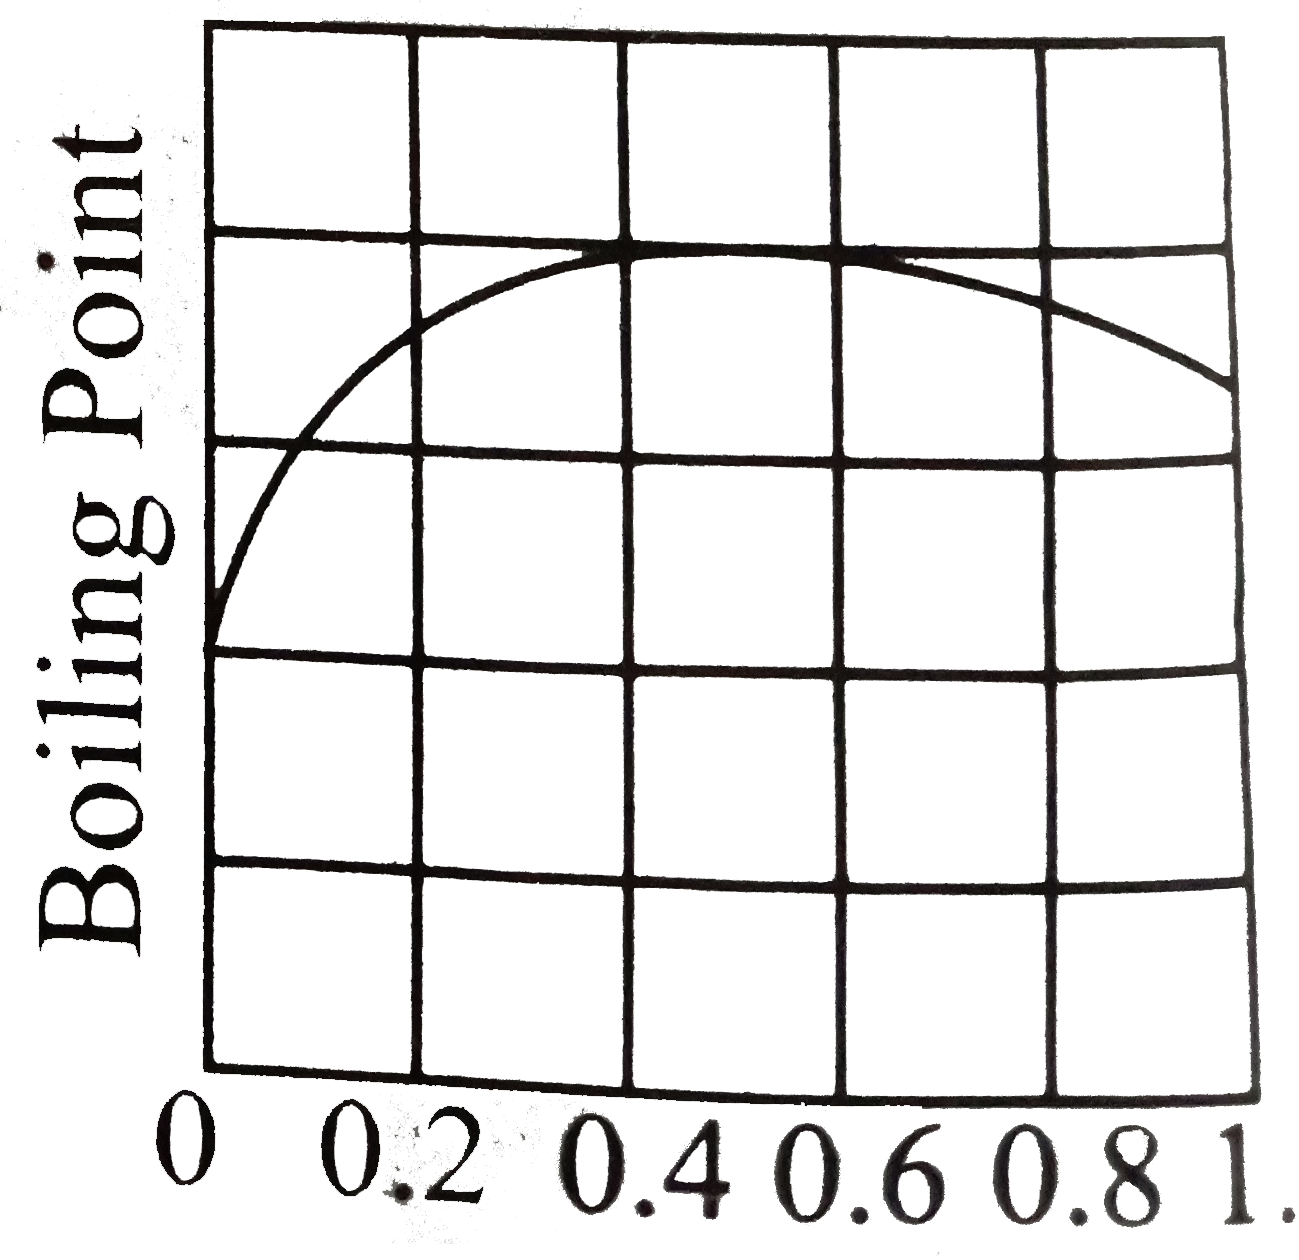
The correct Answer is:B
Topper's Solved these Questions
- SOLUTIONSBOOK - A2ZCHAPTER - SOLUTIONSEXERCISE - Relative Lowering Of Vapour Pressure
24 Videos
- SOLUTIONSBOOK - A2ZCHAPTER - SOLUTIONSEXERCISE - Elevation Of Boiling Point
21 Videos
- SOLUTIONSBOOK - A2ZCHAPTER - SOLUTIONSEXERCISE - Vapour Pressure And Henry'S Law
18 Videos
- SOLID STATEBOOK - A2ZCHAPTER - SOLID STATEEXERCISE - Section D - Chapter End Test
30 Videos
- SURFACE CHEMISTRYBOOK - A2ZCHAPTER - SURFACE CHEMISTRYEXERCISE - Section D - Chapter End Test
30 Videos
Similar Questions
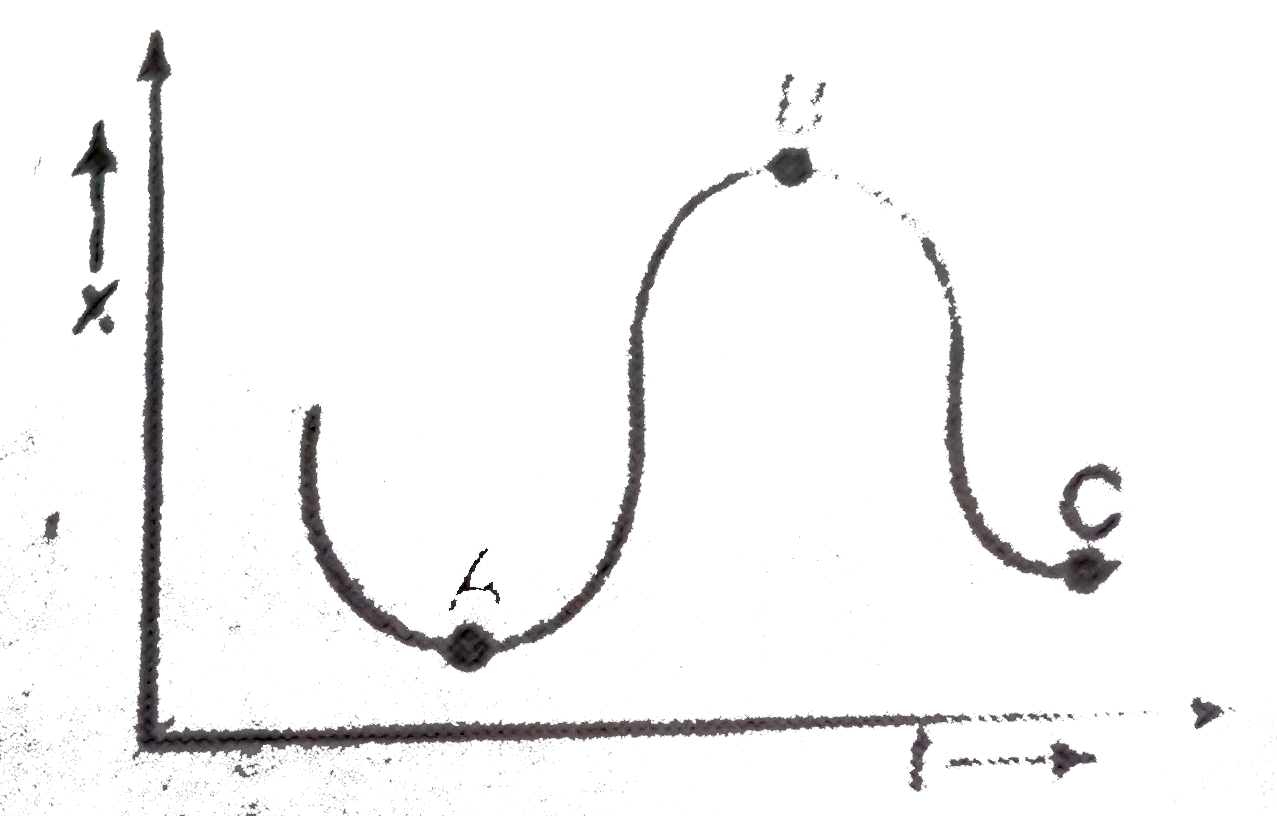
In the given x−t curve,
View SolutionCompreshension-II
In non-ideal solutions, at one of the intermediate compostions, the total vapour pressure is highest and the boiling point is lowest. At this point, the composition of the liquid and vapour phase is same. So, if liquid mixture vapouriese at this point and vapours are condensed, teh condensate contains same compositon as present in original liquid mixture. it means at this point liquid behaves like a pure liquid and is called an Azeotropic mixture.
Choose the correct answer :
View Solution
Knowledge Check
Two liquids A and B are mixed temperature T in a certain ratio to form an ideal solution. It is found that the partial pressure of A i.e., pA is equal to pB, the vapour pressure of B for the liquid mixture. What is the total vapour pressure of the liquid mixture in terms of p∘A and p∘B ?
Ap∘Ap∘Bp∘A+p∘BB2p∘Ap∘Bp∘A+p∘BCp∘Ap∘A+p∘BD2p∘Bp∘A+p∘BCompreshension-II
In non-ideal solutions, at one of the intermediate compostions, the total vapour pressure is highest and the boiling point is lowest. At this point, the composition of the liquid and vapour phase is same. So, if liquid mixture vapouriese at this point and vapours are condensed, teh condensate contains same compositon as present in original liquid mixture. it means at this point liquid behaves like a pure liquid and is called an Azeotropic mixture.
Choose the correct answer :AIdeal solutions cannot be separated into their components by fractional distillationBFor ideal solutions enthalpy of mixing is always greater than zeroCOnly non-ideal solution showing positive deviation cannot be separated out by fraction distillationDNon-ideal solution showing both positive and negative deviation cannot be separated out by fractional distillationWhen a sample of ideal gas is changed from an initial state to a final state, various curves can be plotted for the process like P-V curve, V-T curve,P-T curve etc.
For example, P-V curve for a fixed amount of an ideal gas at constant temperature is a rectangular hyperbola, V-T curve for a fixed amount of an ideal gas at constant volume is again a straight line. However, the shapes may vary if the constant parameters are also changed.
Now, answer the following questions :
From the given plot between Z and P for a real gas the correct is :
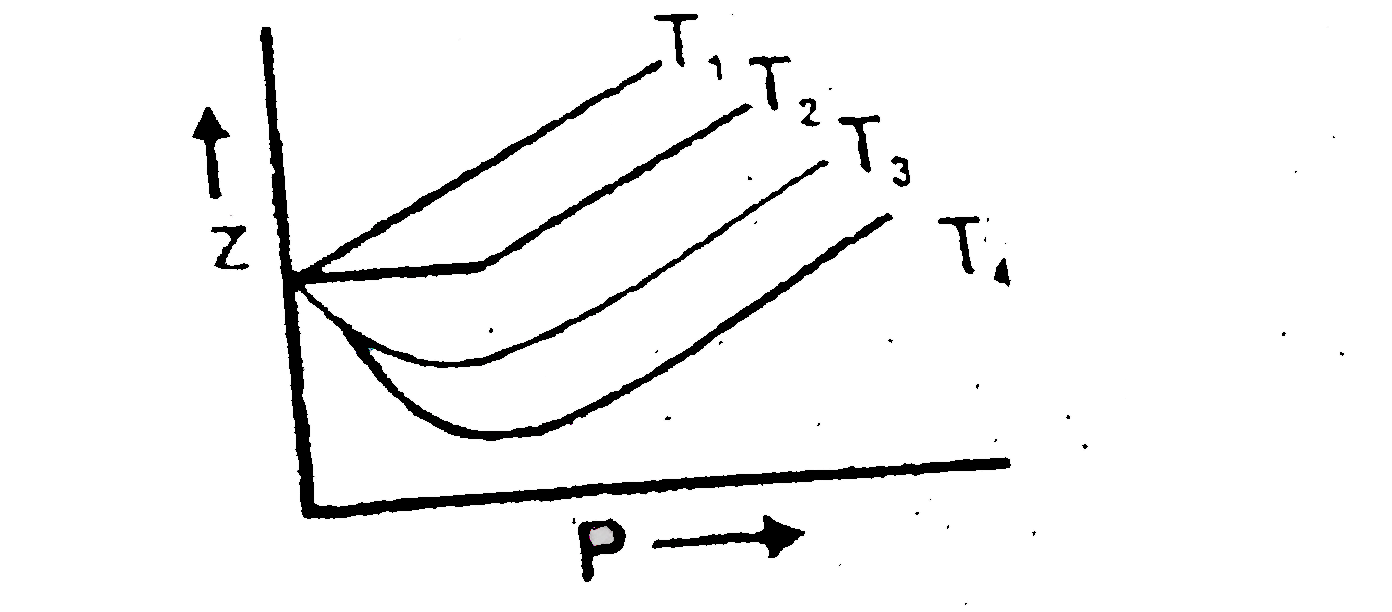 AT1=2aRbBT2=aRbCT3=aRbDT4=2aRb
When a sample of ideal gas is changed from an initial state to a final state, various curves can be plotted for the process like P-V curve, V-T curve,P-T curve etc.
For example, P-V curve for a fixed amount of an ideal gas at constant temperature is a rectangular hyperbola, V-T curve for a fixed amount of an ideal gas at constant volume is again a straight line. However, the shapes may vary if the constant parameters are also changed.
Now, answer the following questions :
From the given plot between Z and P for a real gas the correct is :

View SolutionWhen a sample of ideal gas is changed from an initial state to a final state, various curves can be plotted for the process like P-V curve, V-T curve,P-T curve etc.
For example, P-V curve for a fixed amount of an ideal gas at constant temperature is a rectangular hyperbola, V-T curve for a fixed amount of an ideal gas at constant volume is again a straight line. However, the shapes may vary if the constant parameters are also changed.
Now, answer the following questions :
Two Vander waals gases have same value 'b' but different 'a' value then which of the following statement is correct under simialr condition .
View SolutionWhen a sample of ideal gas is changed from an initial state to a final state, various curves can be plotted for the process like P-V curve, V-T curve,P-T curve etc.
For example, P-V curve for a fixed amount of an ideal gas at constant temperature is a rectangular hyperbola, V-T curve for a fixed amount of an ideal gas at constant volume is again a straight line. However, the shapes may vary if the constant parameters are also changed.
Now, answer the following questions :
Two vander waals gases have same value of 'a' but different value of b which of the following statement is correct
View SolutionWhen a sample of ideal gas is changed from an initial state to a final state, various curves can be plotted for the process like P-V curve, V-T curve,P-T curve etc.
For example, P-V curve for a fixed amount of an ideal gas at constant temperature is a rectangular hyperbola, V-T curve for a fixed amount of an ideal gas at constant volume is again a straight line. However, the shapes may vary if the constant parameters are also changed.
Now, answer the following questions :
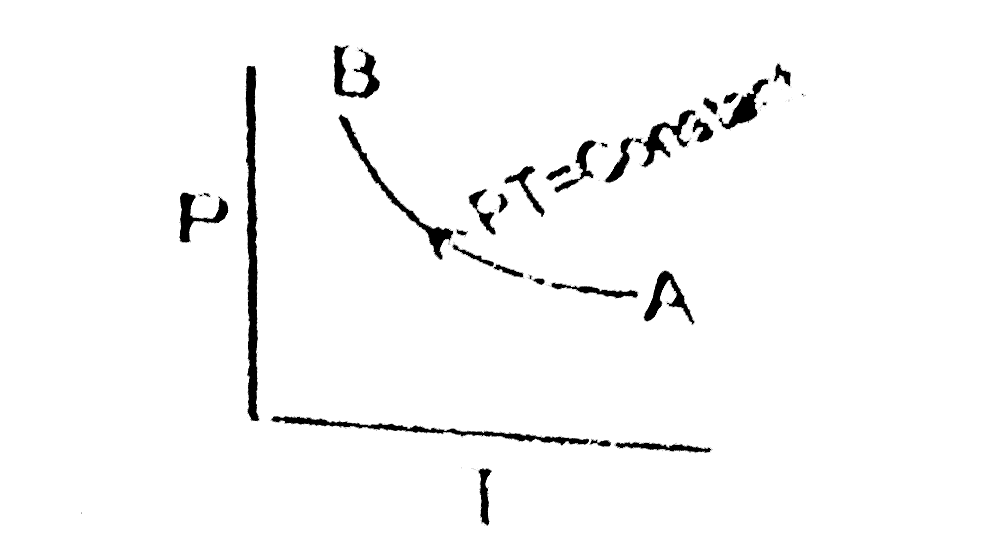
Which of the following statements is correct regarding a fixed amount of ideal gas undergoing the following process :
View Solution
