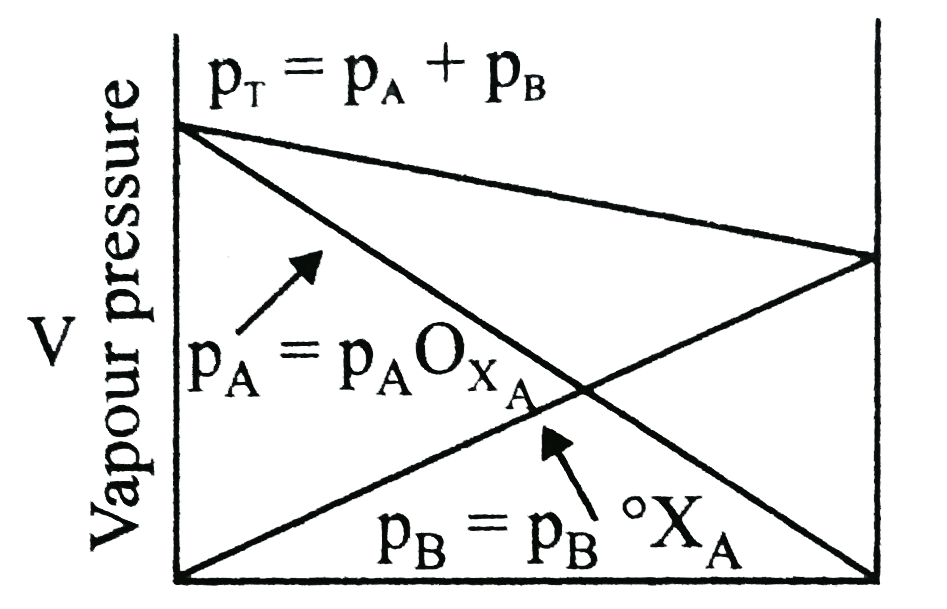
Which of the following plots does not represent the behaviour of an ideal binary liquid solutions?
A
plot of pA versus xA(mole fraction of A in liquid phase) is linear
B
plot of pB versus xB is linear
C
Plot of ptotal versus is (orxB) linear
D
Plot of ptotal versus xA is non-linear
Text Solution
The correct Answer is:D

XA=1XA=0XB=0XB=1
SoPT andXAis non-linear.
|
Topper's Solved these Questions
- SOLUTIONSBOOK - A2ZCHAPTER - SOLUTIONSEXERCISE - Relative Lowering Of Vapour Pressure
24 Videos
- SOLUTIONSBOOK - A2ZCHAPTER - SOLUTIONSEXERCISE - Elevation Of Boiling Point
21 Videos
- SOLUTIONSBOOK - A2ZCHAPTER - SOLUTIONSEXERCISE - Vapour Pressure And Henry'S Law
18 Videos
- SOLID STATEBOOK - A2ZCHAPTER - SOLID STATEEXERCISE - Section D - Chapter End Test
30 Videos
- SURFACE CHEMISTRYBOOK - A2ZCHAPTER - SURFACE CHEMISTRYEXERCISE - Section D - Chapter End Test
30 Videos
Similar Questions
Knowledge Check
Which of the following plots does not represent the behaviour of an ideal binary liquid solution of A and B?
APlot of PB versus XB is linear.BPlot of PA versus XA is linear.CPlot of PTotal Versus XAorXB is linear.DPlot of PTotal versus XA is non-linear.Which of the following plots represents the behavior of an ideal binary liquid solution ?
APlot of PtotalvsYA (mol-fraction of A in vapour phase) is linearBplote of PtotalvsYB is linearCPlote of 1/PtotalvsYA is linearDPlote of 1/PtotalvsYB is non-linearWhich of the following plots represents the behavior of an ideal binary liquid solution ?
APlot of PtotalvsyA (mole fraction of A in vapour) is linearBPlot ofPtotalvsyB is linearCplot of 1/PtotalvsyA is linearDPlot of 1/PtotalvsyB is non linear.
Which of the following plots does not represent Boyle's law?
View SolutionWhich of the following graphs represent the behaviour of an ideal gas ?
View SolutionWhich of the following graphs represent the behaviour of an ideal gas ?
View SolutionFor an ideal binary liquid system:
View SolutionWhich of the following does not represent ideal gas equation?
View Solution
