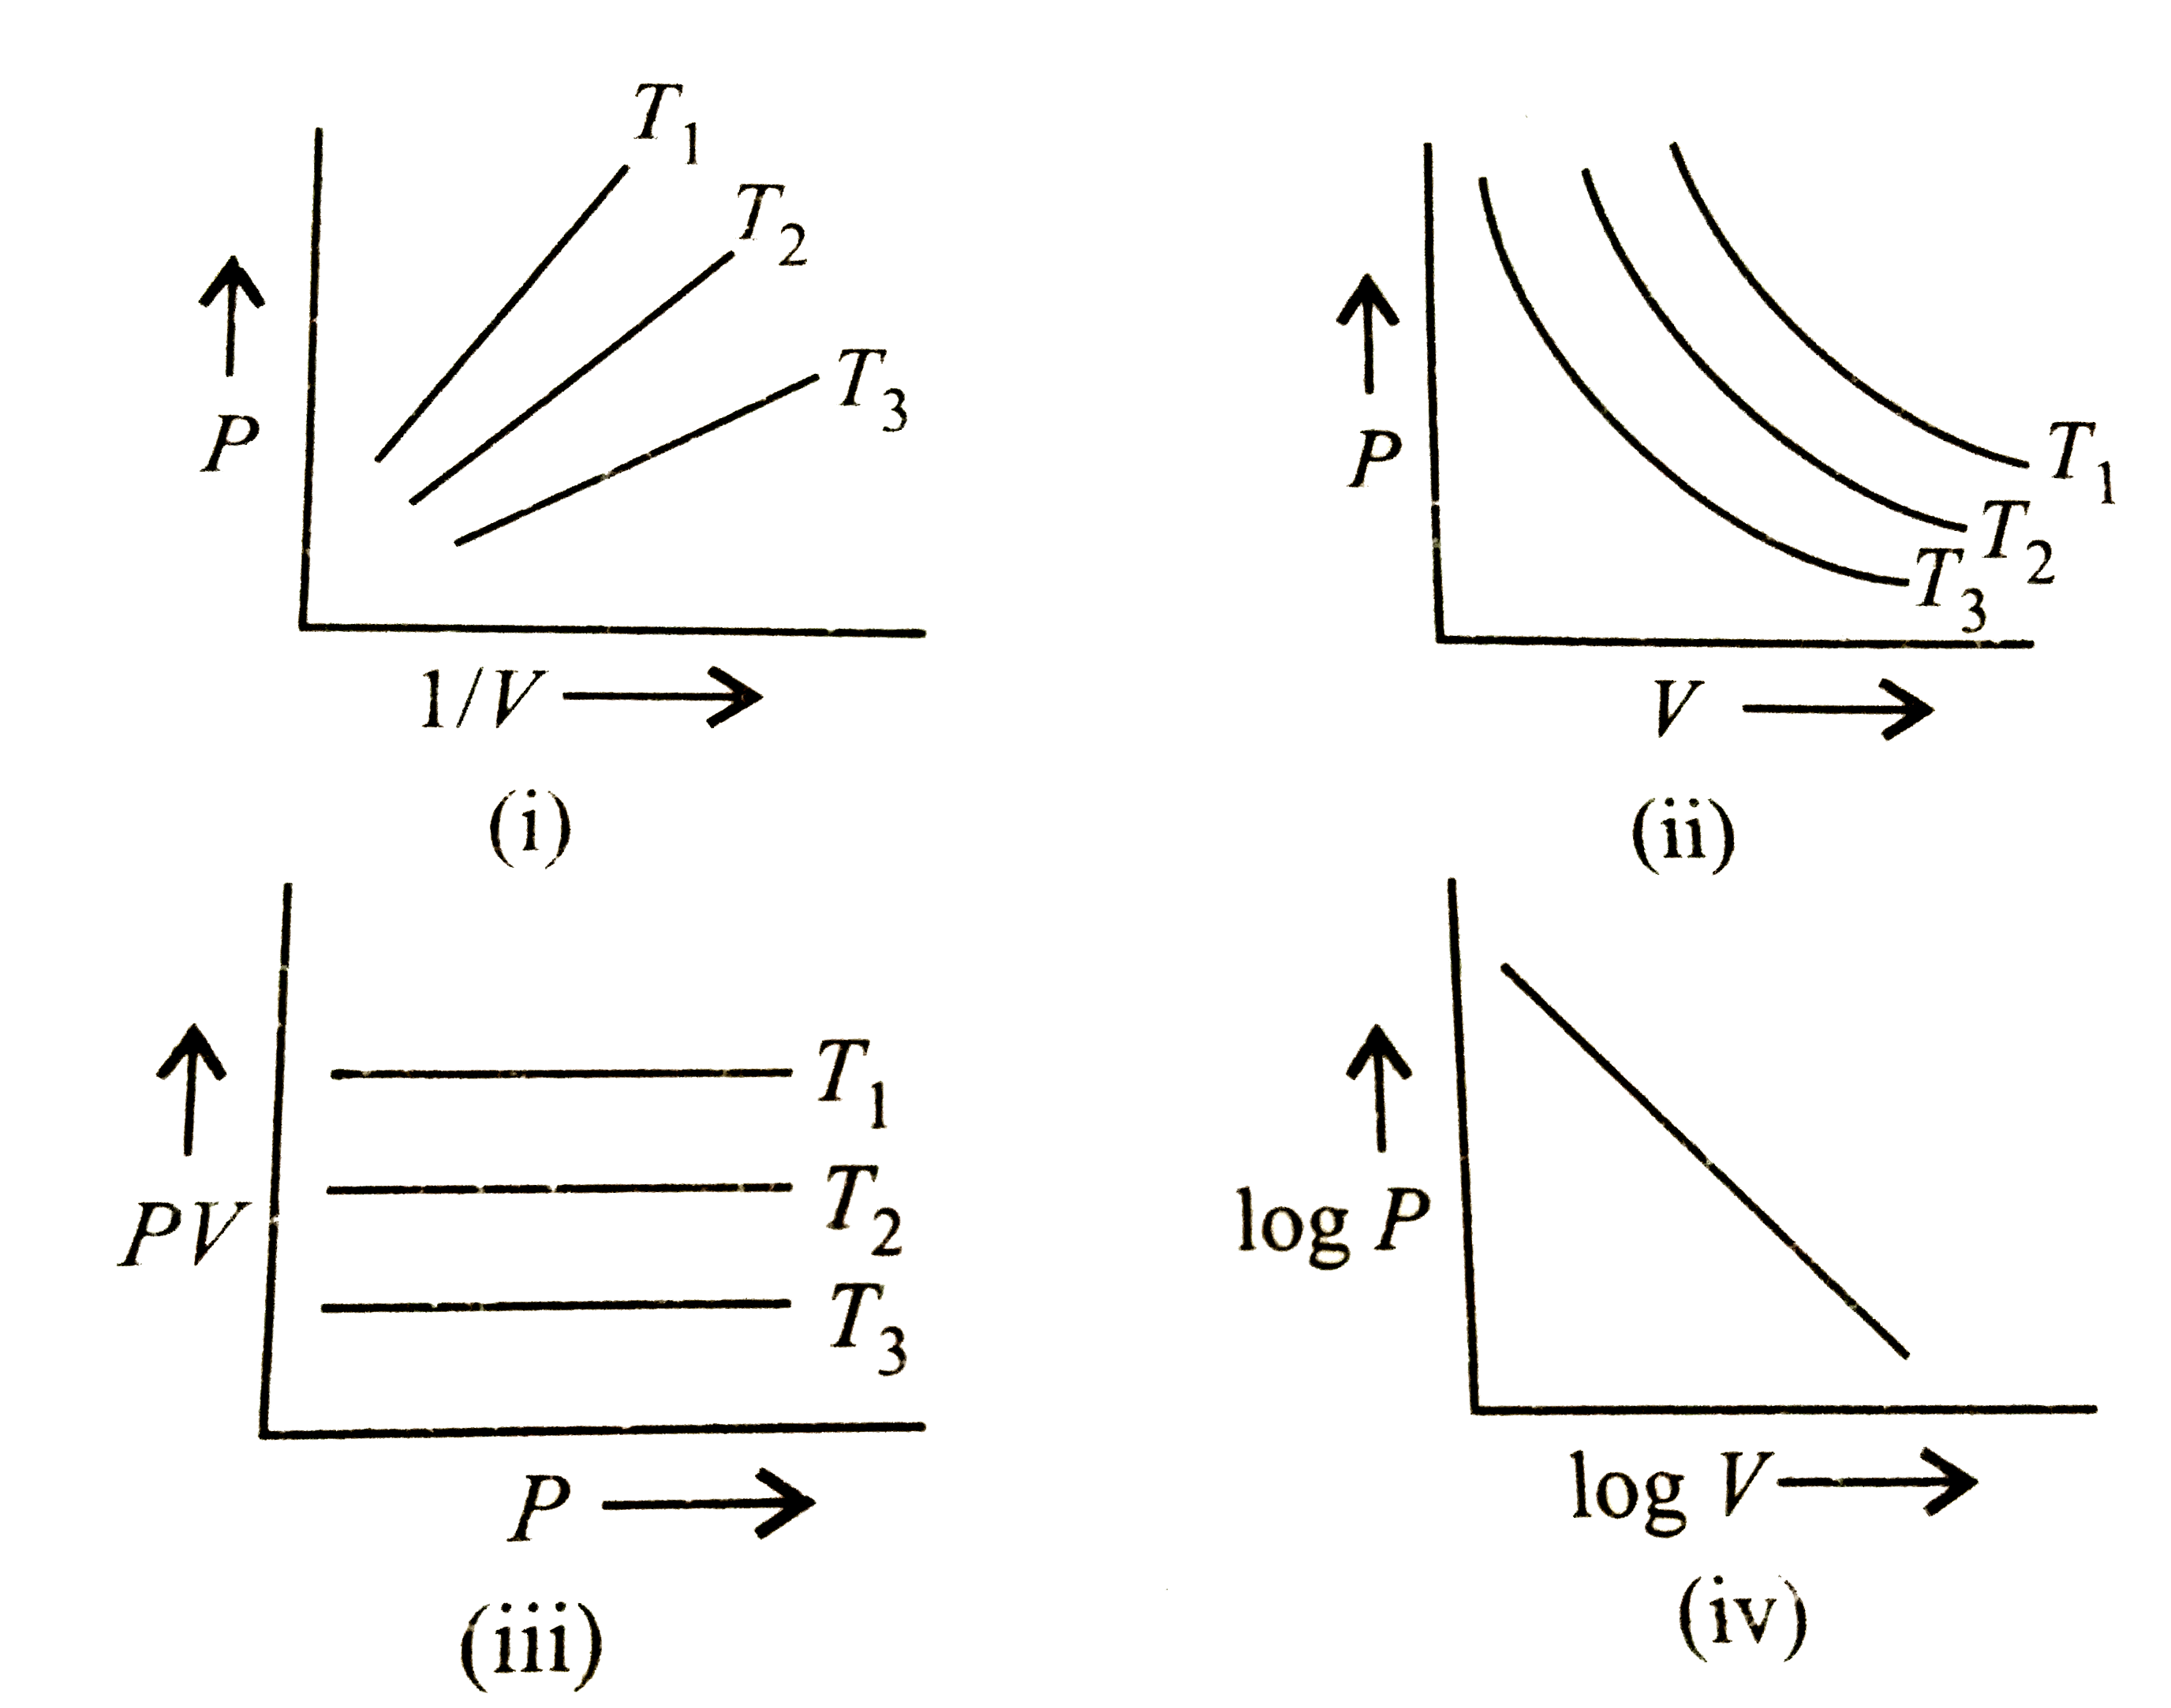
Which of the following plots does not represent Boyle's law?
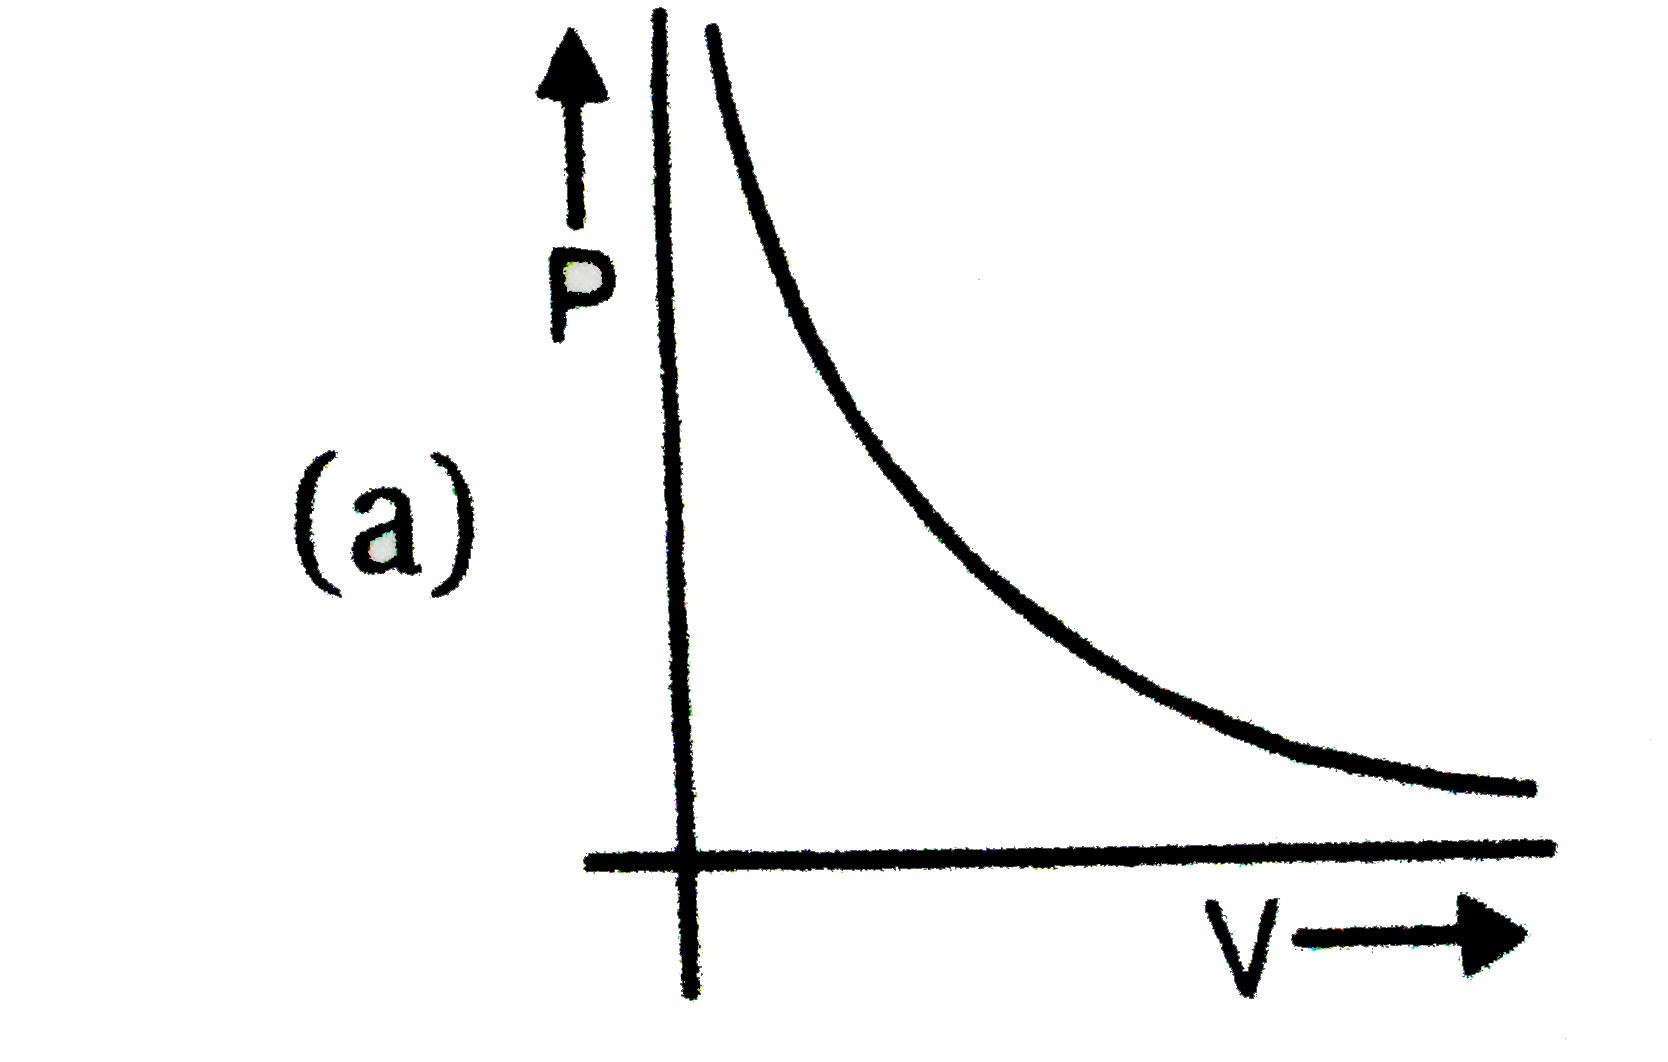
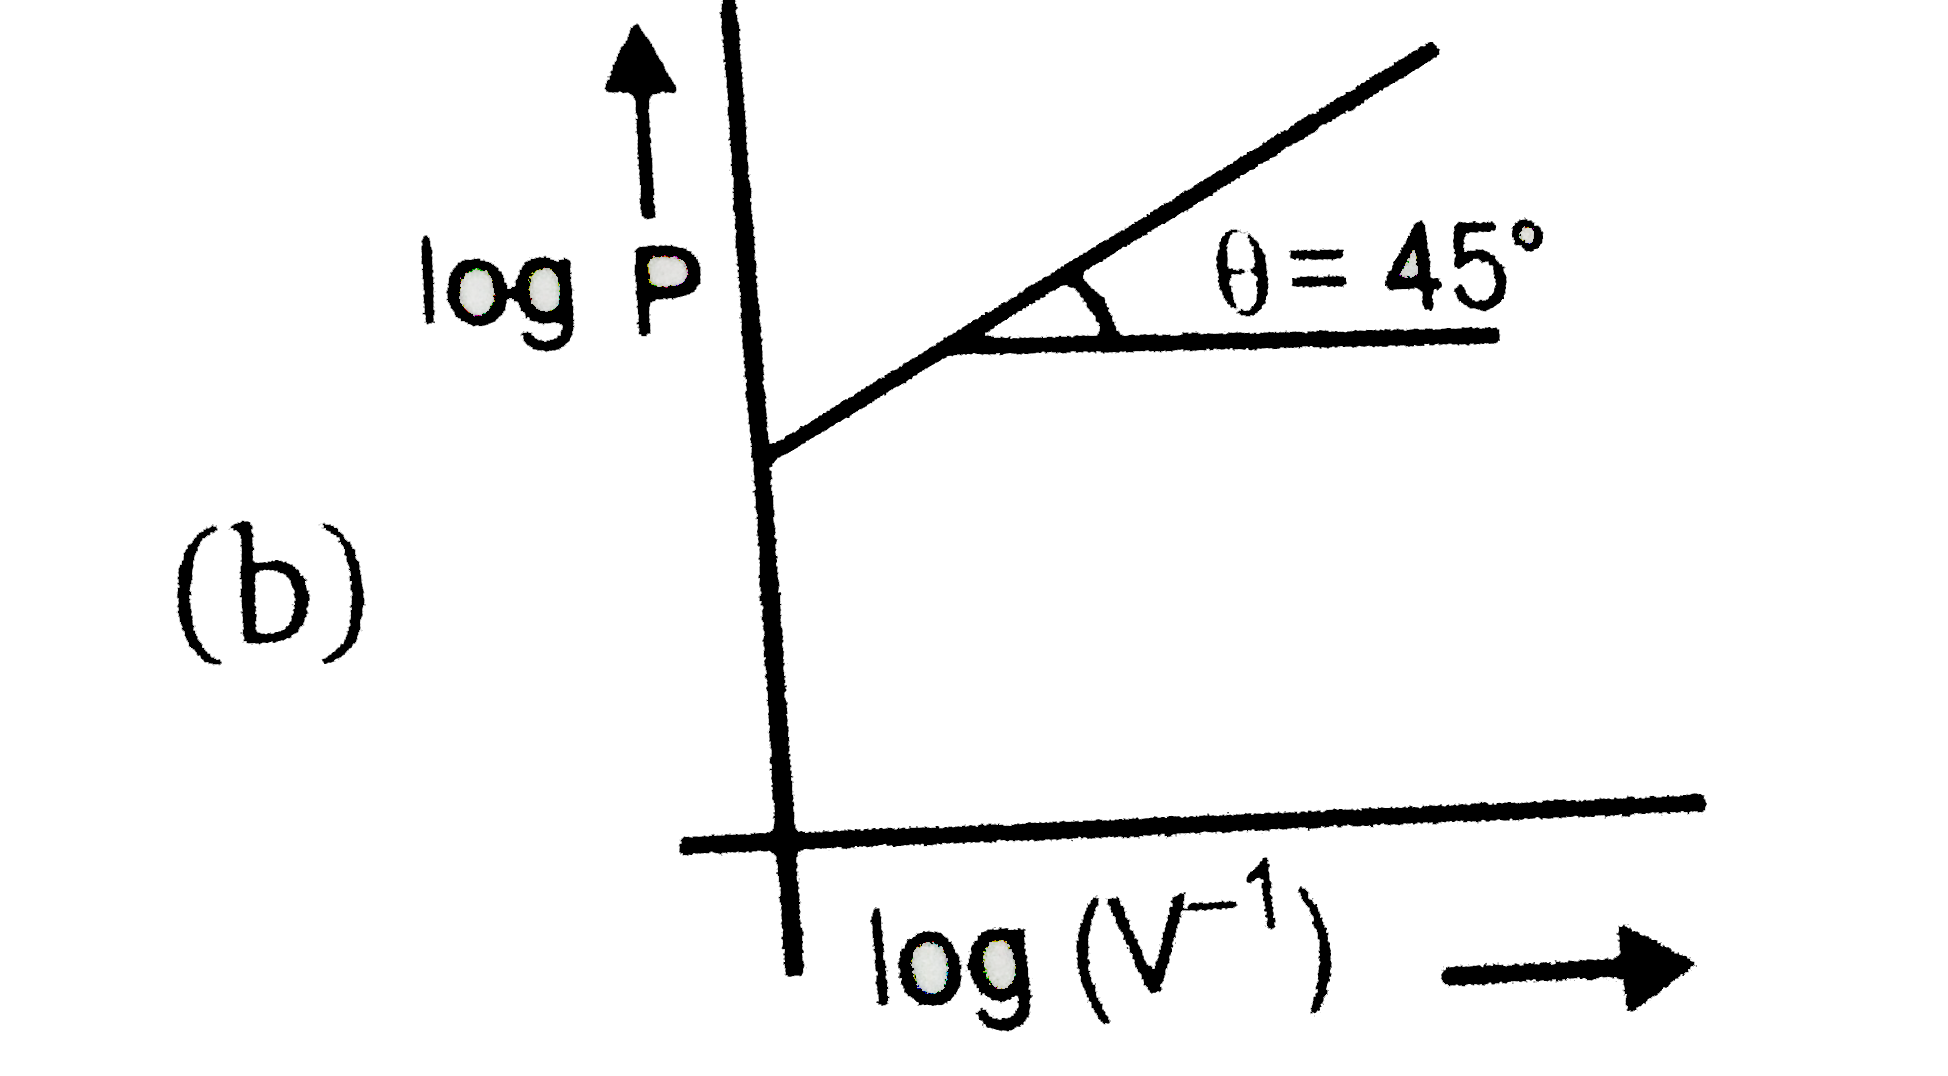
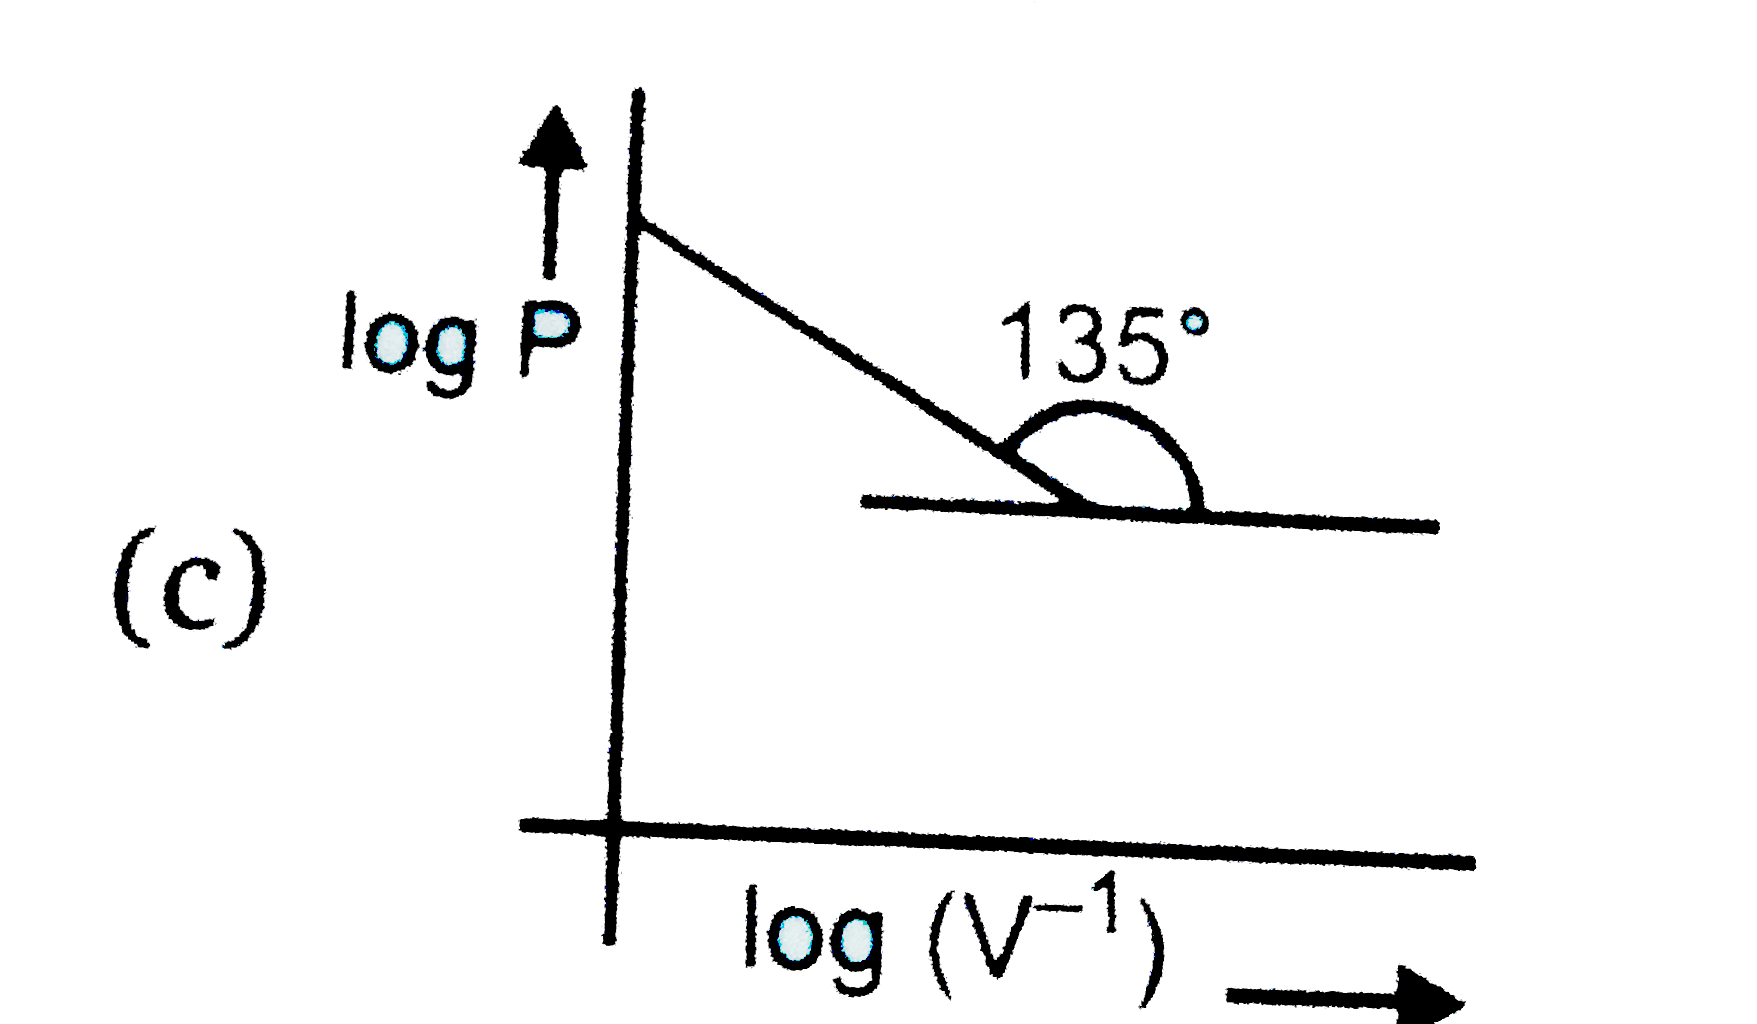
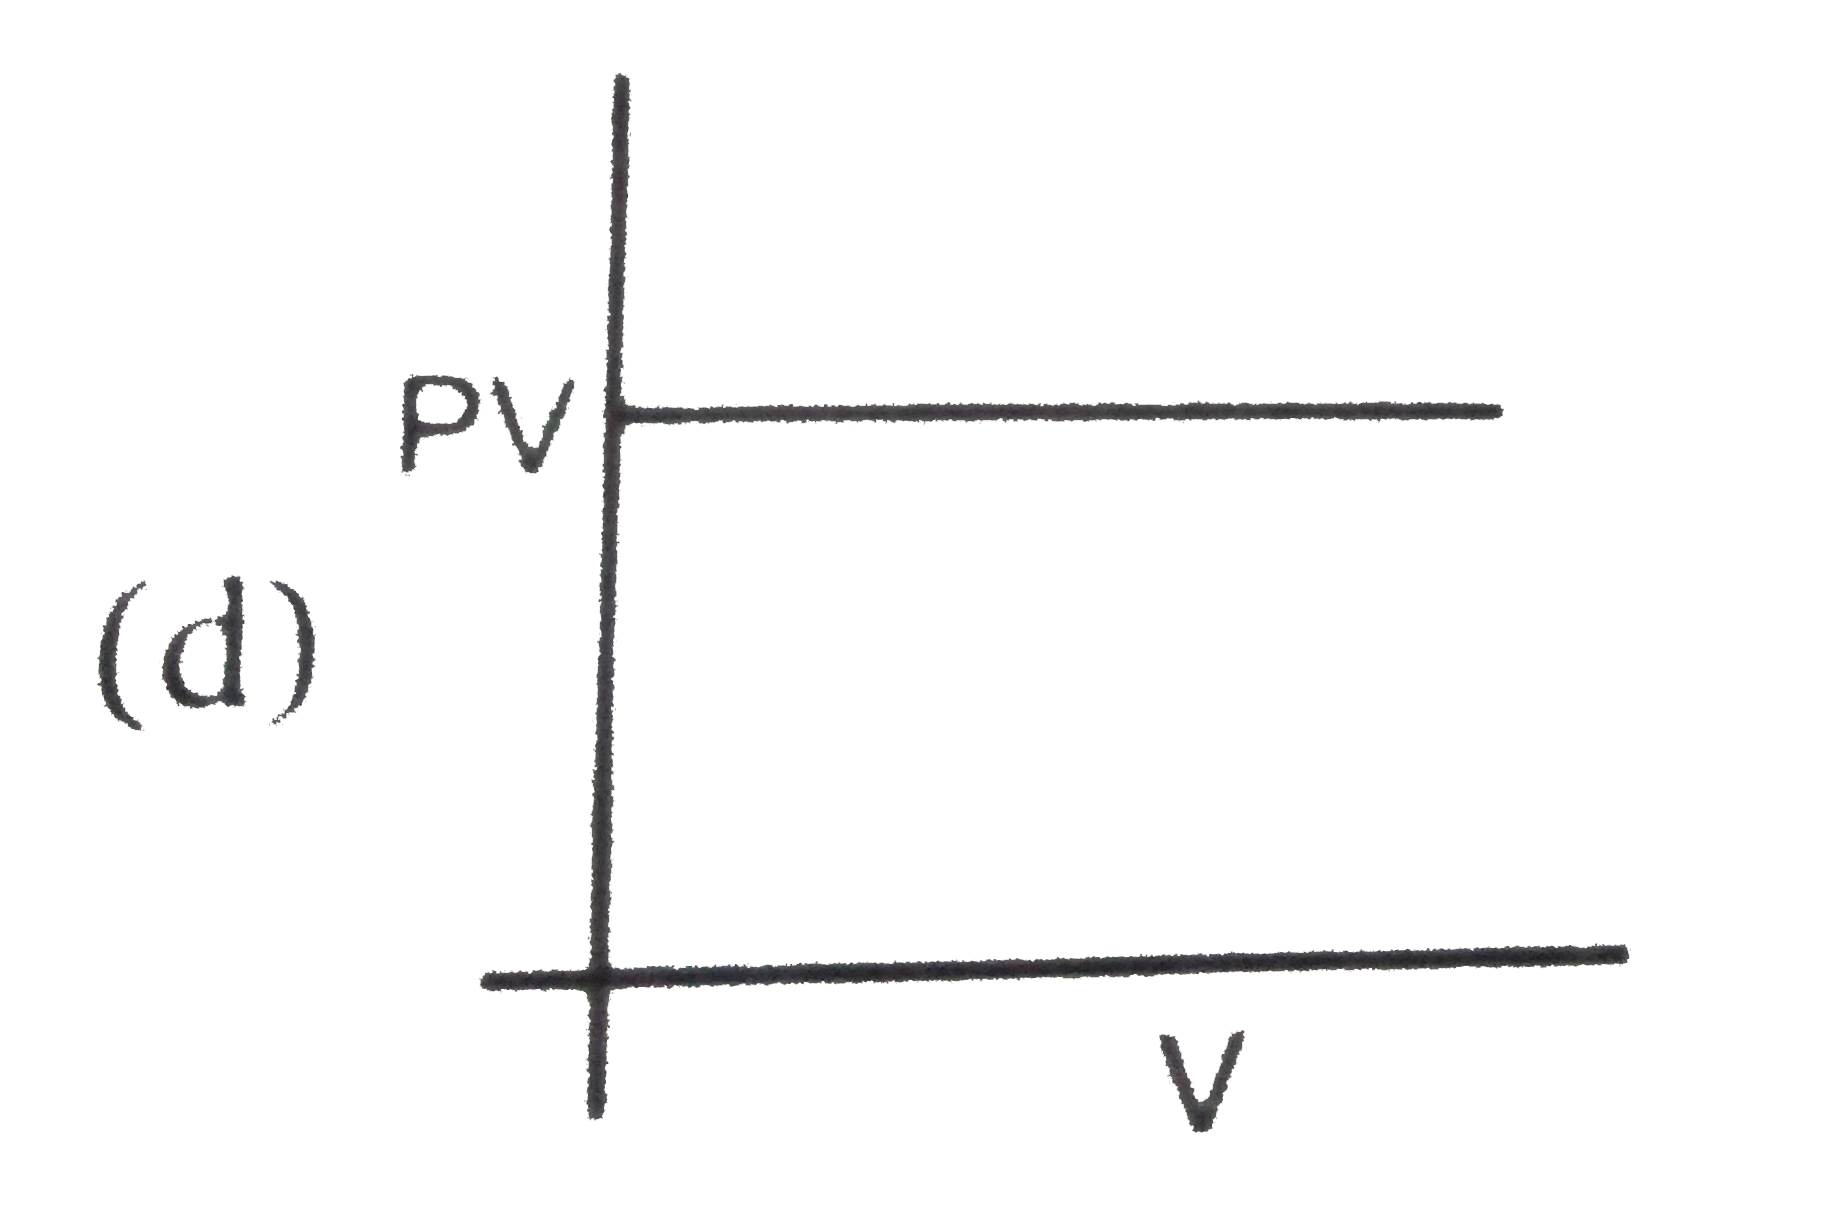
The correct Answer is:c
To determine which plot does not represent Boyle's Law, we need to understand the relationship described by Boyle's Law itself. Boyle's Law states that for a fixed amount of gas at constant temperature, the pressure (P) of the gas is inversely proportional to its volume (V). This can be mathematically expressed as:
PV=k
where k is a constant.
1. Understand Boyle's Law:
- Boyle's Law states that P∝1V at constant temperature and for a fixed amount of gas.
- This means that as the volume increases, the pressure decreases, and vice versa.
2. Identify the Graphs:
- We need to analyze the given plots (let's assume we have options A, B, C, and D).
- The correct representation of Boyle's Law should show a hyperbolic curve when plotting pressure (P) against volume (V).
3. Check Each Plot:
- Plot A: If this plot shows a hyperbolic curve, it represents Boyle's Law correctly.
- Plot B: If this plot shows a linear relationship (straight line) between P and V, it does not represent Boyle's Law.
- Plot C: If this plot shows a log-log plot of P versus 1V, it can still represent Boyle's Law since it can be derived from the equation.
- Plot D: If this plot shows a relationship that does not fit the inverse proportionality (e.g., a positive slope), it does not represent Boyle's Law.
4. Determine the Incorrect Plot:
- After analyzing the plots, if Plot B shows a linear relationship, it is the one that does not represent Boyle's Law.
- If Plot D also shows a positive slope, it would also be incorrect.
5. Conclusion:
- The plot that does not represent Boyle's Law is the one that shows a linear relationship or any other relationship that contradicts the inverse relationship between pressure and volume.
Final Answer:
- The plot that does not represent Boyle's Law is Plot B (or Plot D if applicable).
- Boyle's Law states that P∝1V at constant temperature and for a fixed amount of gas.
- This means that as the volume increases, the pressure decreases, and vice versa.
- We need to analyze the given plots (let's assume we have options A, B, C, and D).
- The correct representation of Boyle's Law should show a hyperbolic curve when plotting pressure (P) against volume (V).
- Plot A: If this plot shows a hyperbolic curve, it represents Boyle's Law correctly.
- Plot B: If this plot shows a linear relationship (straight line) between P and V, it does not represent Boyle's Law.
- Plot C: If this plot shows a log-log plot of P versus 1V, it can still represent Boyle's Law since it can be derived from the equation.
- Plot D: If this plot shows a relationship that does not fit the inverse proportionality (e.g., a positive slope), it does not represent Boyle's Law.
- After analyzing the plots, if Plot B shows a linear relationship, it is the one that does not represent Boyle's Law.
- If Plot D also shows a positive slope, it would also be incorrect.
- The plot that does not represent Boyle's Law is the one that shows a linear relationship or any other relationship that contradicts the inverse relationship between pressure and volume.
- The plot that does not represent Boyle's Law is Plot B (or Plot D if applicable).
Topper's Solved these Questions
- GASEOUS STATEBOOK - NARENDRA AWASTHI ENGLISHCHAPTER - GASEOUS STATEEXERCISE - Level 2
30 Videos
- GASEOUS STATEBOOK - NARENDRA AWASTHI ENGLISHCHAPTER - GASEOUS STATEEXERCISE - Level 3 Passage 1
4 Videos
- ELECTROCHEMISTRYBOOK - NARENDRA AWASTHI ENGLISHCHAPTER - ELECTROCHEMISTRYEXERCISE - Subjective problems
14 Videos
- IONIC EEQUILIBRIUMBOOK - NARENDRA AWASTHI ENGLISHCHAPTER - IONIC EEQUILIBRIUMEXERCISE - Subjective problems
1 Videos
Similar Questions
Knowledge Check
Which of the following pairs does not represent resonance structures?
ACH3C≡⊕N−өOandCH3−⊕C=N−өOB CCH2=⊕N=өNandөCH2−⊕N≡ND
Which of the following does not represent polymerisation of alkenes and alkynes?
AnCH≡Ch→(−−CH=CH−CH=CH−−)nB CnCH3−CH=CH2→(−−CH−CH2−−)∣CH3nDnCH2=CH2→(−−CH2−CH=CH−CH2−−)n
Which of the following group does not represent monocot
View SolutionWhich of the following pair does not represent greenhouse gases ?
View SolutionWhich of the following pair does not represent greenhouse gases?
View SolutionWhich curve does not represent Boyl's law ?
View SolutionWhich of the following curves represent(s) Boyle's law?
View SolutionWhich of the following examples does not represent disproportionation ?
View Solution

