Consider the given figure showing the formation of H+2 ion depending on intermuclear distance versus potential energy of the system.
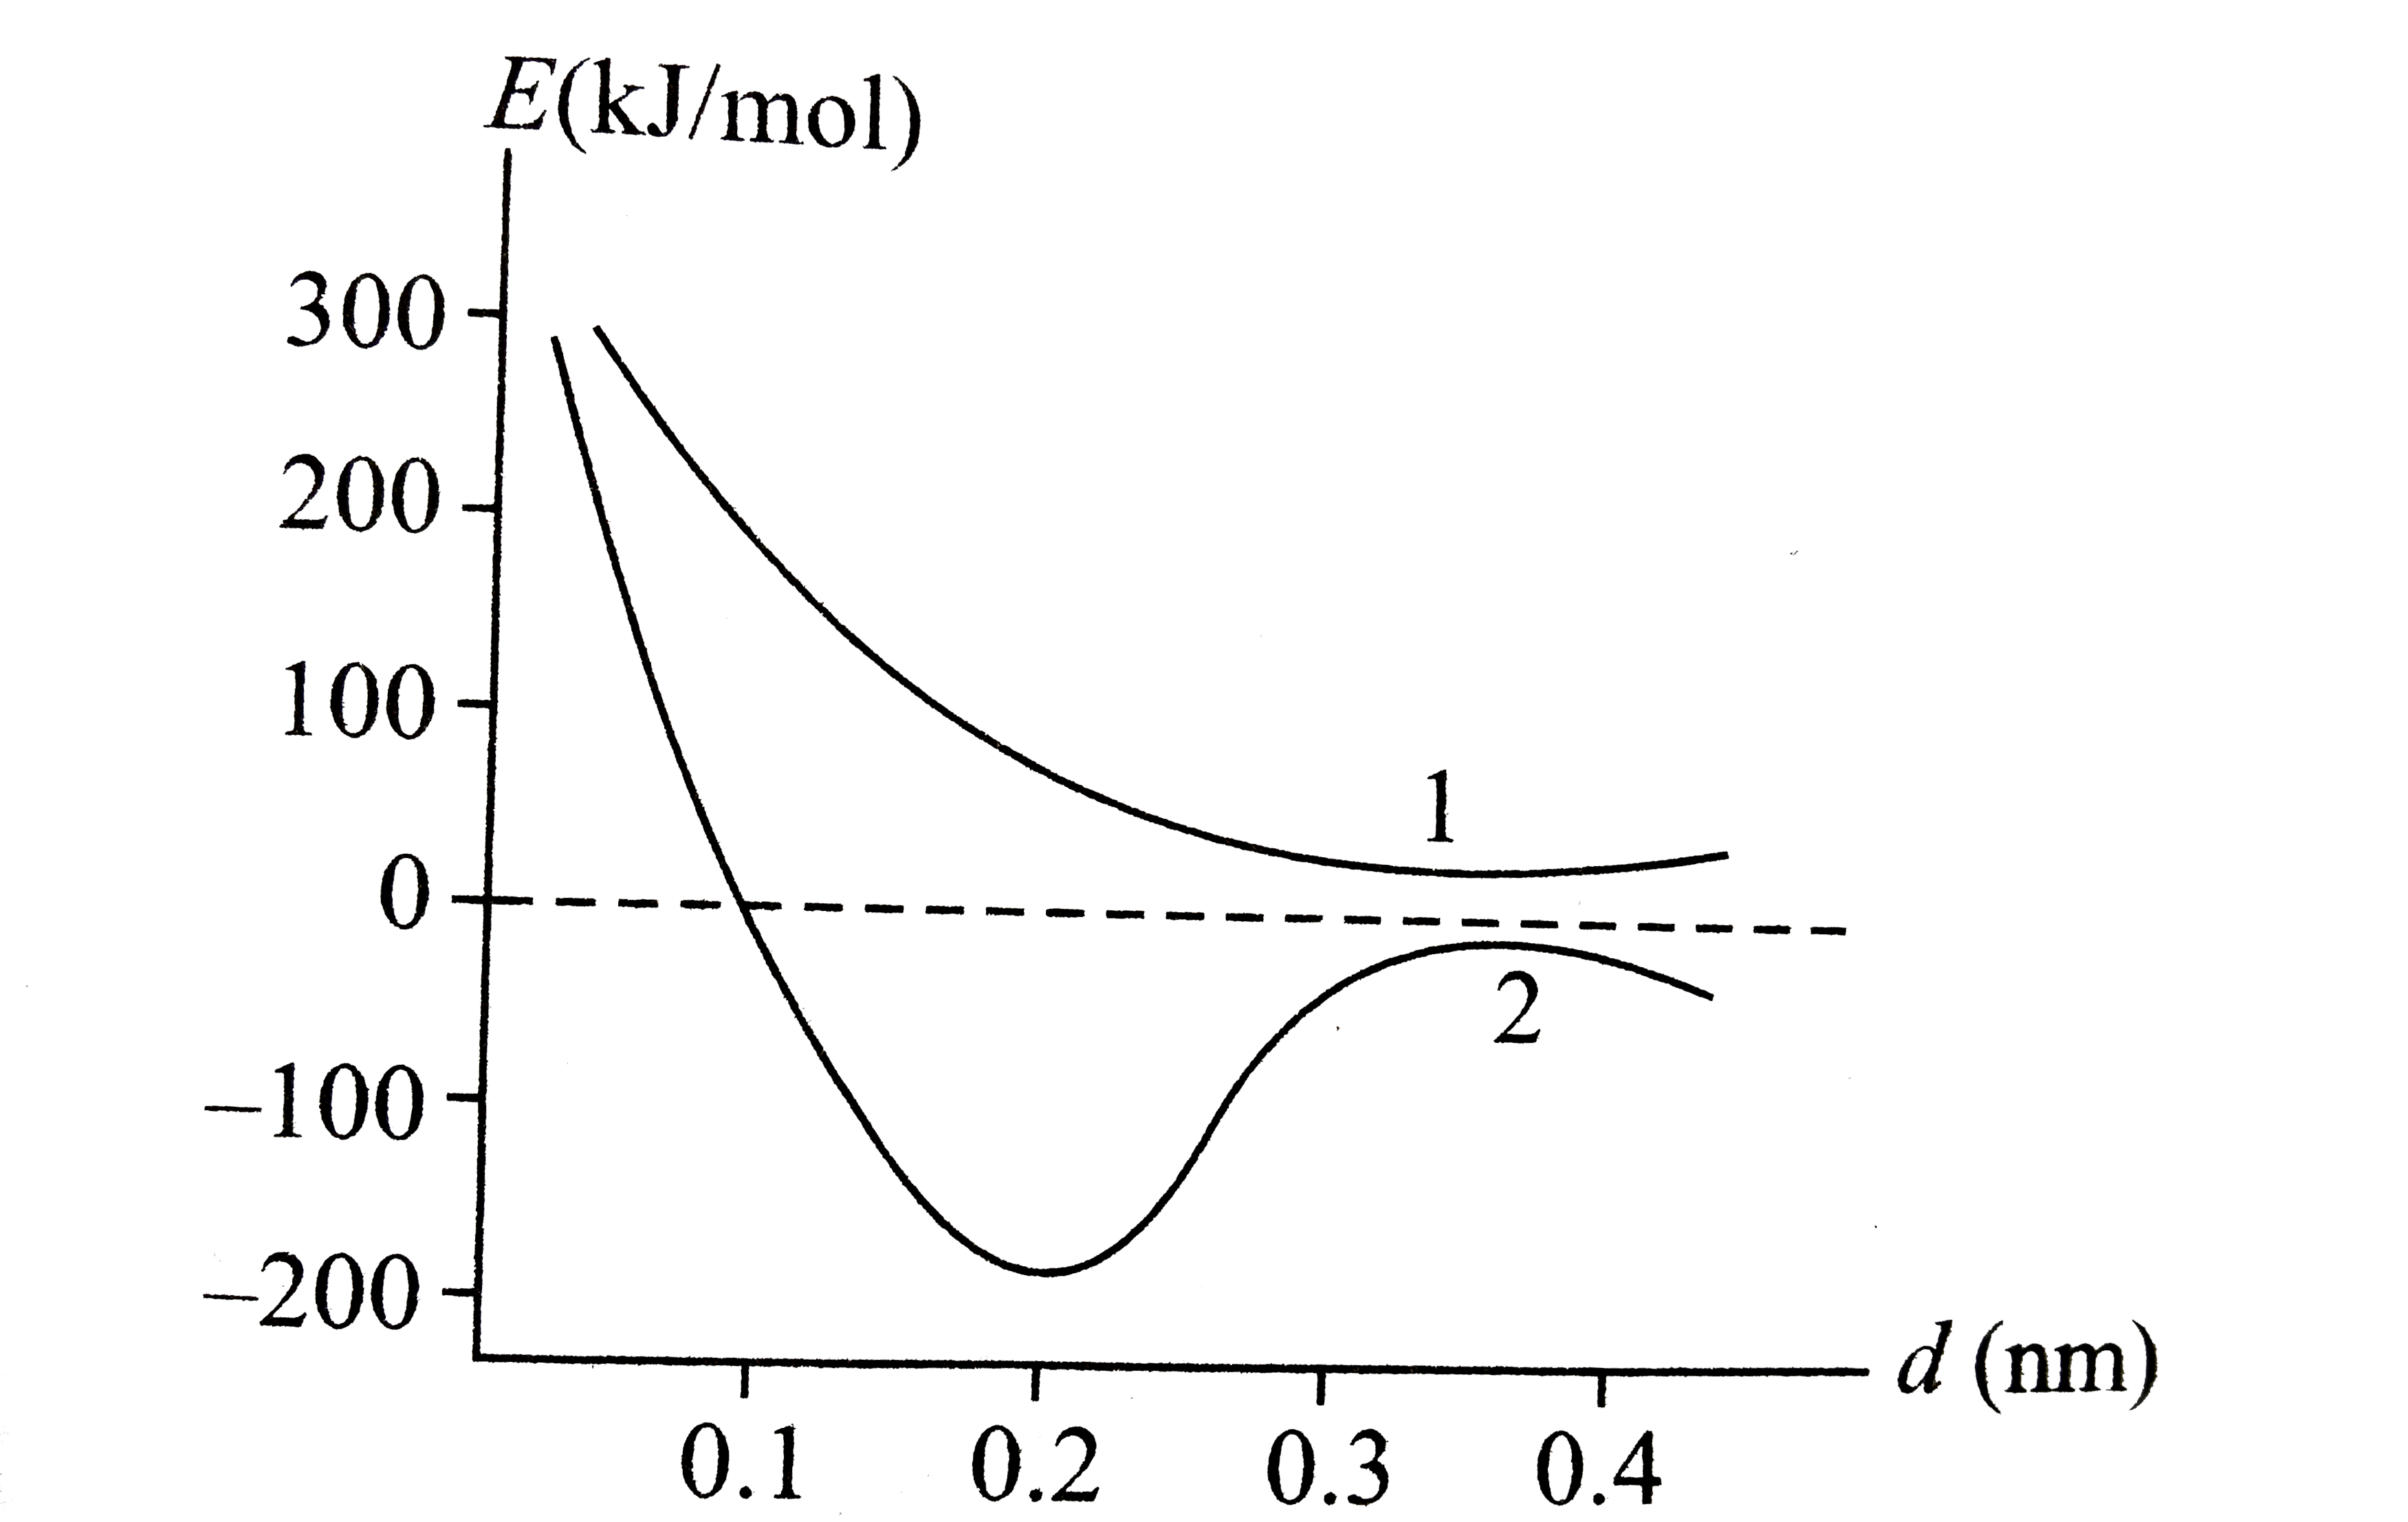
Curve -1 represents the most stable state of the system for H+2 ion
Curve -2 represents the most stable state of the system for H+2 ion
Curve-1 indicates that the molecular hydrogen ion is formed
Curve-2 represent the energy level of the antibonding region
The correct Answer is:b
BOofH2+2is12 hence curve −2 shows bonding condition or decrease in potential energy.
Topper's Solved these Questions
- BOOK - A2ZCHAPTER - CHEMICAL BONDING AND MOLECULAR STRUCTUREEXERCISE - Force Of Attraction22videos
CHEMICAL BONDING AND MOLECULAR STRUCTURE
- BOOK - A2ZCHAPTER - CHEMICAL BONDING AND MOLECULAR STRUCTUREEXERCISE - Bond Enthalpy, Bond Angle And Bond Length23videos
CHEMICAL BONDING AND MOLECULAR STRUCTURE
- BOOK - A2ZCHAPTER - CHEMICAL BONDING AND MOLECULAR STRUCTUREEXERCISE - Vsepr Theory And Hybridisation46videos
CHEMICAL BONDING AND MOLECULAR STRUCTURE
- BOOK - A2ZCHAPTER - ATOMIC STRUCTUREEXERCISE - Section D - Chapter End Test30videos
ATOMIC STRUCTURE
- BOOK - A2ZCHAPTER - CHEMICAL EQUILIBRIUMEXERCISE - Section D - Chapter End Test30videos
CHEMICAL EQUILIBRIUM
Similar Questions
Knowledge Check
- Question 1 - Select One
Consider the given figure showing the formation of H+2 ion dependin on internuclear distance versus potential energy of the system
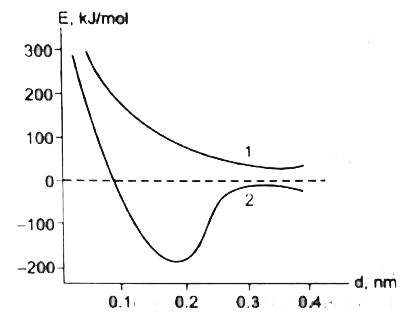
Which is correct statement :ACurve-1 represents the most stable state of the system for H+2BCurve-2 represents the most stable state of the system for H+2CCurve-1 indicates that the molecular hydrogen ion is formedDCurve-2 represents the energy level of the antibonding region - Question 2 - Select One
Consider the given figure showing that possible levels of the energy of H+2 ion depending on internuclear distance versus potential energy of the system.
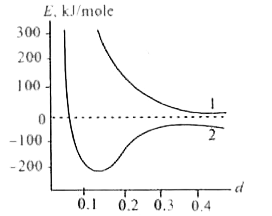
It may be easily assumed that the ground state of the molecular hydrogen ion H+2 corresponds to the lowest level which means thatAcurve 1 represents the most stasble state of the system for H+2 ionBcurve 2 represents the most stable state of the system of H+2 ionCdata is insufficientDNone of these - Question 3 - Select One
During bond formation, potential energy of the system
AIncreasesBDecreasesCRemains the sameDCan't tbe predicted
Three solid spheres of mass M and radius R are placed in contact as shown in figure. Find the potential energy of the system ?
View SolutionThe potential energy curve for the H2 molecule as a function of internuclear distance is :
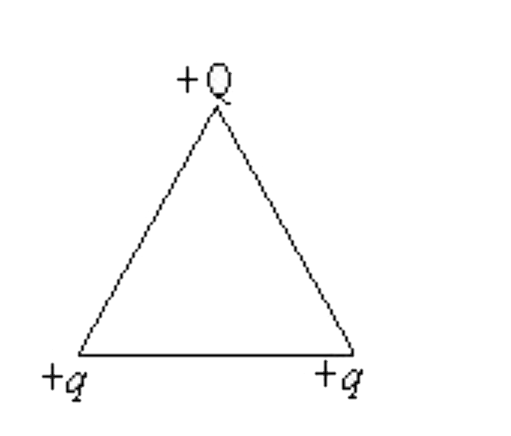
View SolutionThree charges are placed at the vertex of an equilateral triangle as shown in figure. The value of Q, for which the electrostatic potential energy of the system is zero, is
 View Solution
In the potential energy curve for the formation of H2 molecule as a function of internuclear distance of H atoms, what happens at the minimum in the curve?
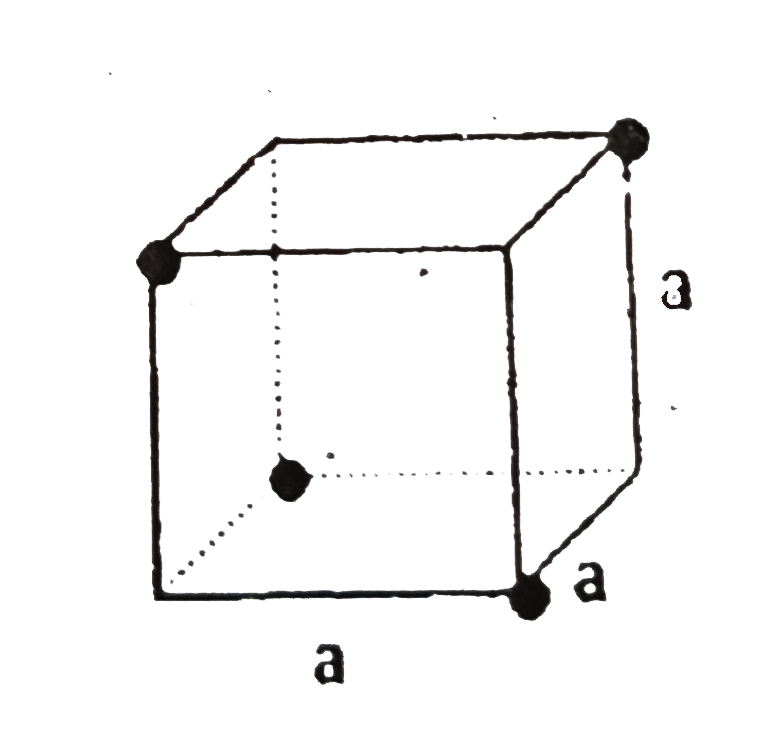
View SolutionFigure shows 4 identical masses of mass m, arranged on a cube as shown.
The potential energy of the system is
 View Solution


