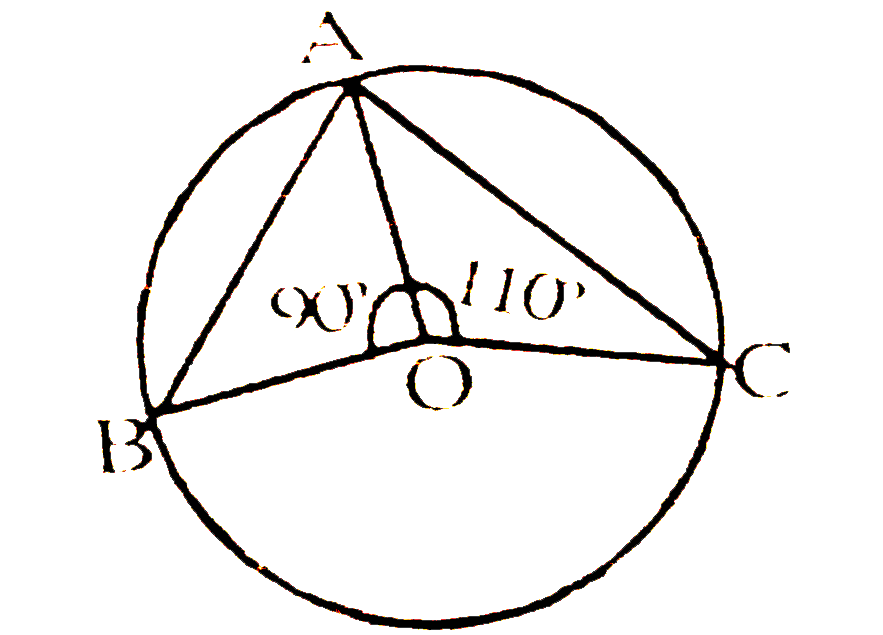
बगल के चित्र में वृत्त पर तीन बिन्दु ABC इस प्रकार है की केन्द्र O पर जिवाओं AB तथा AC द्वारा बनाए गए कोण क्रमशः 90∘ तथा 110∘ है। ∠BAC निर्धारित करे।

70∘
80∘
40∘
30∘
The correct Answer is:B
NA
Topper's Solved these Questions
- वृत्तBOOK - DAS GUPTACHAPTER - वृत्तEXERCISE - दीर्घ उत्तरीय प्रश्न
12 Videos
- वृत्तBOOK - DAS GUPTACHAPTER - वृत्तEXERCISE - अति लघु उत्तरीय प्रश्न
43 Videos
- रेखाएँ एवं कोण BOOK - DAS GUPTACHAPTER - रेखाएँ एवं कोण EXERCISE - प्रश्नावली 7 B (लघु उत्तरीय प्रश्न)
6 Videos
- शंकु BOOK - DAS GUPTACHAPTER - शंकु EXERCISE - प्रश्नावली 16 (दीर्घ उत्तरीय प्रश्न)
3 Videos
Similar Questions
सिद्ध कीजिए कि किसी समचतुर्भुज की किसी भुजा को व्यास मानकर खींचा गया वृत्त उसके विकर्णों के प्रतिच्छेद बिंदु से होकर जाता है ।
View Solutionसर्वांगसम वृत्तों में सर्वांगसम चापों की संगत जीवाएं निम्नांकित में किस प्रकार की होती है?
View Solutionबगल के चित्र में AB∣∣CD और FP, ∠EFB को समद्विभाजित करती है। यदि ∠CGH=150∘ हो तो ∠EFP का मान ज्ञात करें।

View Solutionएक समकोण त्रिभुज की समकोण बनानेवाली भुजाएँ 3 सेमी तथा 4 सेमी हैं | उसे कर्ण के परित: चारों ओर घुमा दिया जाता है | इस प्रकार से बने हुए दुहरे शंक्वाकार ठोस का आयतन ज्ञात कीजिए |
View SolutionWhich of the following are correct chain isomers of butane ? (i)
View SolutionDetermine the point of symmetry of a regular hexagon.
View SolutionDtermine the images of the following figure about the given line :
View SolutionIn the figure above (not to scale), ¯¯¯¯¯¯AB⊥¯¯¯¯¯¯CDandAD is the bisector of ∠BAE.AB=3cm and AC=5cm. Find CD.
View SolutionIn the given figure, AB is a diameter, O is the center of the circle and ∠OCB=50∘ then find ∠DBC.
View SolutionMatch the following Column A to Column B

View SolutionMatch the following Column A to Column B

View SolutionMatch the following Column A to Column B

View SolutionThe inequation represented by the graph given below is :
View SolutionThe inequation that best describes the graph given below is _________
View SolutionThe inequation that best describes the following graph is _________
View SolutionWhich inequations represent the shaded region in the given figure
View Solution
