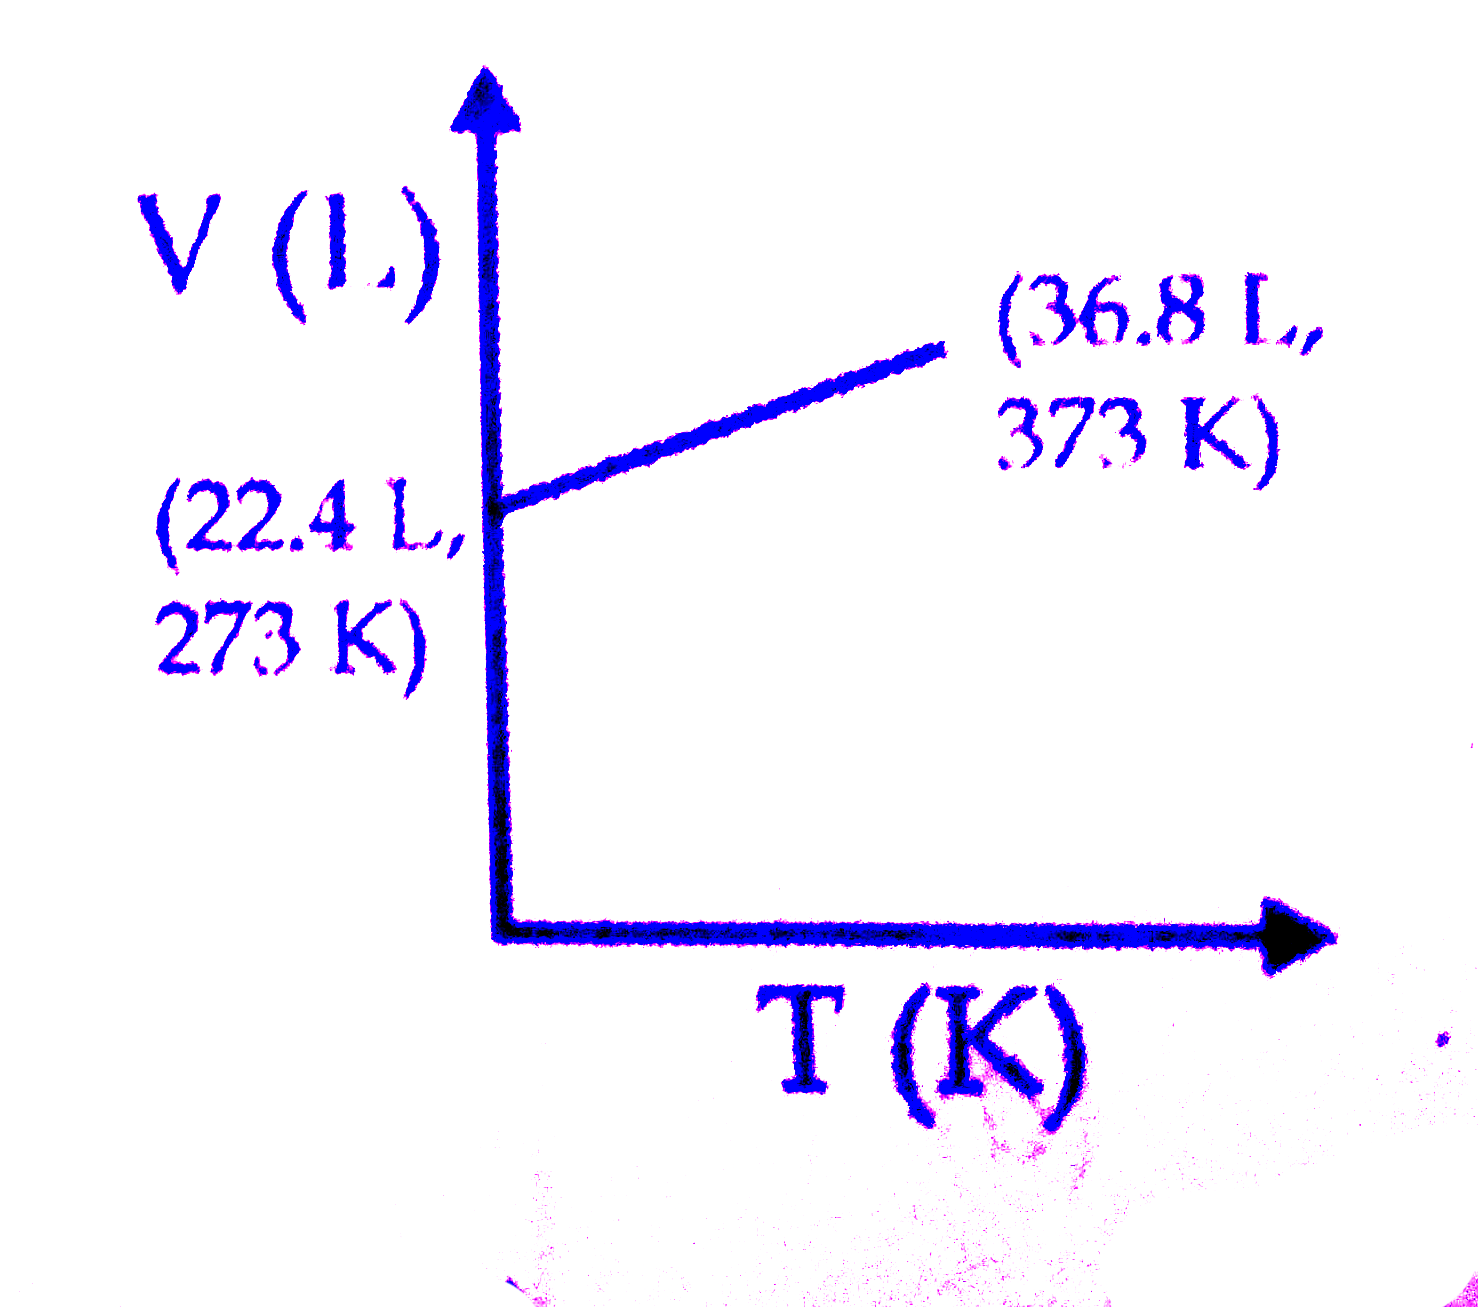
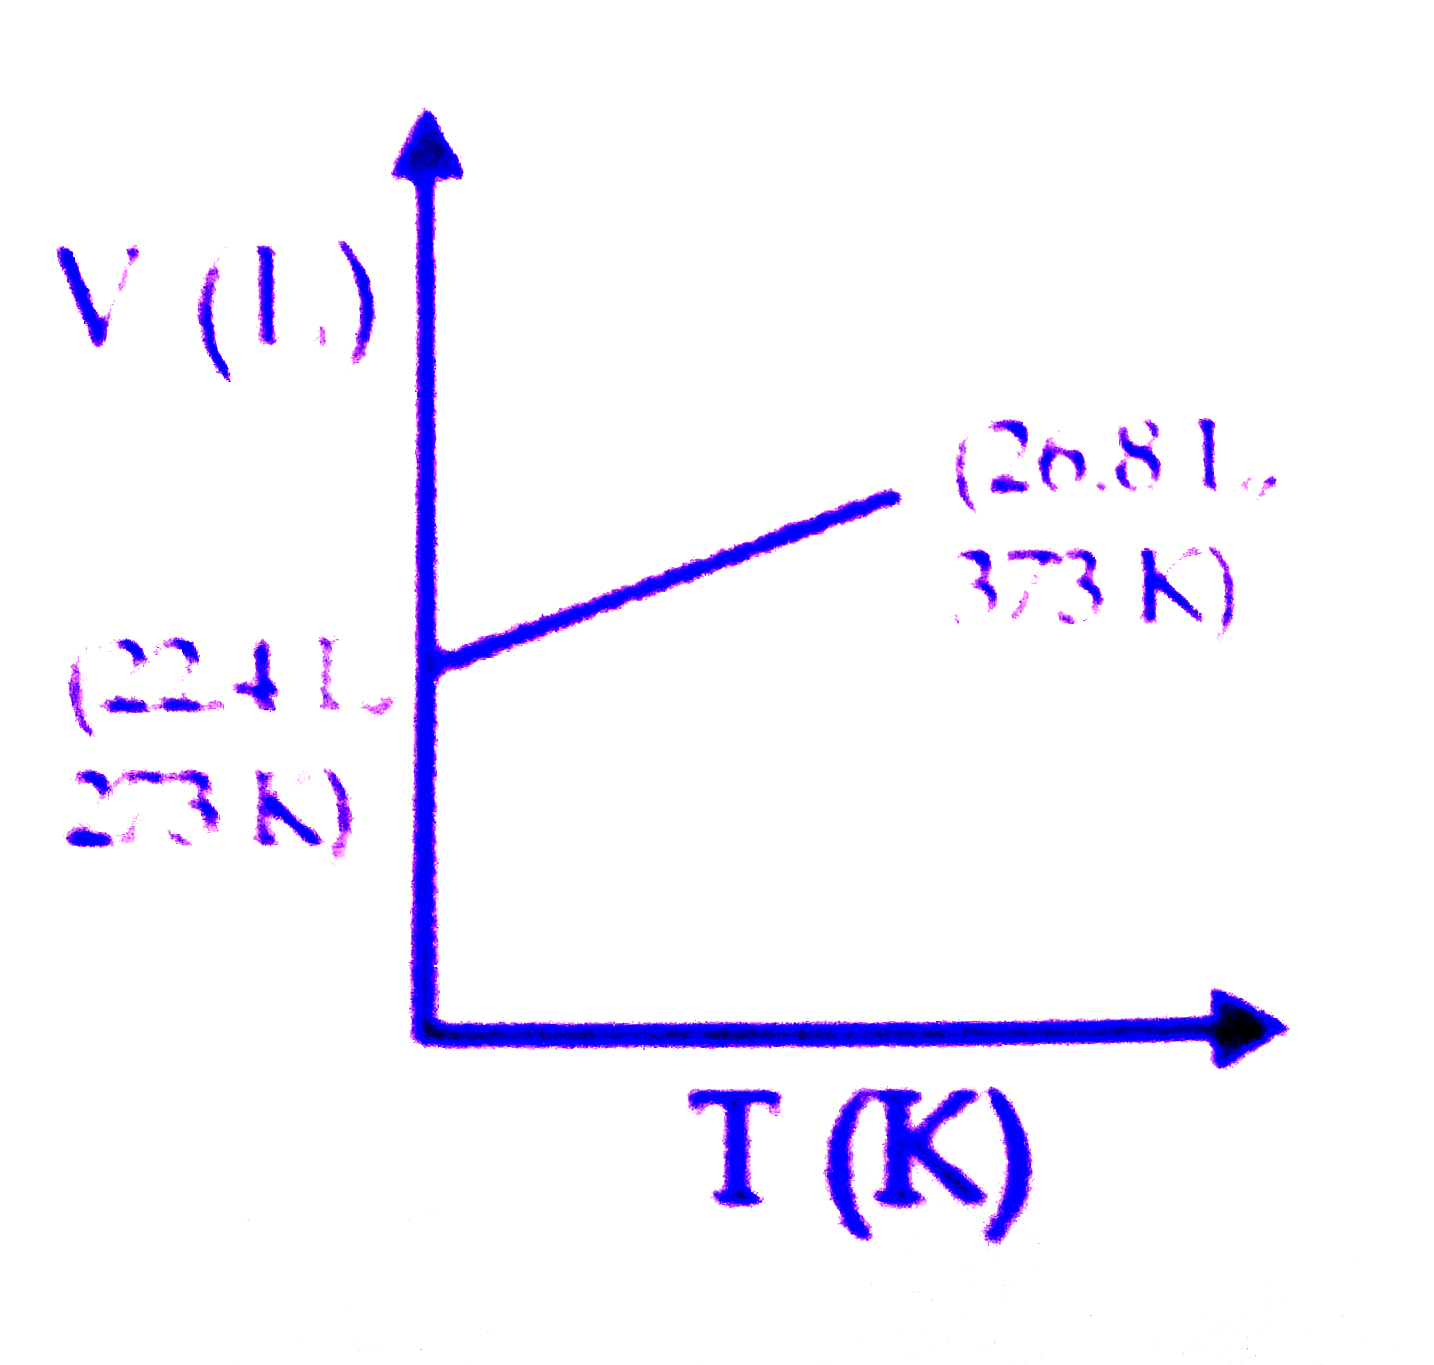
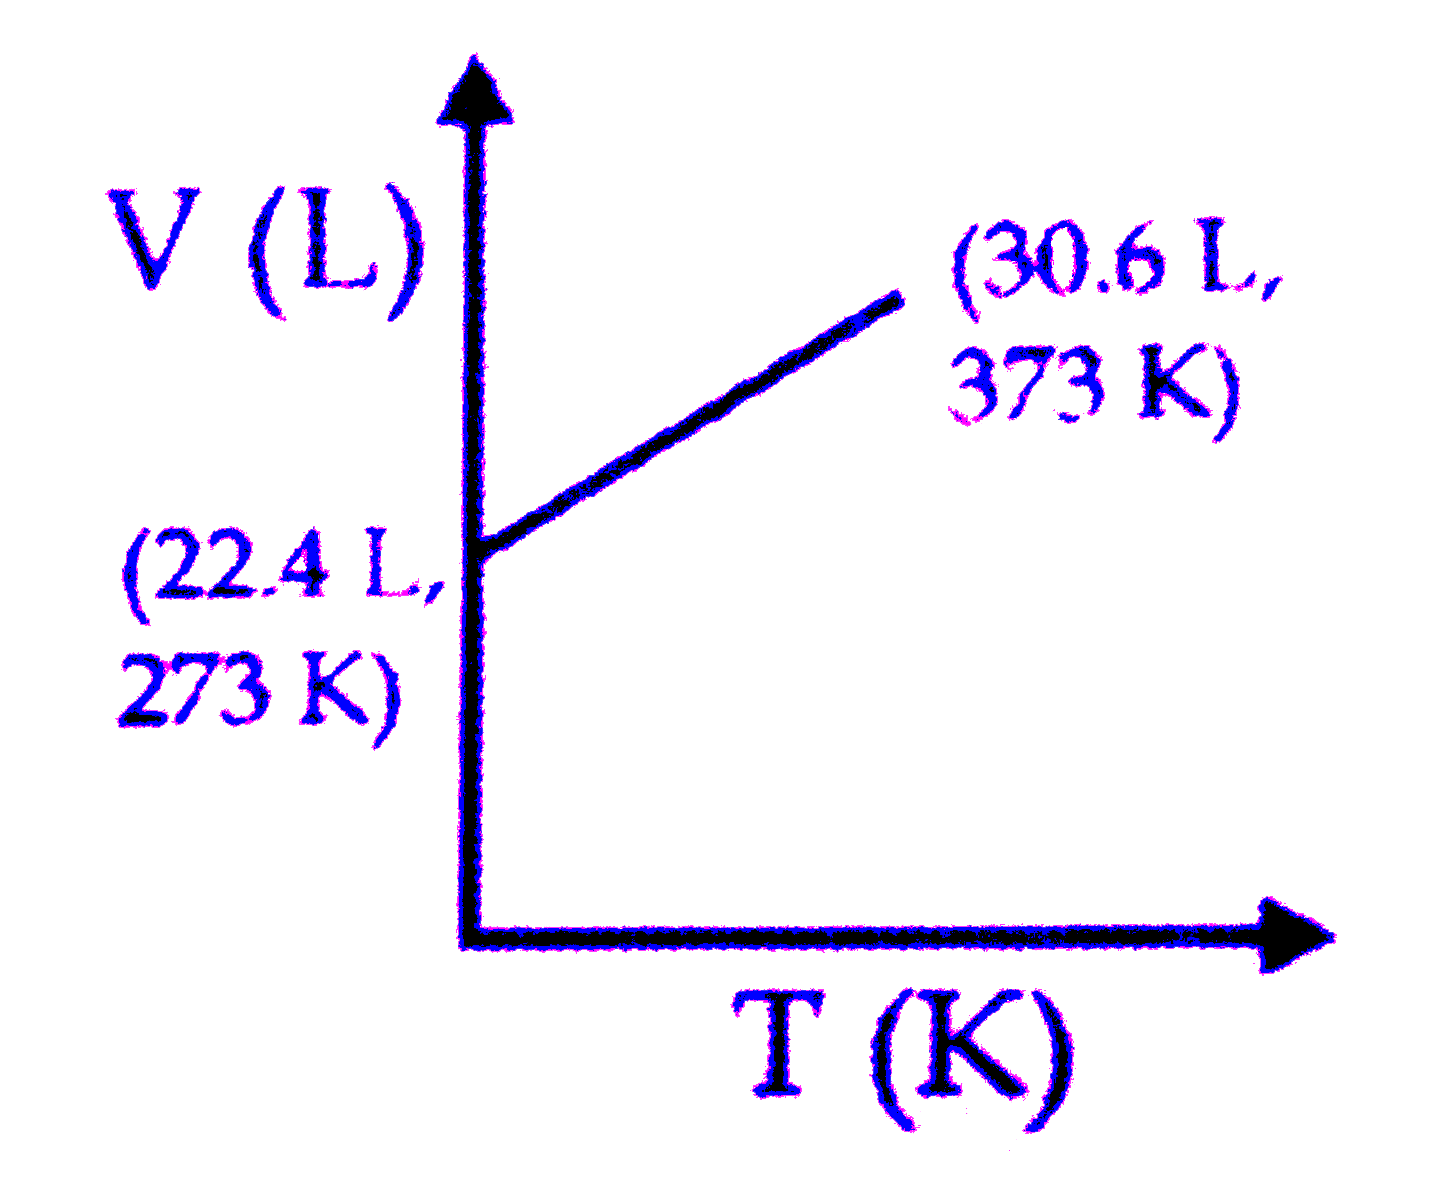
Which of the following volume-temperature (V−I) plots represents the behaviour of 1mole of an ideal gas at the atmospheric pressure?

The correct Answer is:C
V1V2=T1T2∴22.4V2=273373
∴V2=30.6 L
Topper's Solved these Questions
- BOOK - MARVEL PUBLICATIONCHAPTER - STATES OF MATTER : GASES AND LIQUIDS EXERCISE - Ideal Behaviour and Gas Equation and Deviation from Ideal Behaviour40videos
STATES OF MATTER : GASES AND LIQUIDS
- BOOK - MARVEL PUBLICATIONCHAPTER - STATES OF MATTER : GASES AND LIQUIDS EXERCISE - Liquefaction of Gases Critical Teperature Pressure and Volume22videos
STATES OF MATTER : GASES AND LIQUIDS
- BOOK - MARVEL PUBLICATIONCHAPTER - STATES OF MATTER : GASES AND LIQUIDS EXERCISE - Gaseous State6videos
STATES OF MATTER : GASES AND LIQUIDS
- BOOK - MARVEL PUBLICATIONCHAPTER - SOLID STATE EXERCISE - Multiple choice questions183videos
SOLID STATE
- BOOK - MARVEL PUBLICATIONCHAPTER - SURFACE CHEMISTRYEXERCISE - TEST YOUR GRASP35videos
SURFACE CHEMISTRY
Similar Questions
Which of the following volume (V) - temperature (T) plots represents the behaviour of one mole of an ideal gas at one atmospheric pressure?
View SolutionWhich of the following volume (V)-temperature (T) plots represents the behaviour of one mole of an ideal gas at one atmoshperic pressure?
View Solution
Knowledge Check
- Question 1 - Select One
Which of the following volume (V) - temperature (T) plots represents the behaviour of one mole of an ideal gas at one atmospheric pressure?
A B
B C
C D
D
- Question 2 - Select One
Which one of the following volume (V)- temperature (T) plots represents the behaviour of one mole of an ideal gas at one atmosphere?
A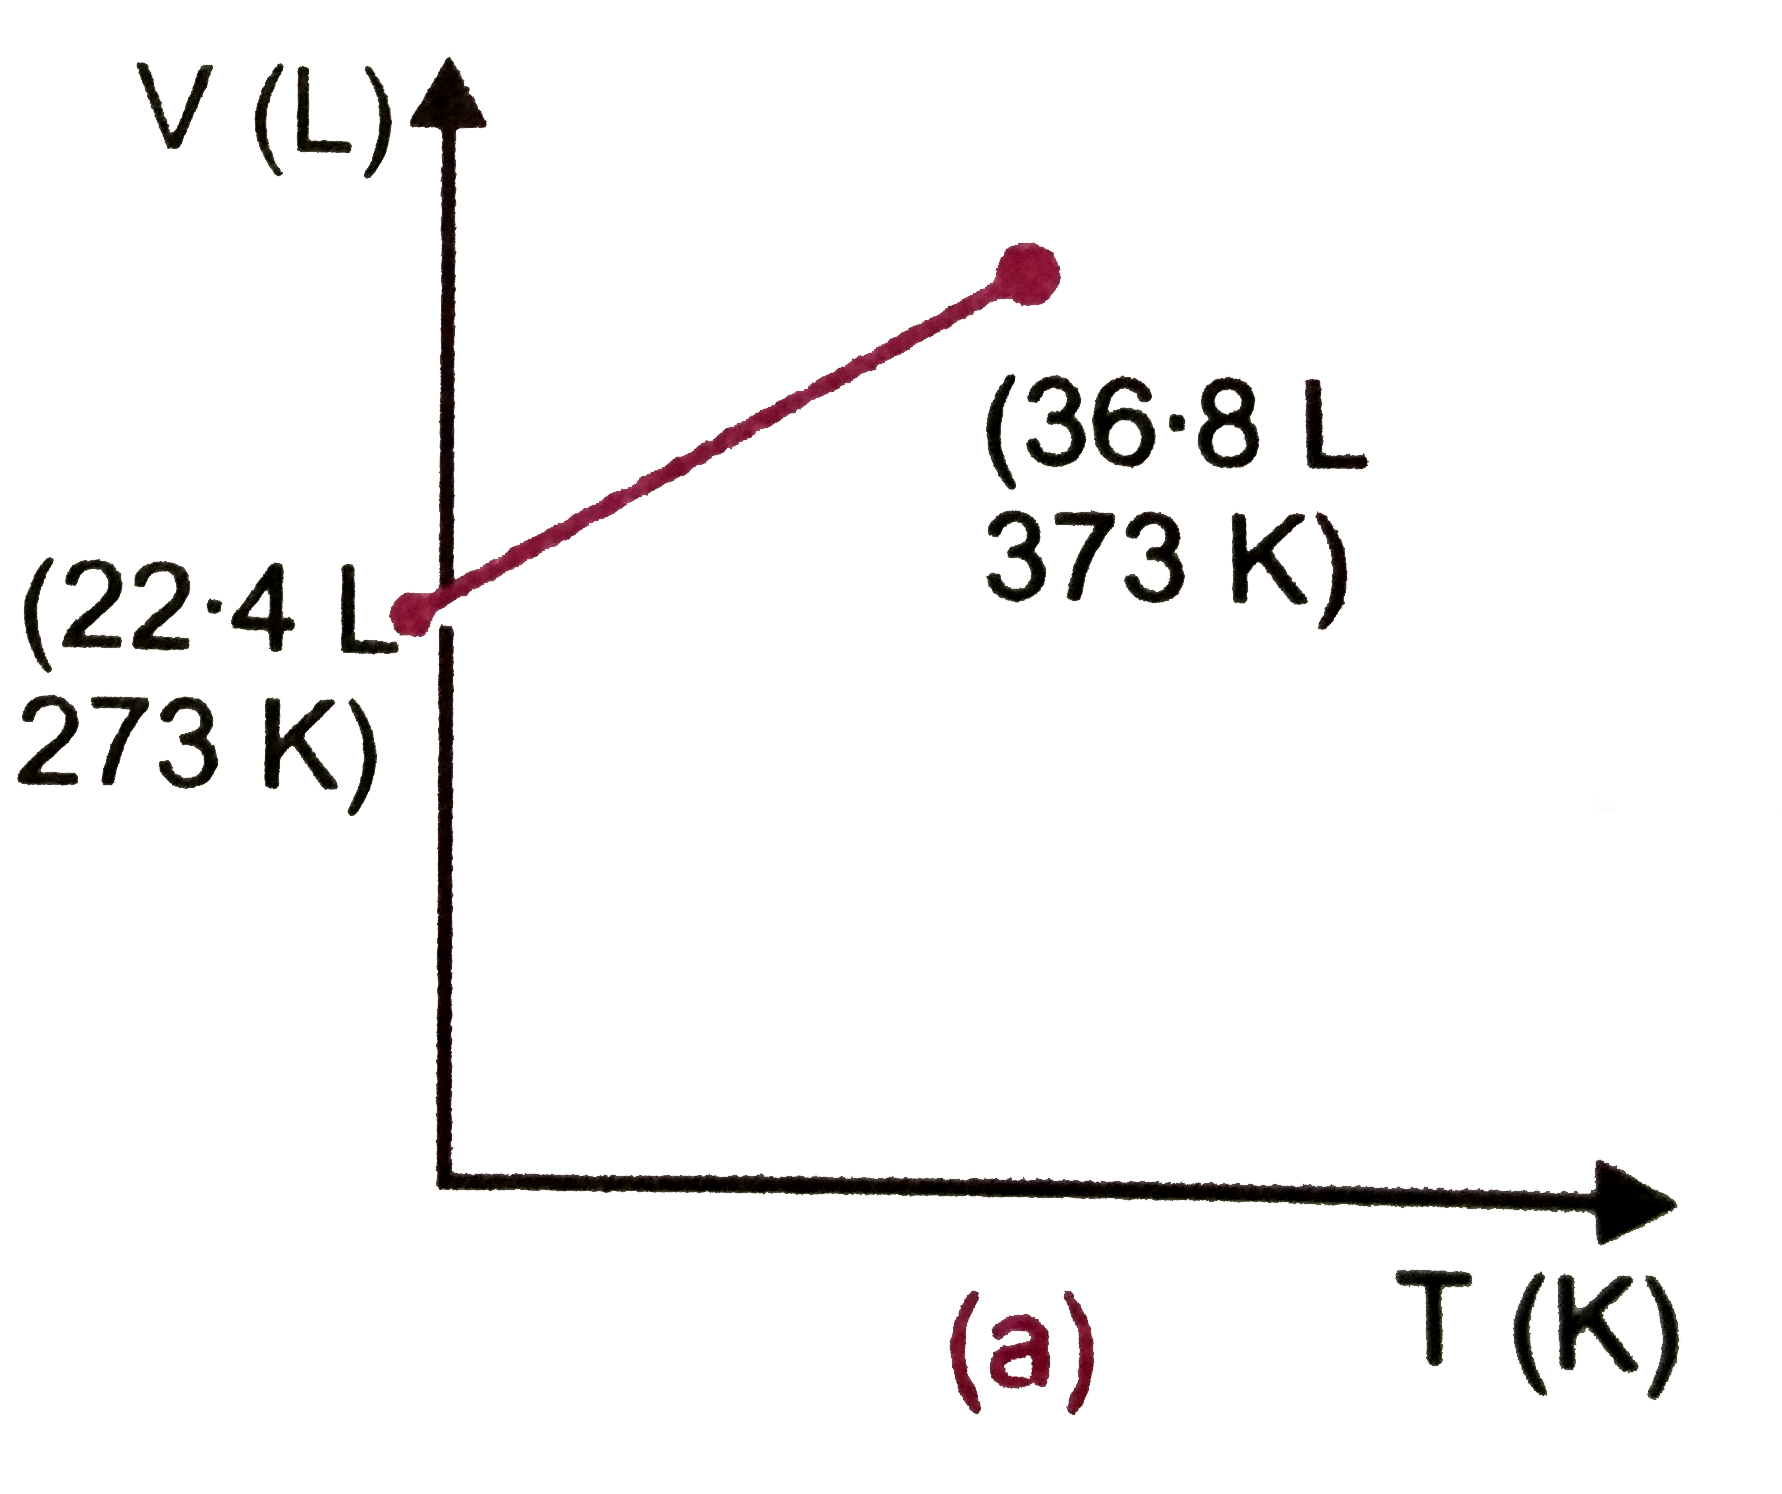 B
B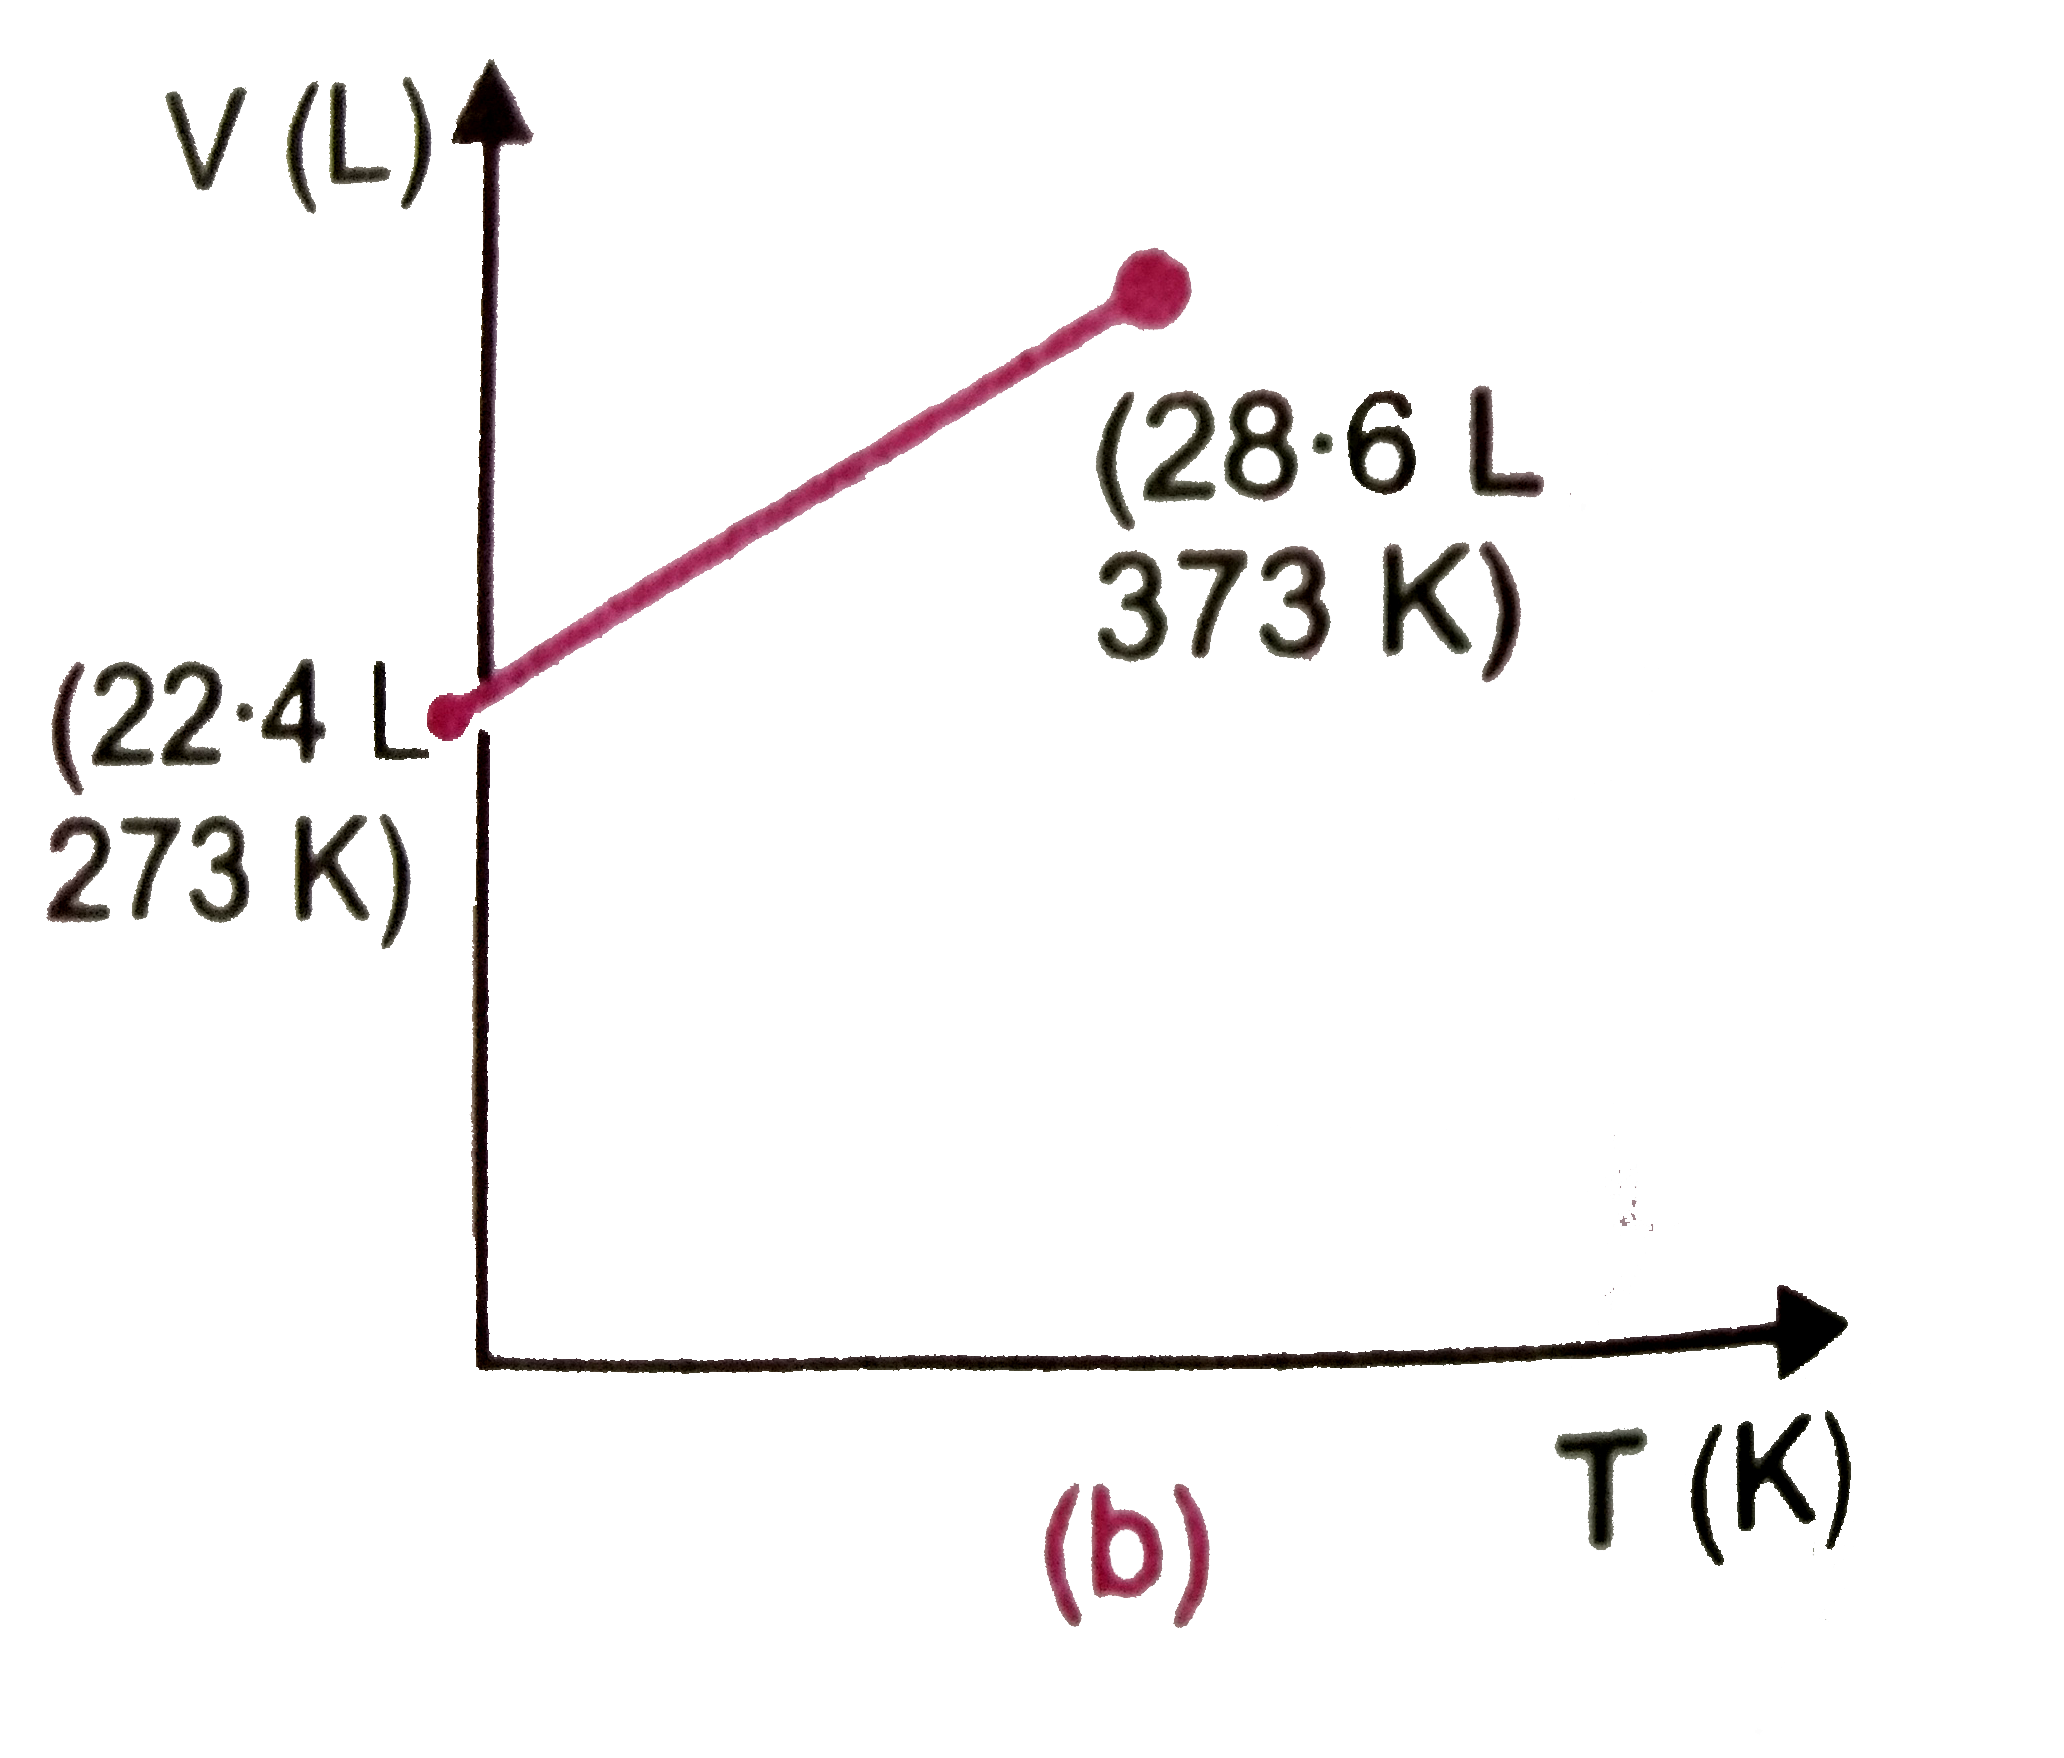 C
C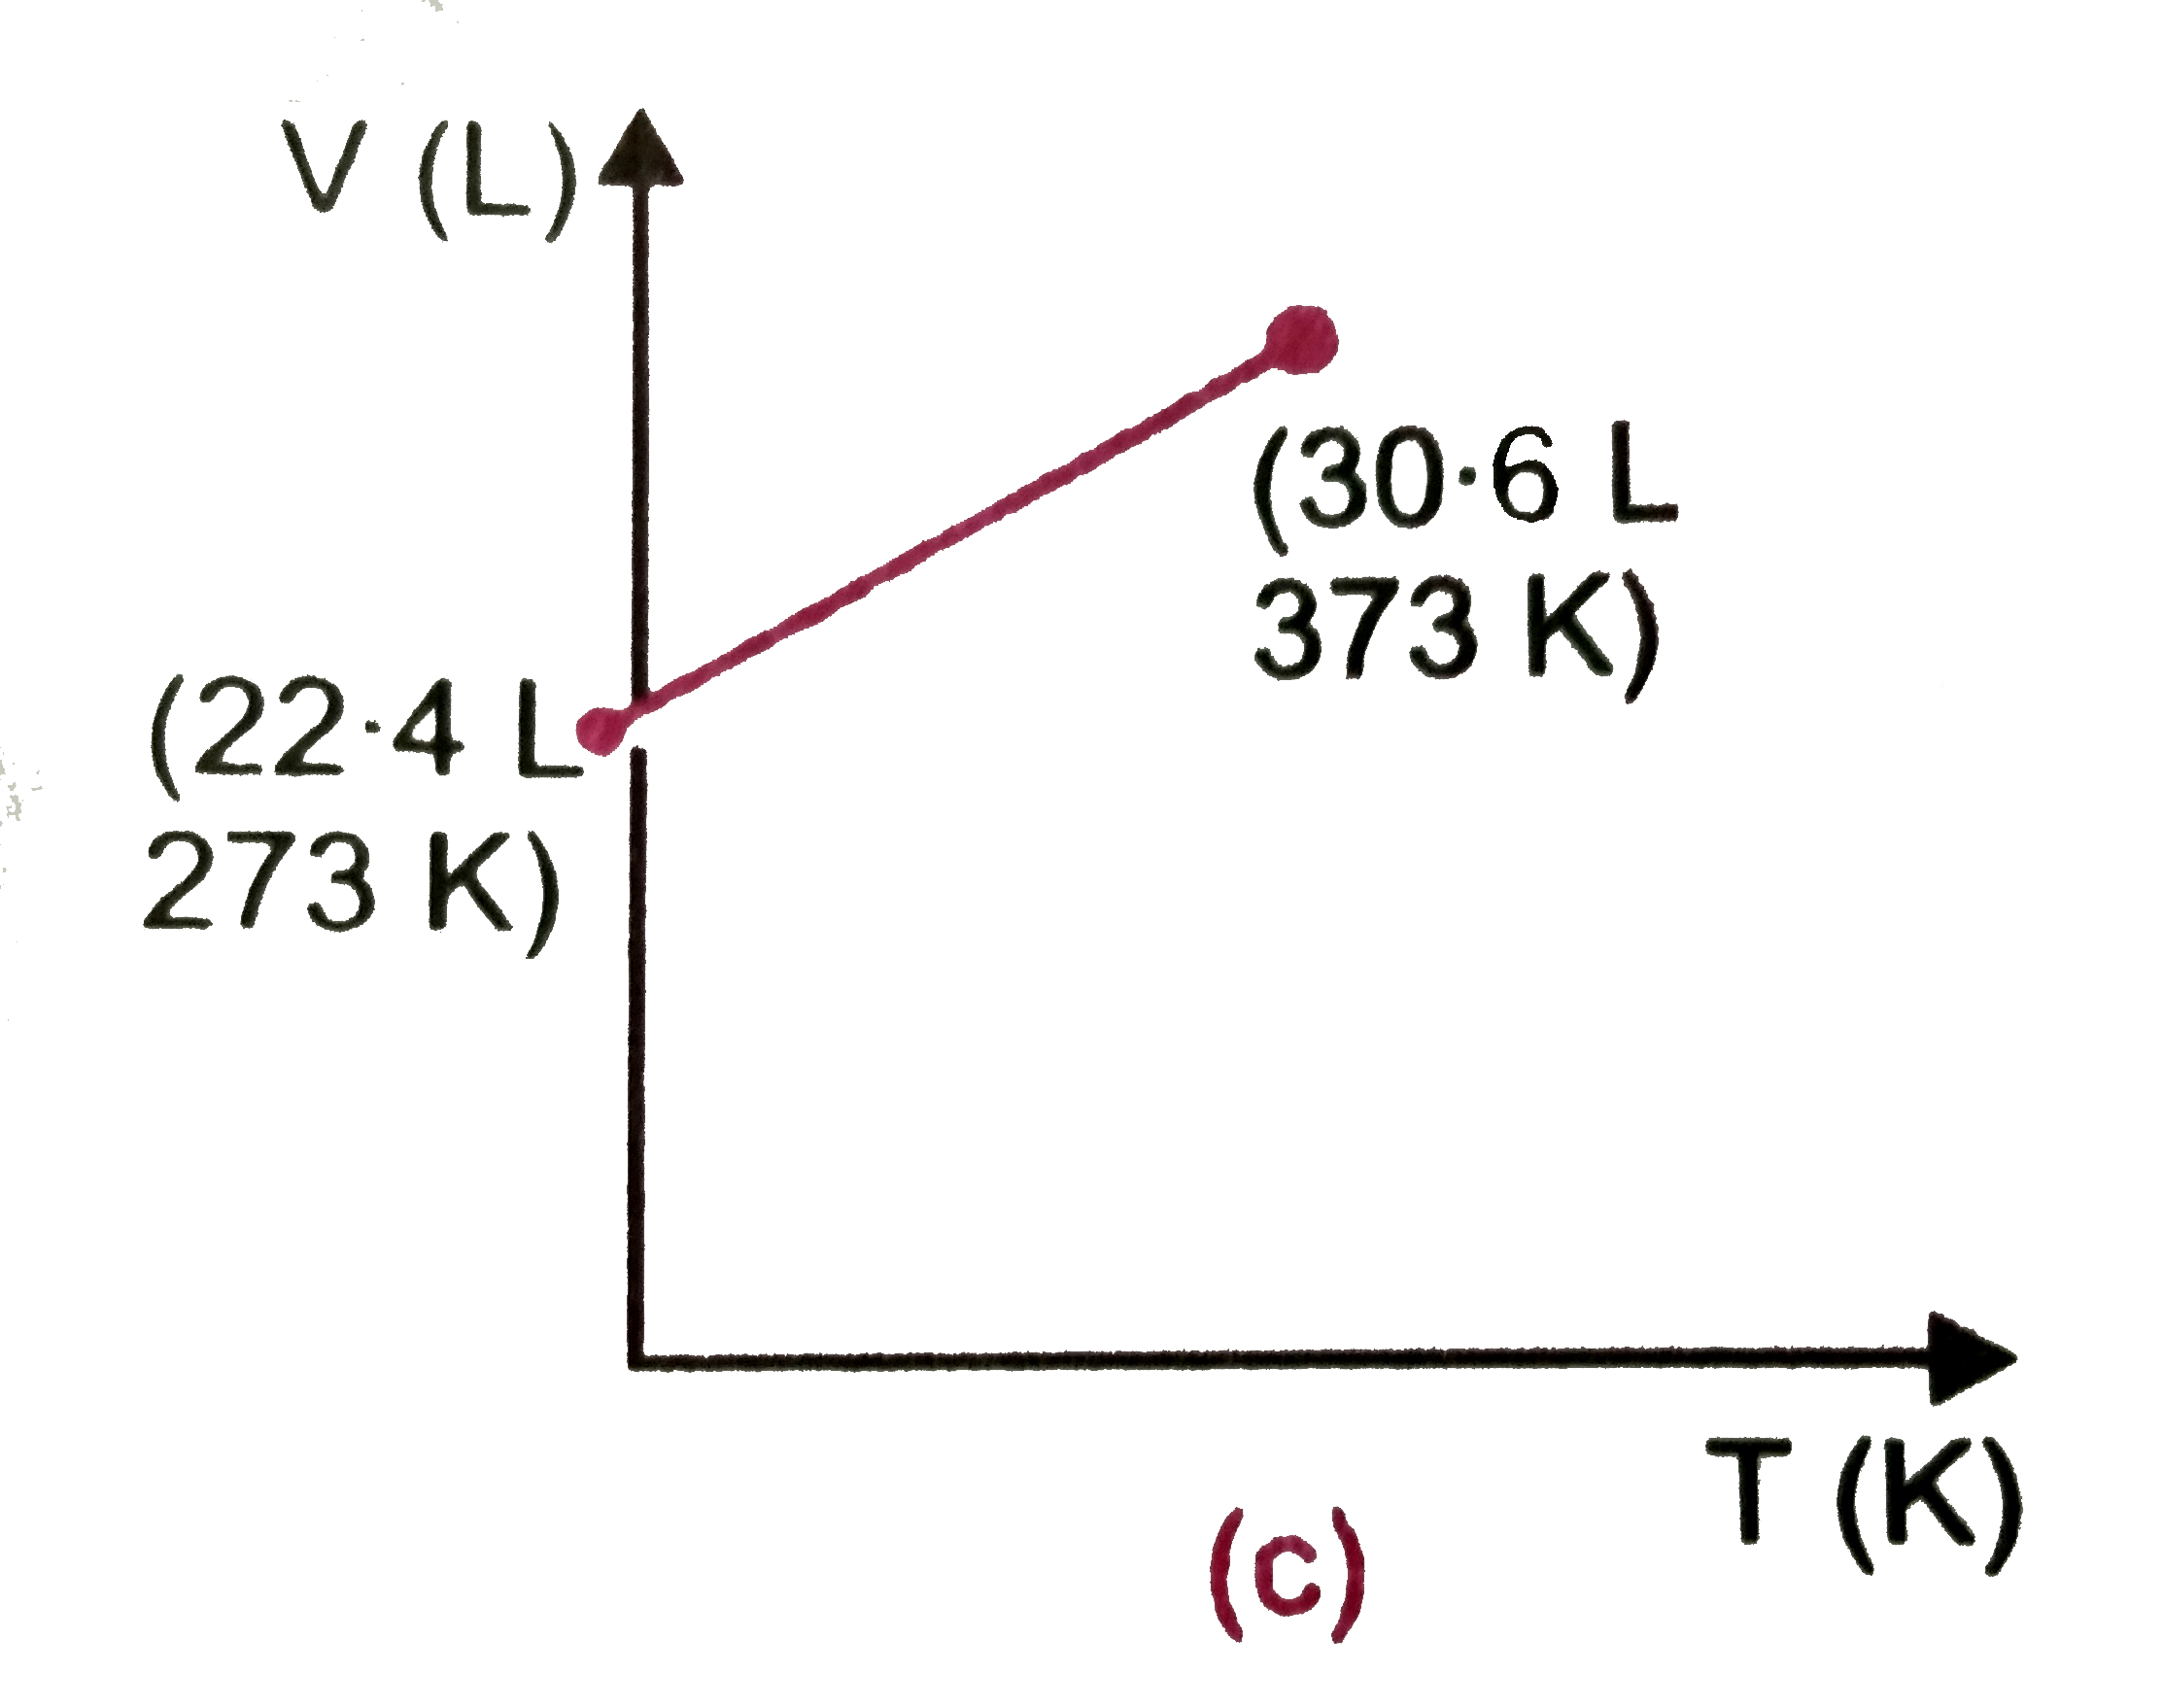 D
D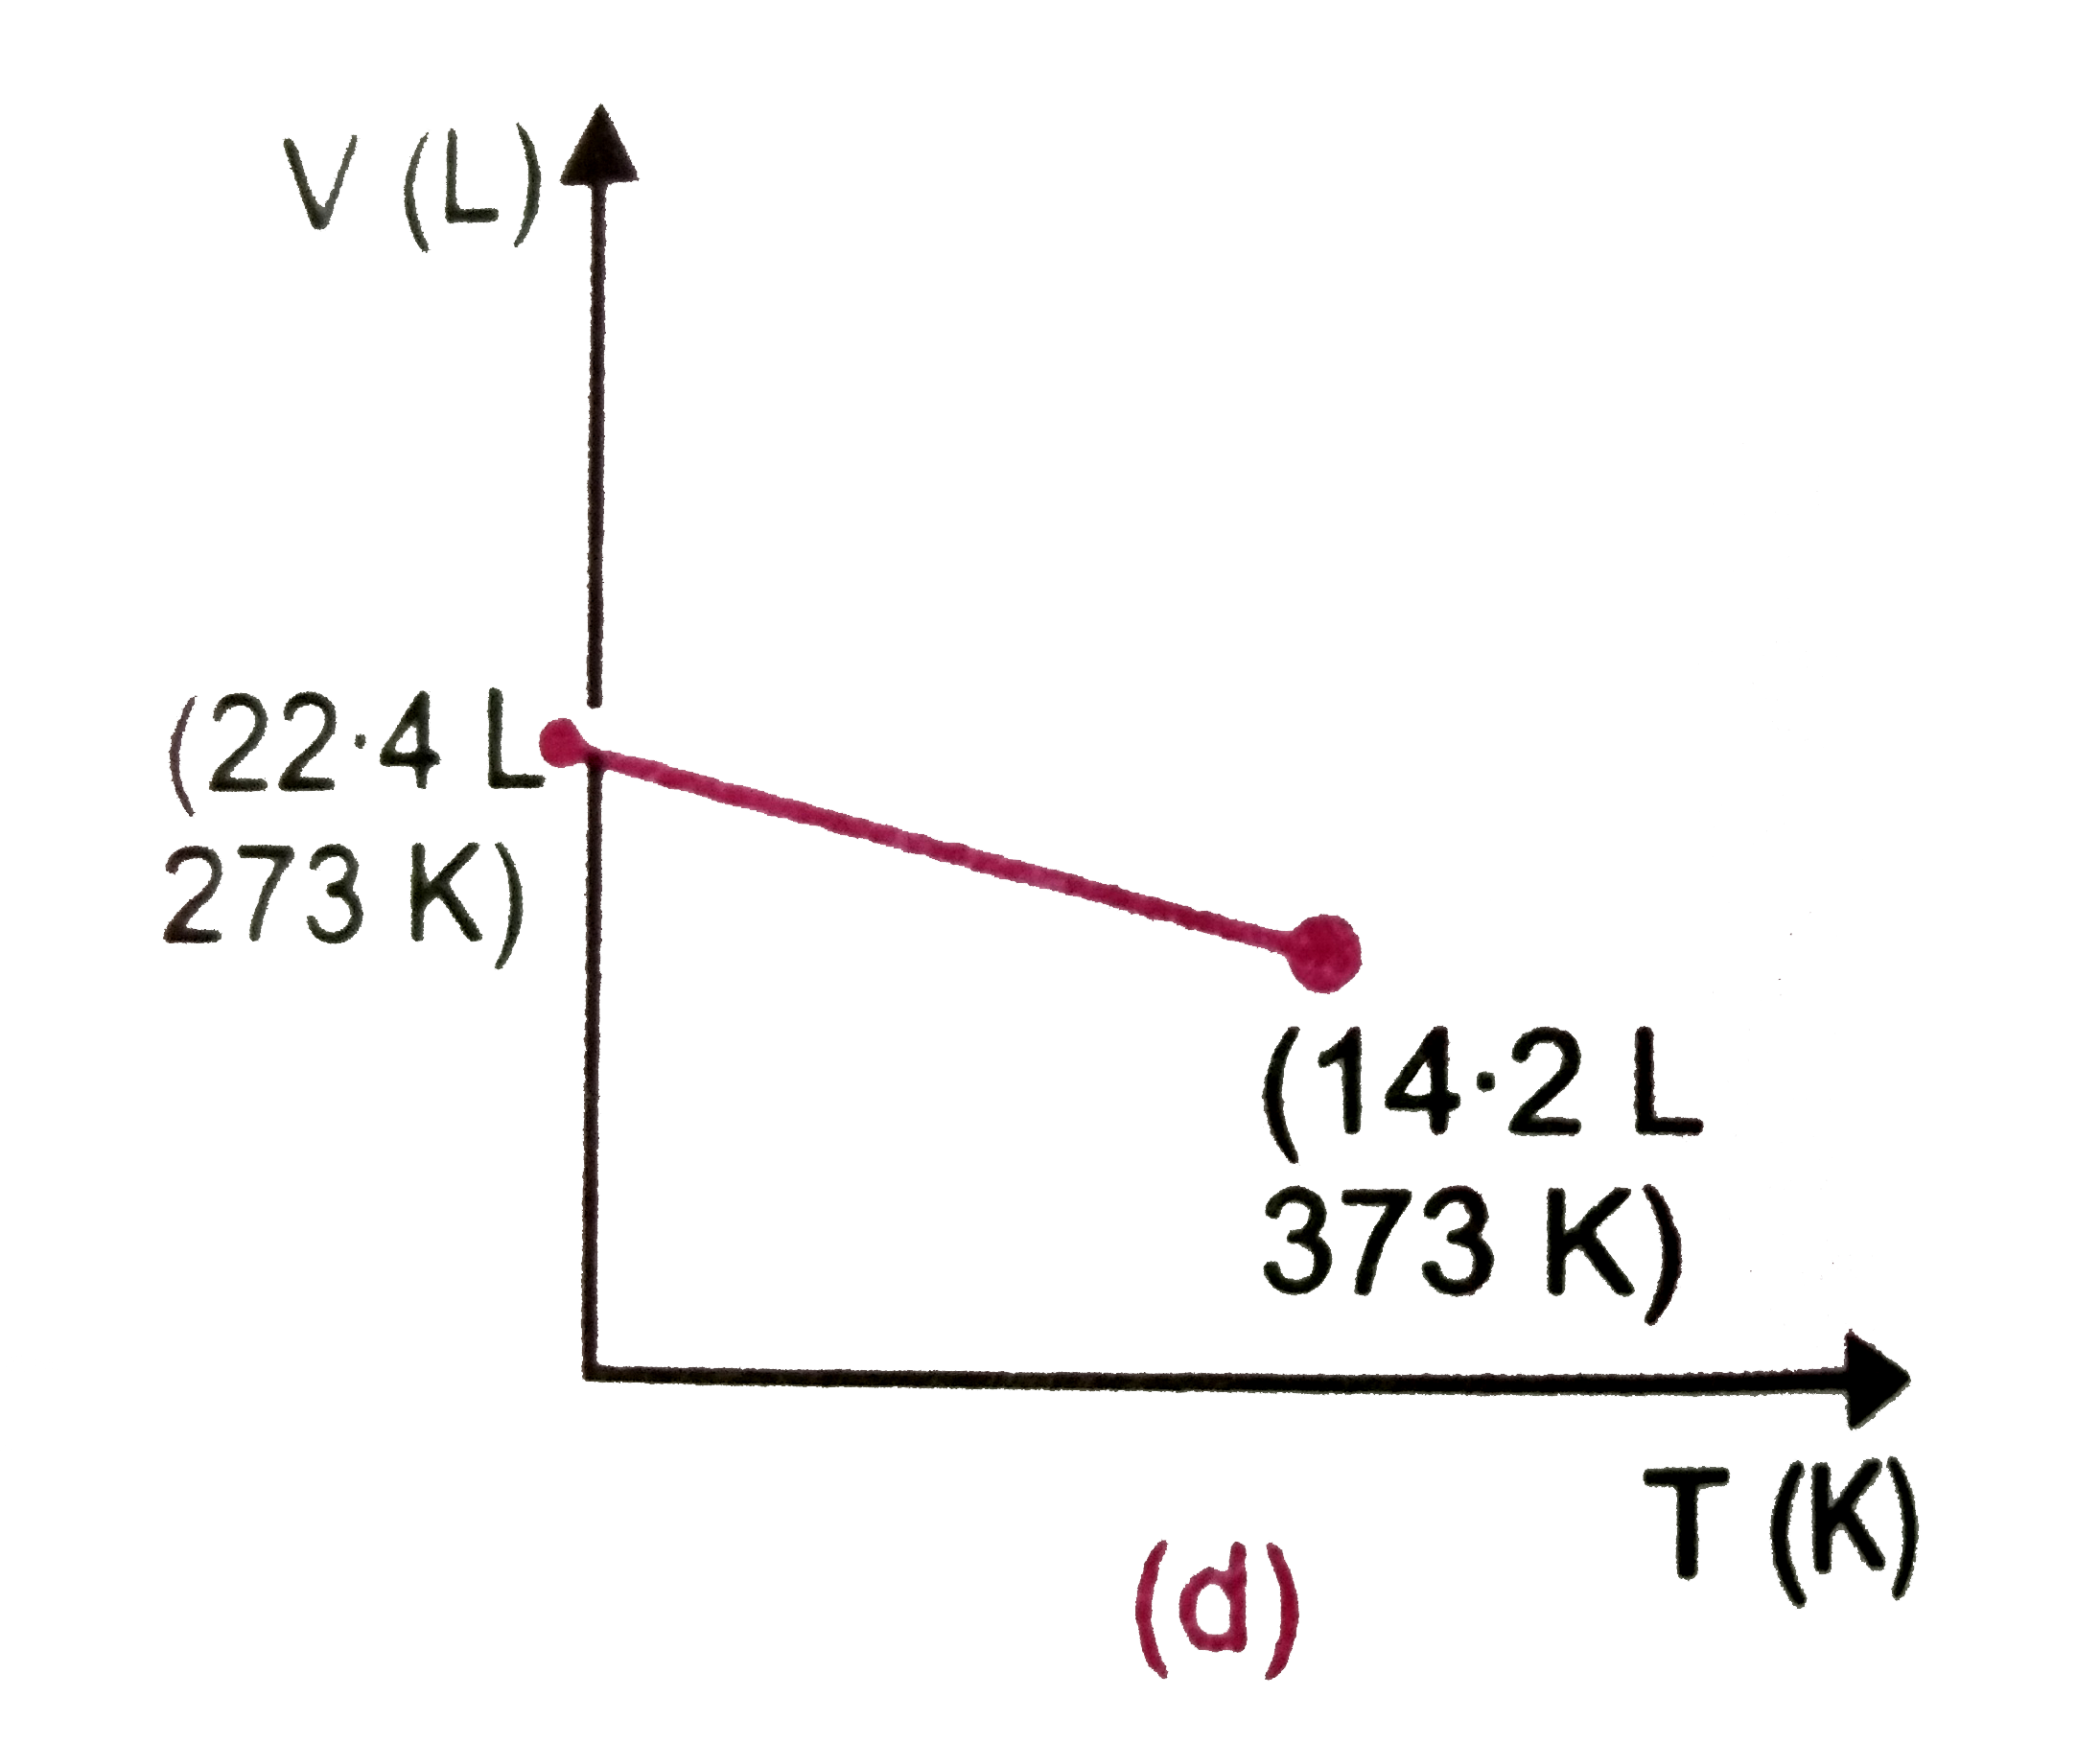
- Question 3 - Select One
Which of the following volume (V) temperature (T) plots represents the behaviour of one mole of an ideal gas at one atmospheric pressure:
A B
B C
C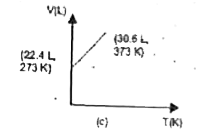 D
D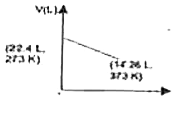
Which of the following volume-temperature (V−I) plots represents the behaviour of 1mole of an ideal gas at the atmospheric pressure?
View SolutionWhich one of the following volume (V)- temperature (T) plots represents the behaviour of one mole of an ideal gas at one atmosphere?
View SolutionThe graph that does represent the behaviour of an ideal gas is :
View SolutionWhich of the following graphs represent the behaviour of an ideal gas ?
View SolutionWhich of the following plots represents the behavior of an ideal binary liquid solution ?
View Solution

