Which of the following volume (V) - temperature (T) plots represents the behaviour of one mole of an ideal gas at one atmospheric pressure?
A
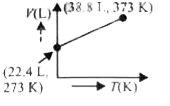
B
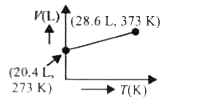
C
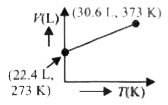
D

Text Solution
The correct Answer is:C
According to Charles. law , V∝T at constant P
V1V2=T1T2
V1=22.4L,T1=273K,T2=373K,V2=?
V2=T2T1×V1=373273×22.4=30.6L
Thus graph (c) is correct.
|
Similar Questions
Knowledge Check
Which of the following volume-temperature (V−I) plots represents the behaviour of 1mole of an ideal gas at the atmospheric pressure?
A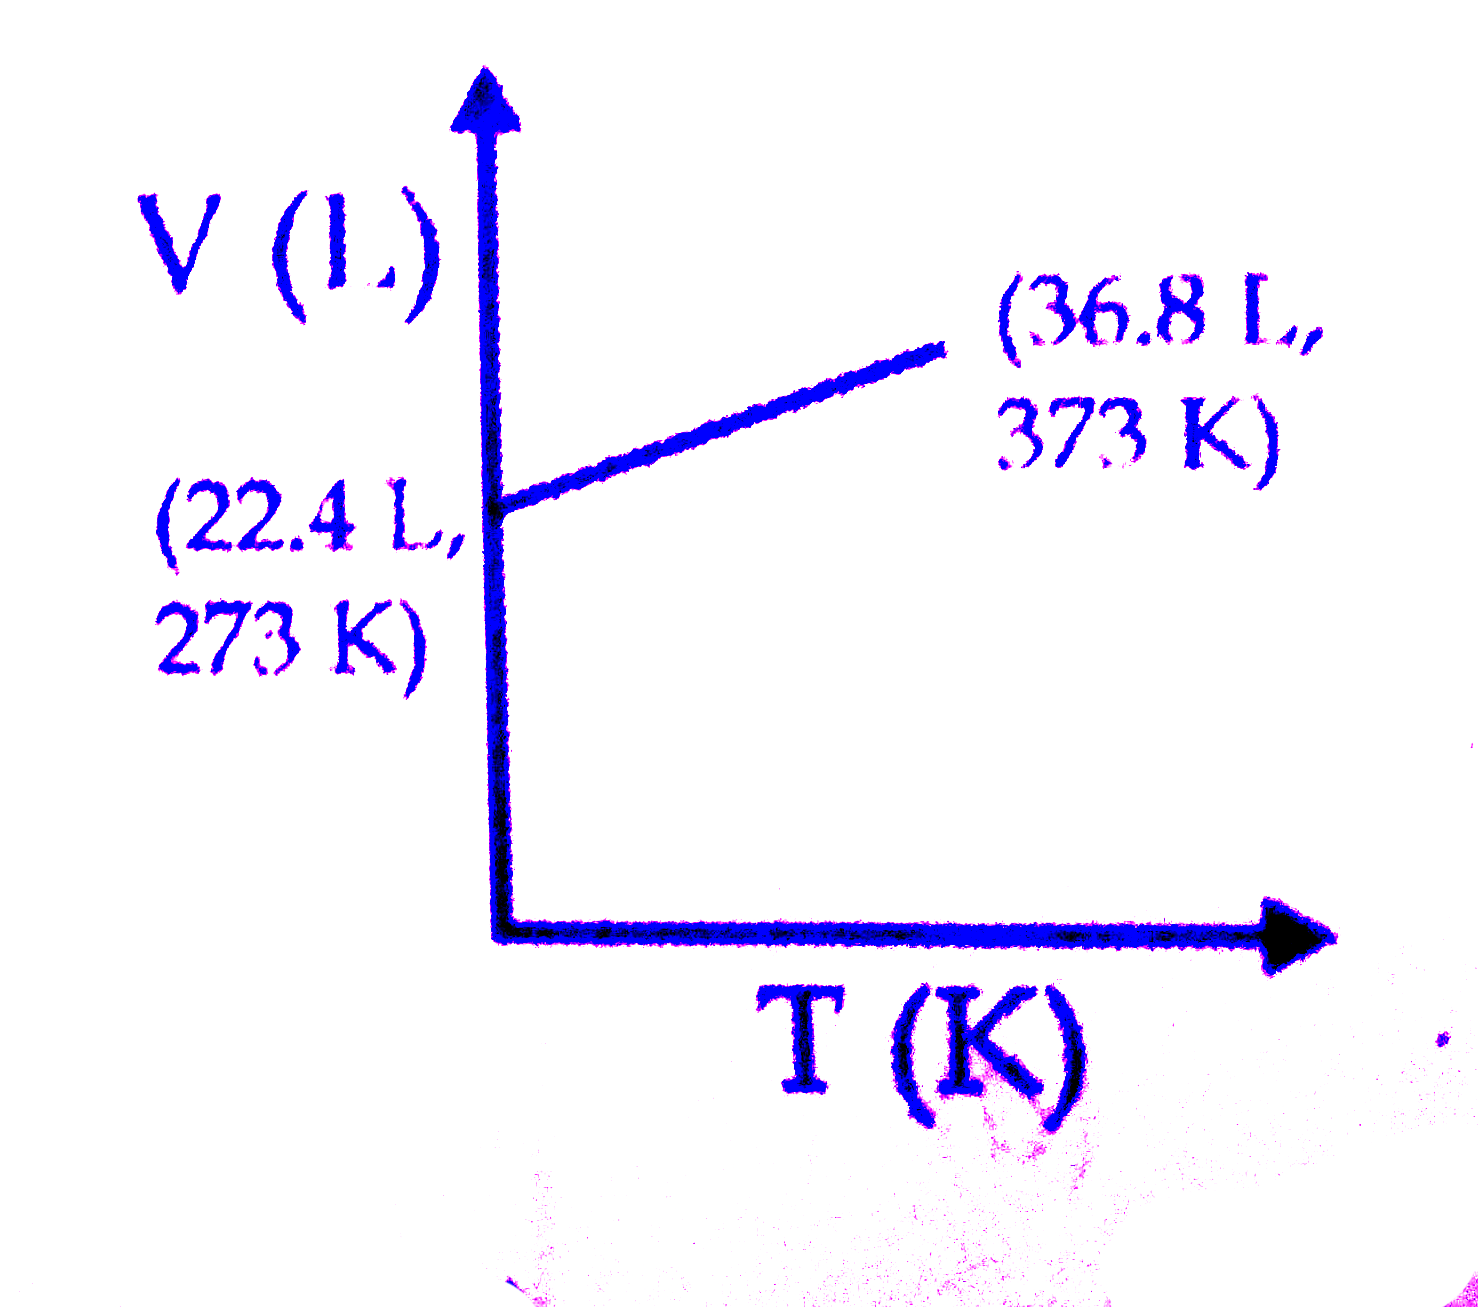 B
B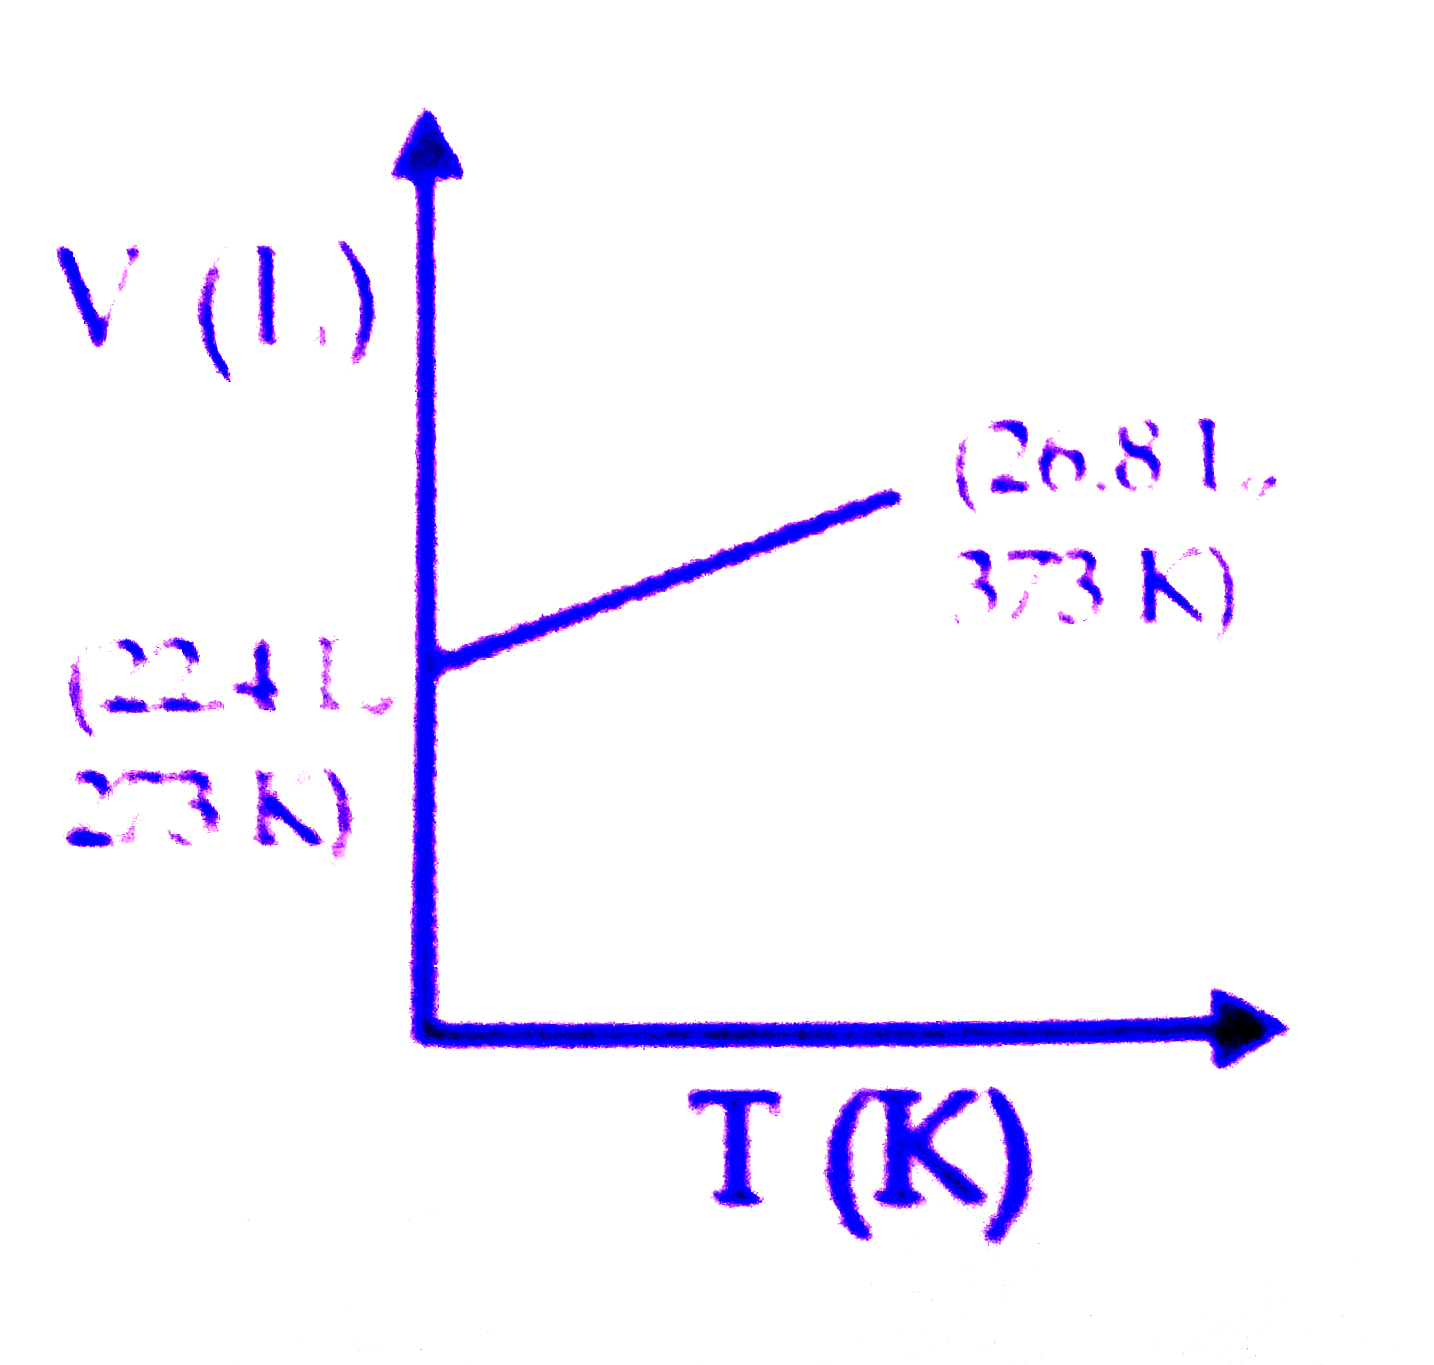 C
C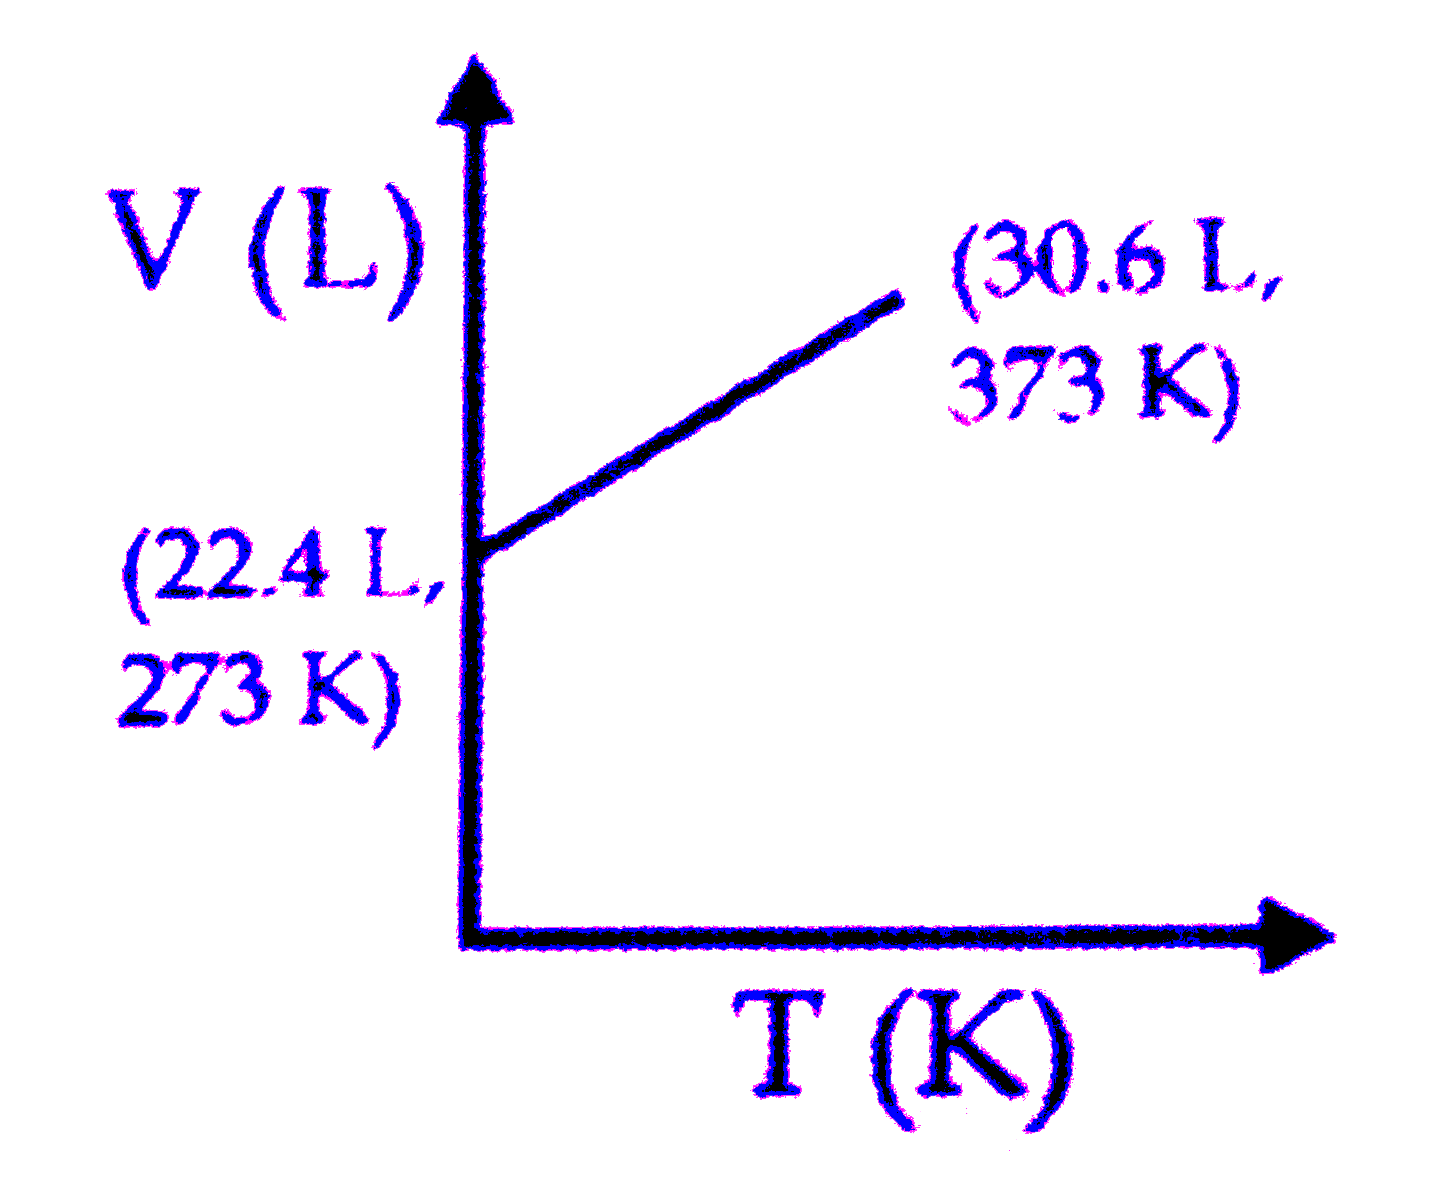 D
D
Which of the following volume (V)-temperature (T) plots represents the behaviour of one mole of an ideal gas at one atmoshperic pressure?
A B
B C
C D
D
Which one of the following volume (V)- temperature (T) plots represents the behaviour of one mole of an ideal gas at one atmosphere?
A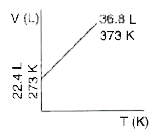 B
B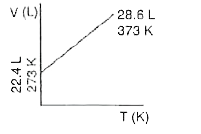 C
C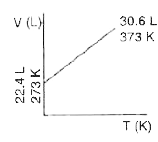 D
D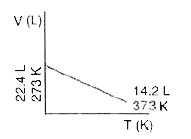
Which of the following is a correct plot of the volume of fixed amount of ideal gas as a function of temperature (at constant pressure)
View SolutionWhich of the following volume-temperature (V−I) plots represents the behaviour of 1mole of an ideal gas at the atmospheric pressure?
View SolutionWhich of the following is a correct plot of the volume of fixed amount of ideal gas as a function of temperature (at constant pressure)
View SolutionAt a constant pressure, of the following graphs that one which represents the variation of the density of an ideal gas with the absolute temperature T, is
View SolutionAt which one of the following temperature pressure conditions, the deviation of a gas from ideal behavior is expected to be minimum?
View Solution
