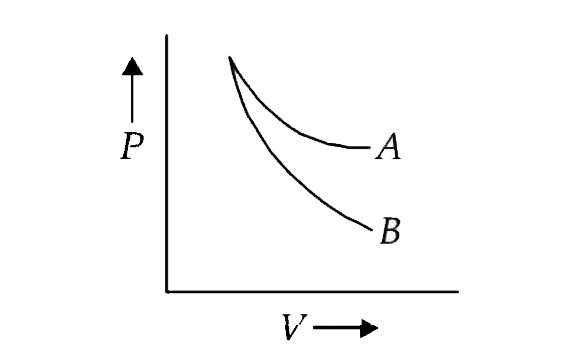
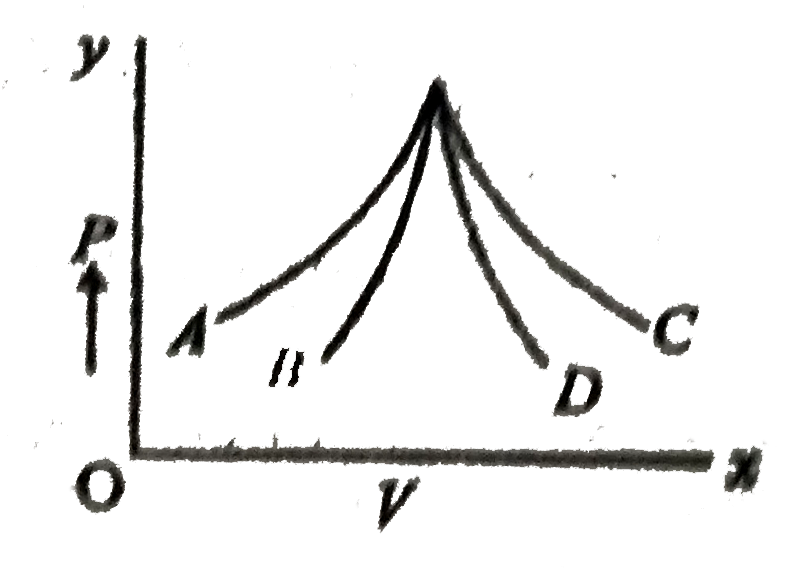
Four curves A,B,C and D are drawn in figure for a given amount of gas. The curve which represents adiabatic and isothermal changes, respectively, is
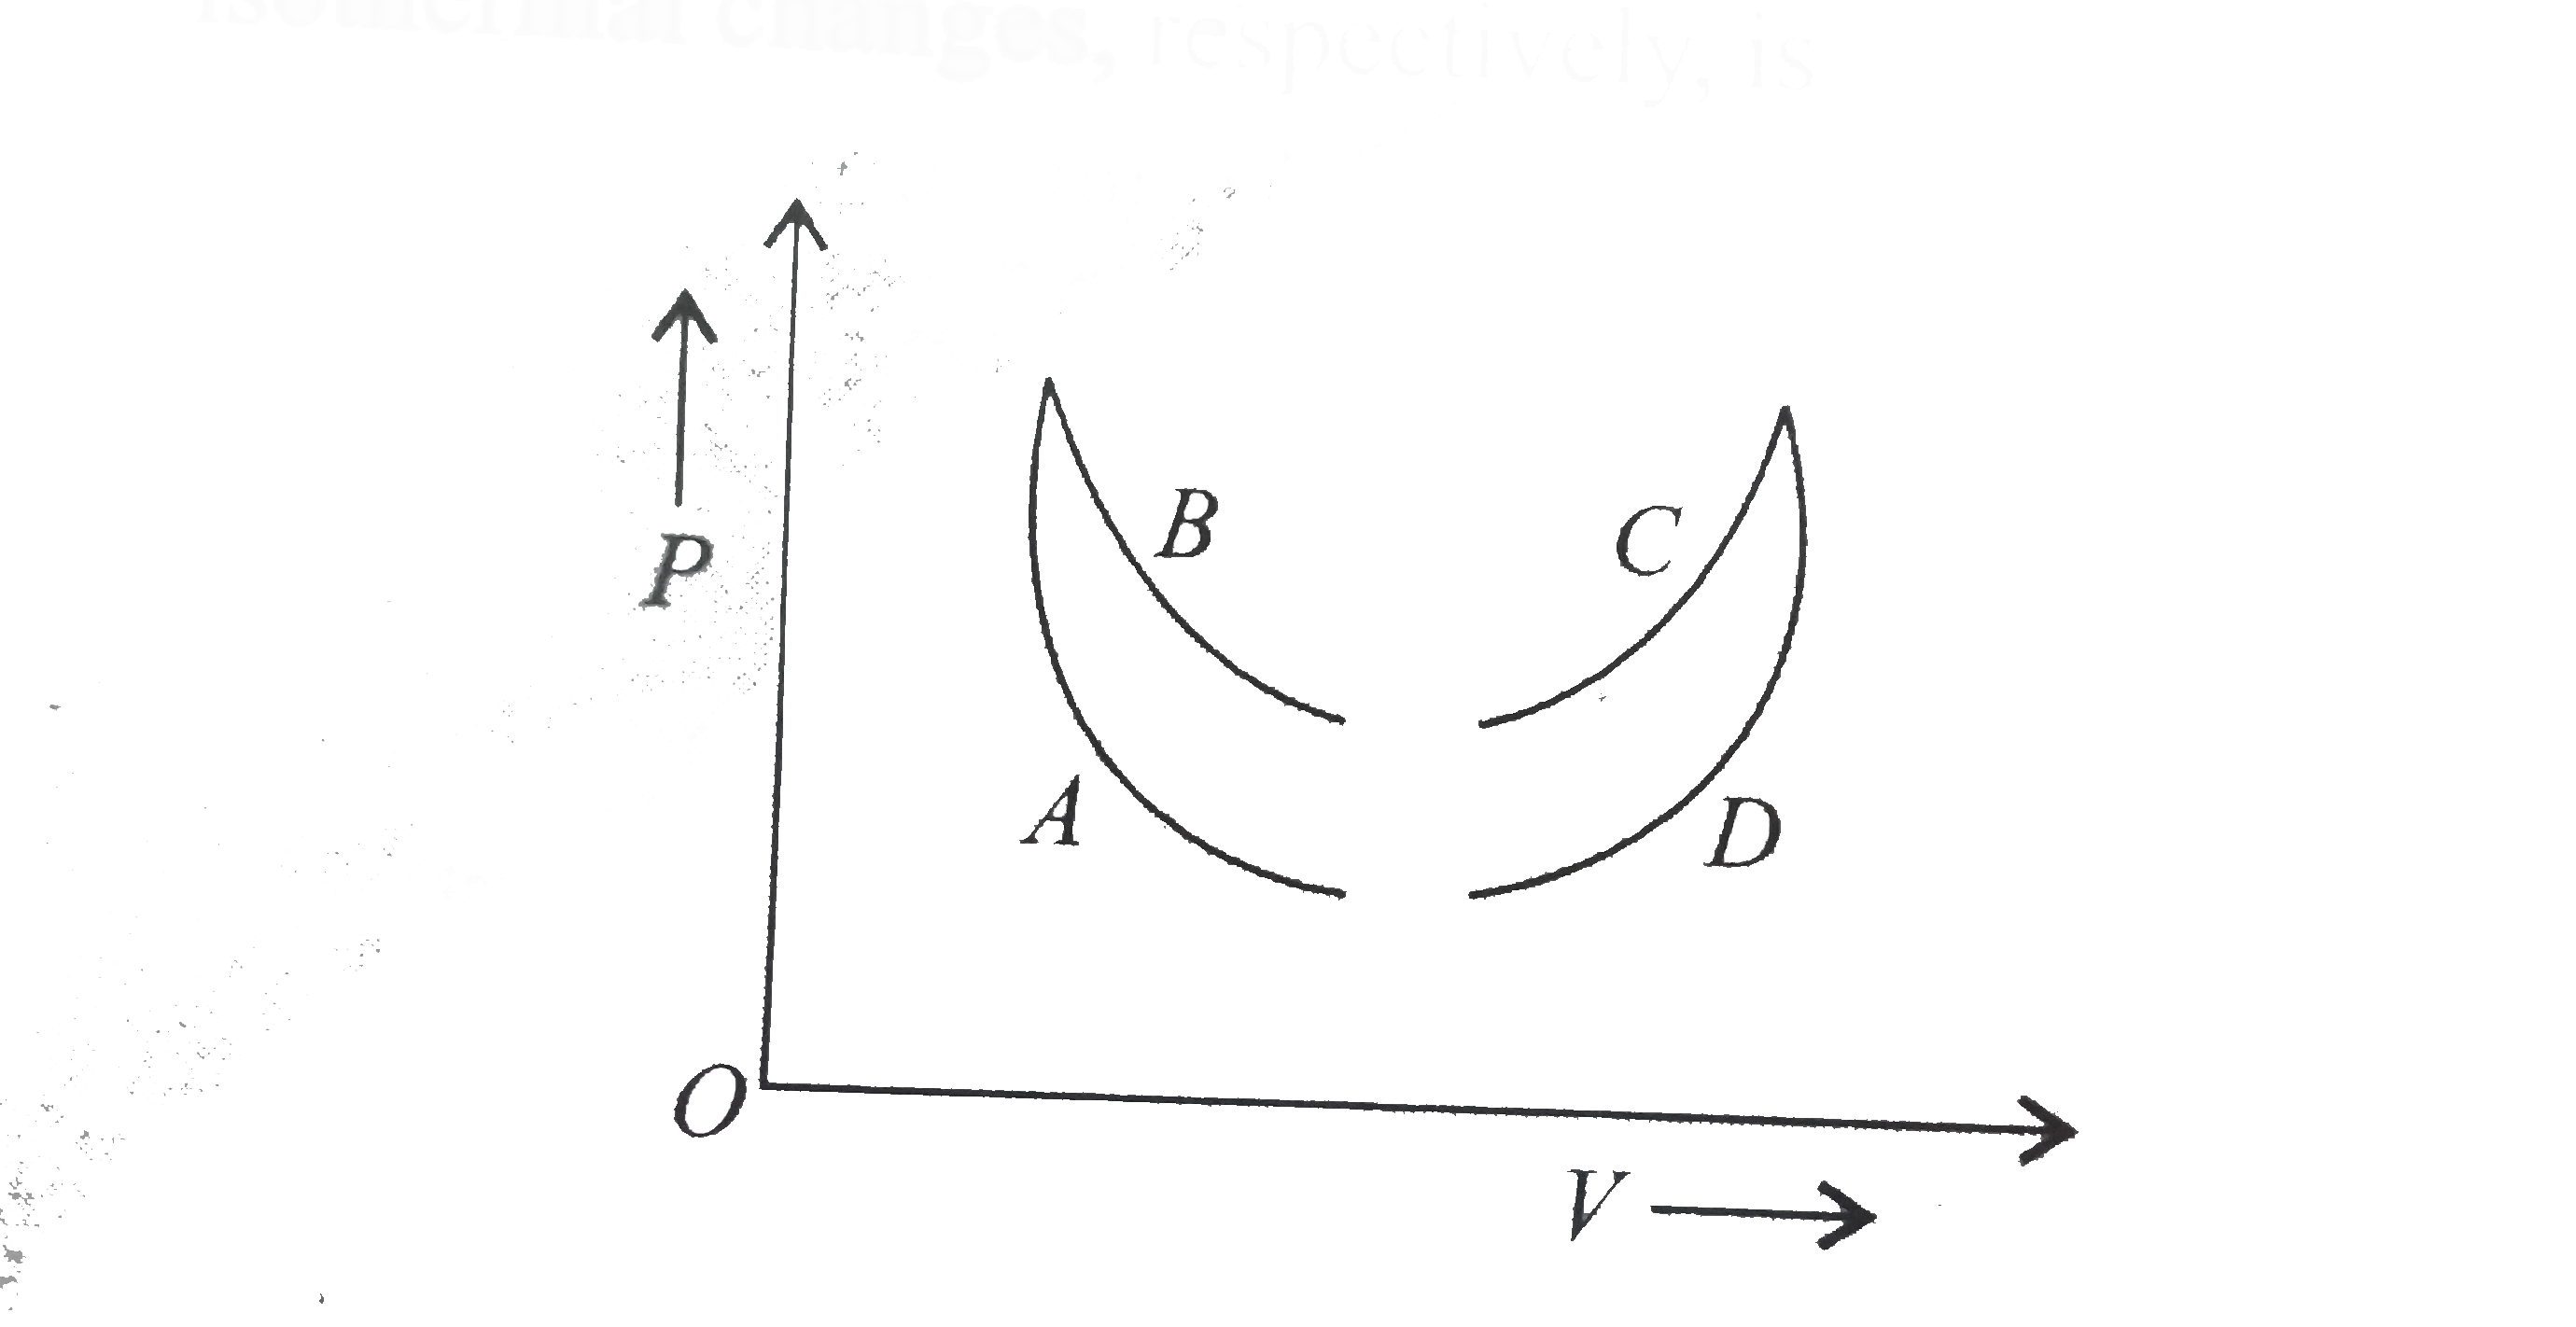
C and D respectively
D and C respectively
A and B respectively
B and A respectively
The correct Answer is:C
Step by step video, text & image solution for Four curves A,B,C and D are drawn in figure for a given amount of gas. The curve which represents adiabatic and isothermal changes, respectively, is by Physics experts to help you in doubts & scoring excellent marks in Class 12 exams.
Topper's Solved these Questions
- BOOK - TARGET PUBLICATIONCHAPTER - KINETIC THEORY OF GASES AND RADIATION EXERCISE - Competitive thinking187videos
KINETIC THEORY OF GASES AND RADIATION
- BOOK - TARGET PUBLICATIONCHAPTER - KINETIC THEORY OF GASES AND RADIATION EXERCISE - Evaluation test18videos
KINETIC THEORY OF GASES AND RADIATION
- BOOK - TARGET PUBLICATIONCHAPTER - KINETIC THEORY OF GASES AND RADIATION EXERCISE - Evaluation test18videos
KINETIC THEORY OF GASES AND RADIATION
- BOOK - TARGET PUBLICATIONCHAPTER - INTERFERENCE AND DIFFRACTIONEXERCISE - EVALUATION TEST20videos
INTERFERENCE AND DIFFRACTION
- BOOK - TARGET PUBLICATIONCHAPTER - MAGNETIC EFFECT OF ELECTRIC CURRENTEXERCISE - EVALUATION TEST19videos
MAGNETIC EFFECT OF ELECTRIC CURRENT
Similar Questions
Knowledge Check
- Question 1 - Select One
Four curves A,B,C and D are drawn in Fig. for a given amount of gas. The curves which represent adabatic and isothermal changes
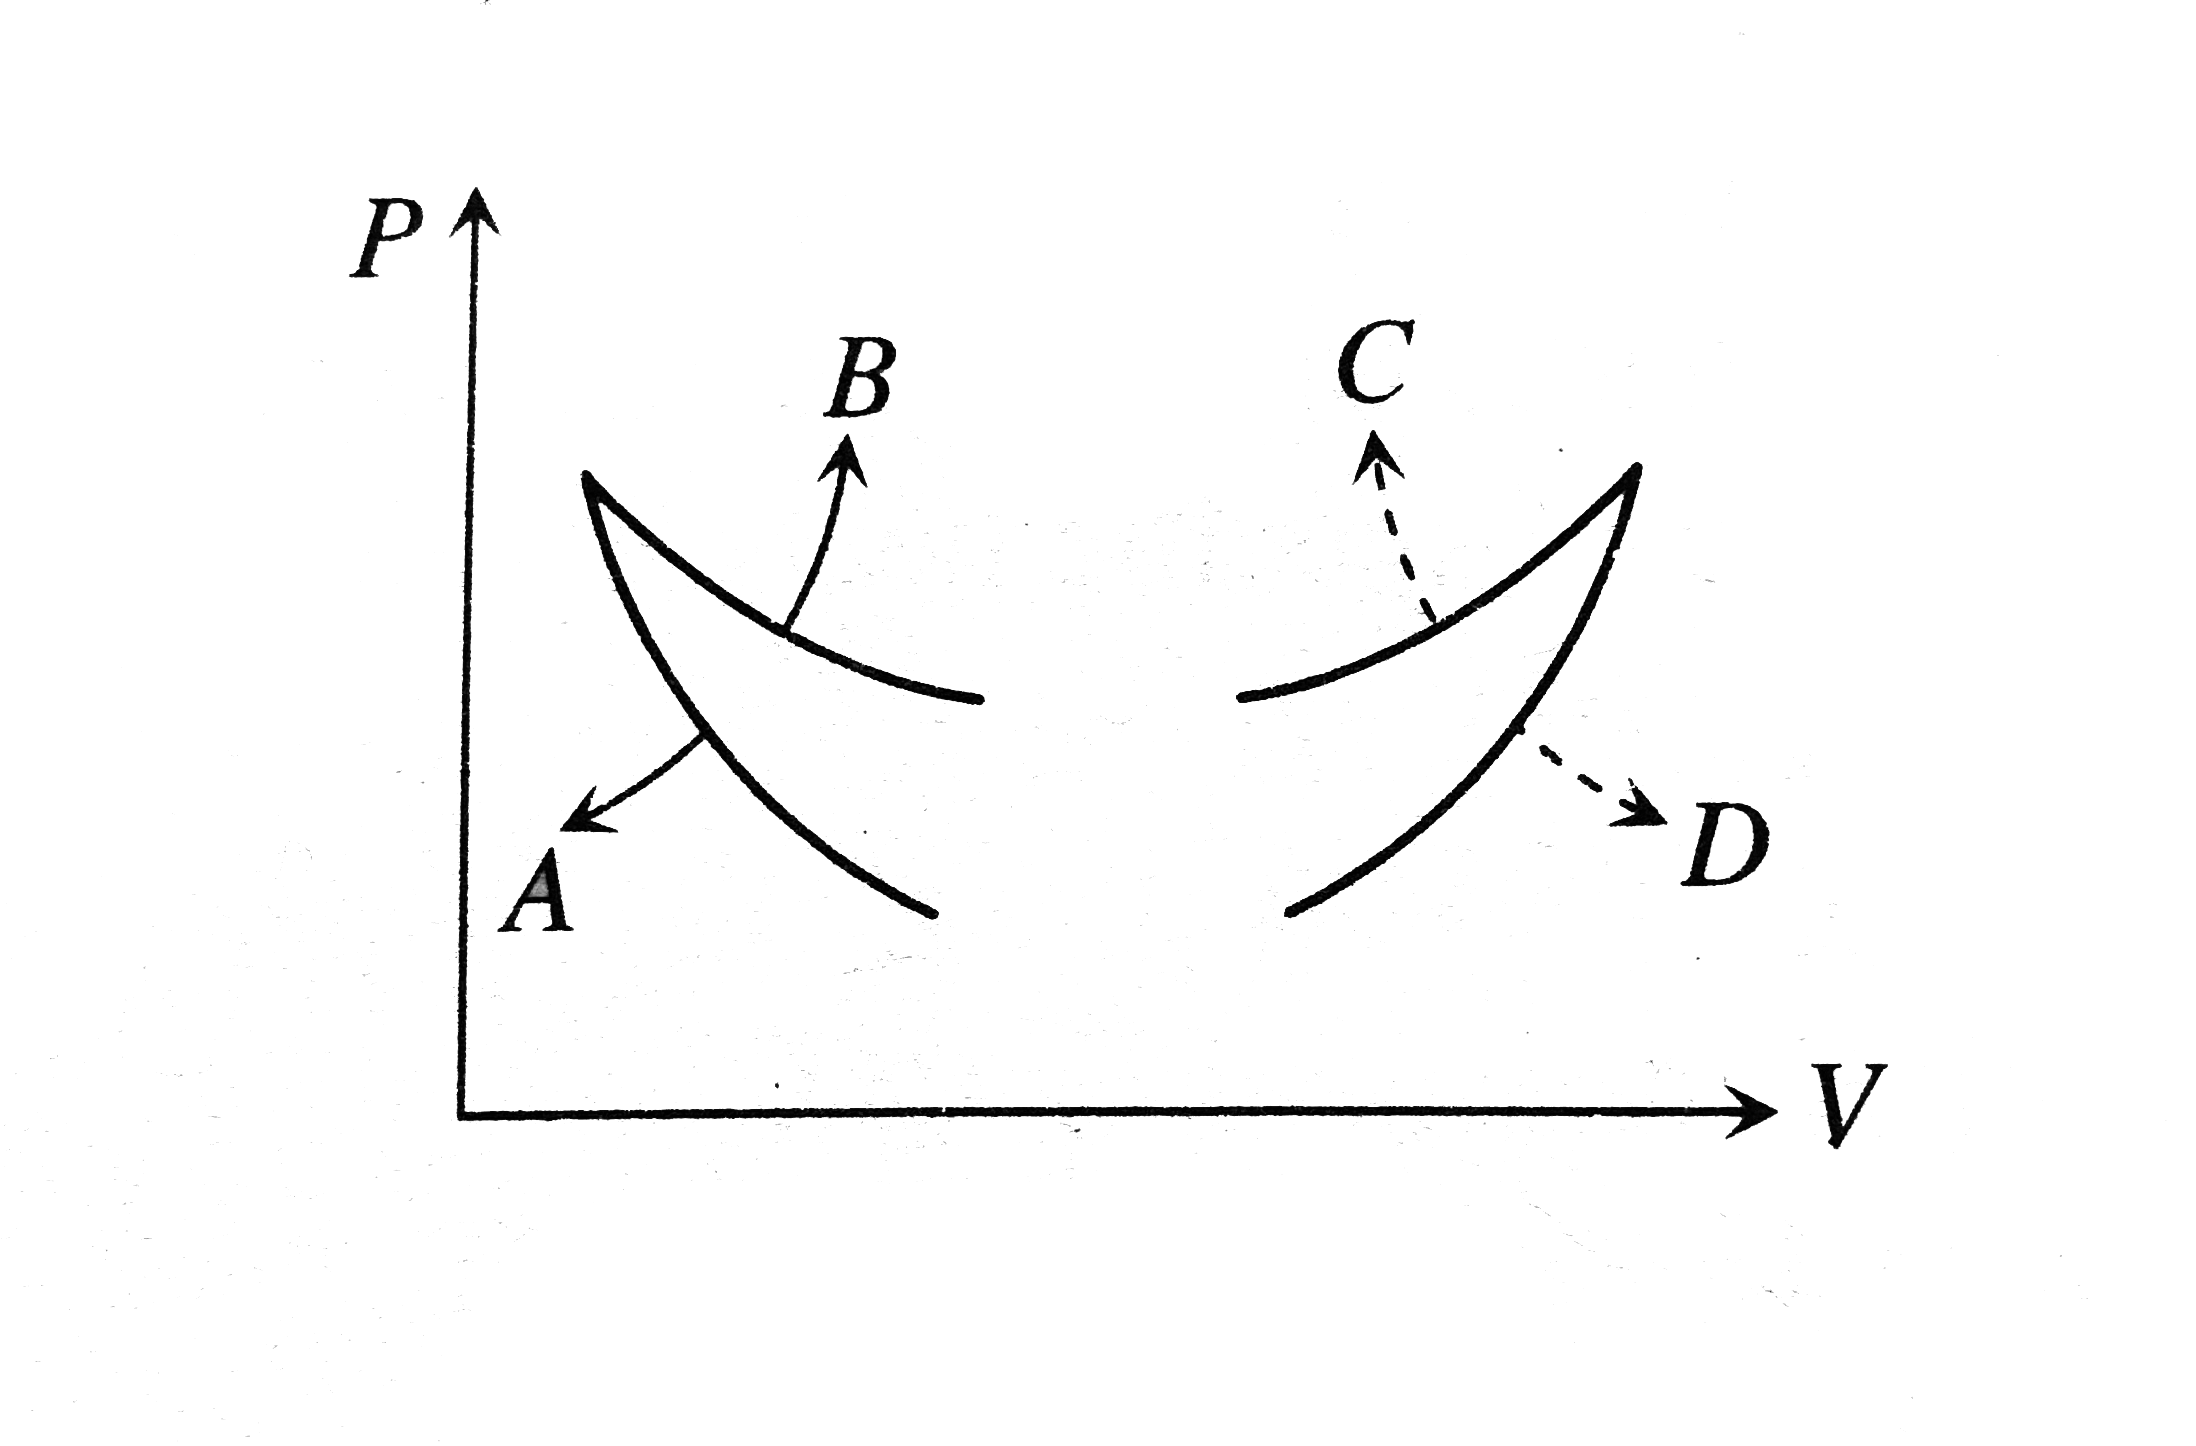 AC and D, respectivelyBD andC, respectivelyCA and B, respectivelyDB and A, respectively
 - Question 2 - Select One
Four curves A,B,C and D are drawn in Fig. for a given amount of gas. The curves which represent adiabatic and isothermal changes
 AC and D respectivelyBD and C respectivelyCA and B respectivelyDB and A respectively
 - Question 3 - Select One
In the given graph, adiabatic and isothermal curves are shown. Then,
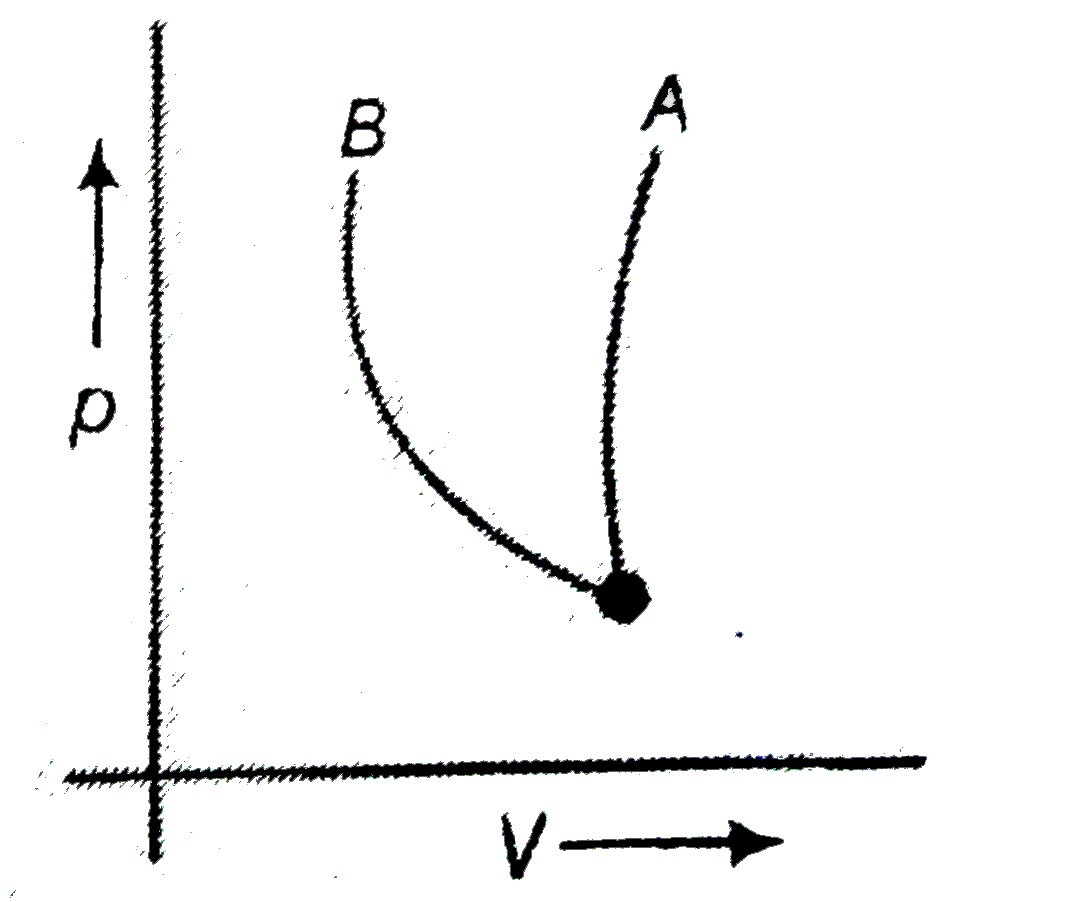 Athe curve A is isothermalBthe curve B is isothermalCthe curve A is adiabaticDthe curve B is adiabatic
In the following figure, four curves A,B, C and D are shown. The curves are
 View Solution
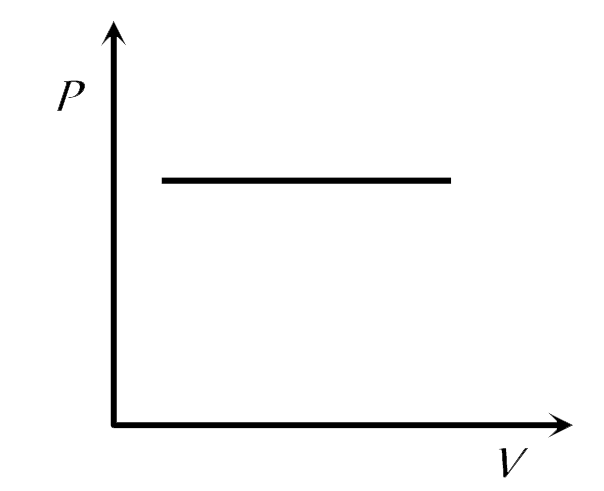
Which of the following P-V curve best represents. As isothermal process?
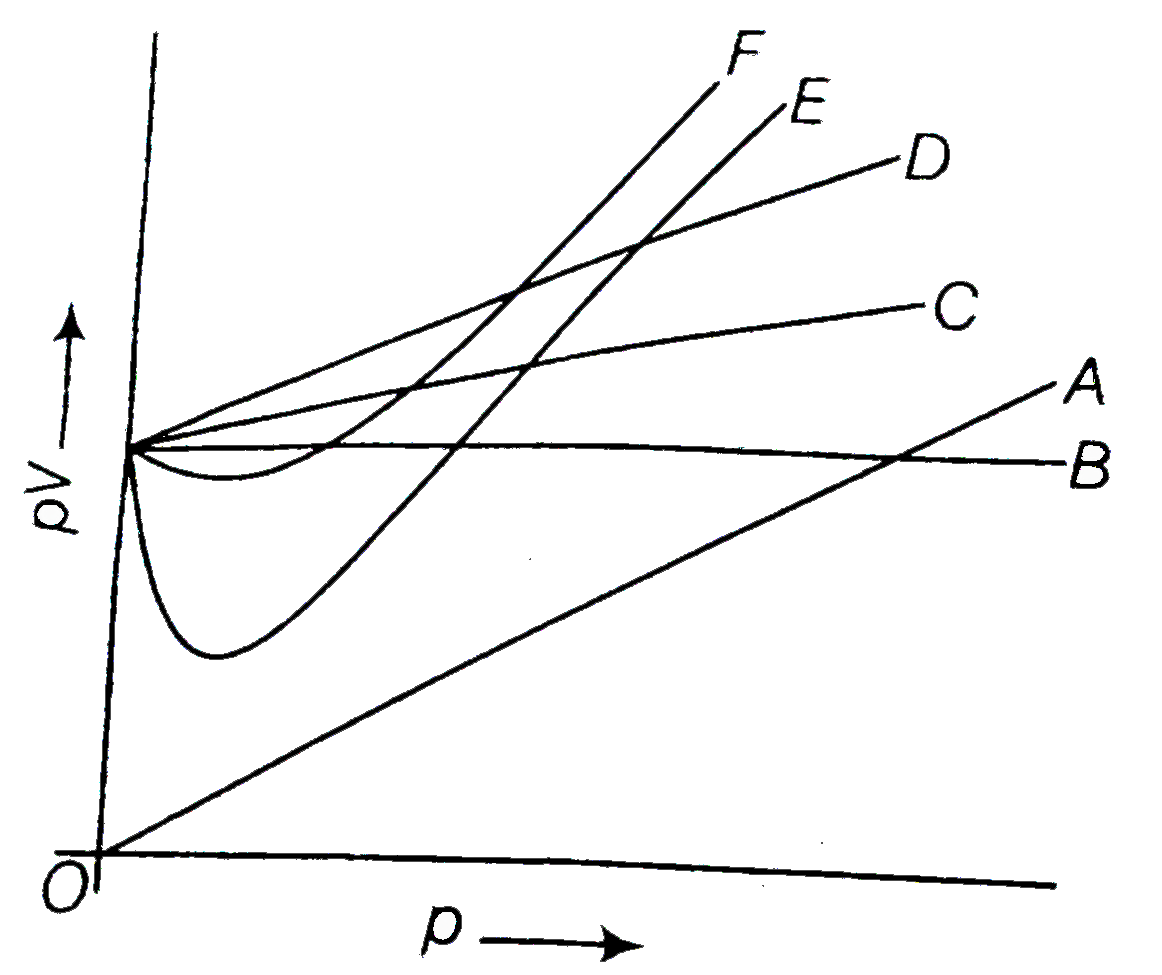
View SolutionWhich curve in figure represents the curve of ideal gas?
 View Solution
Which curve in figure represents the curve of ideal gas ?
 View Solution
Figure shows four PV diagrams. Which of these curves represent isothermal and adiabatic processes?
 View Solution


