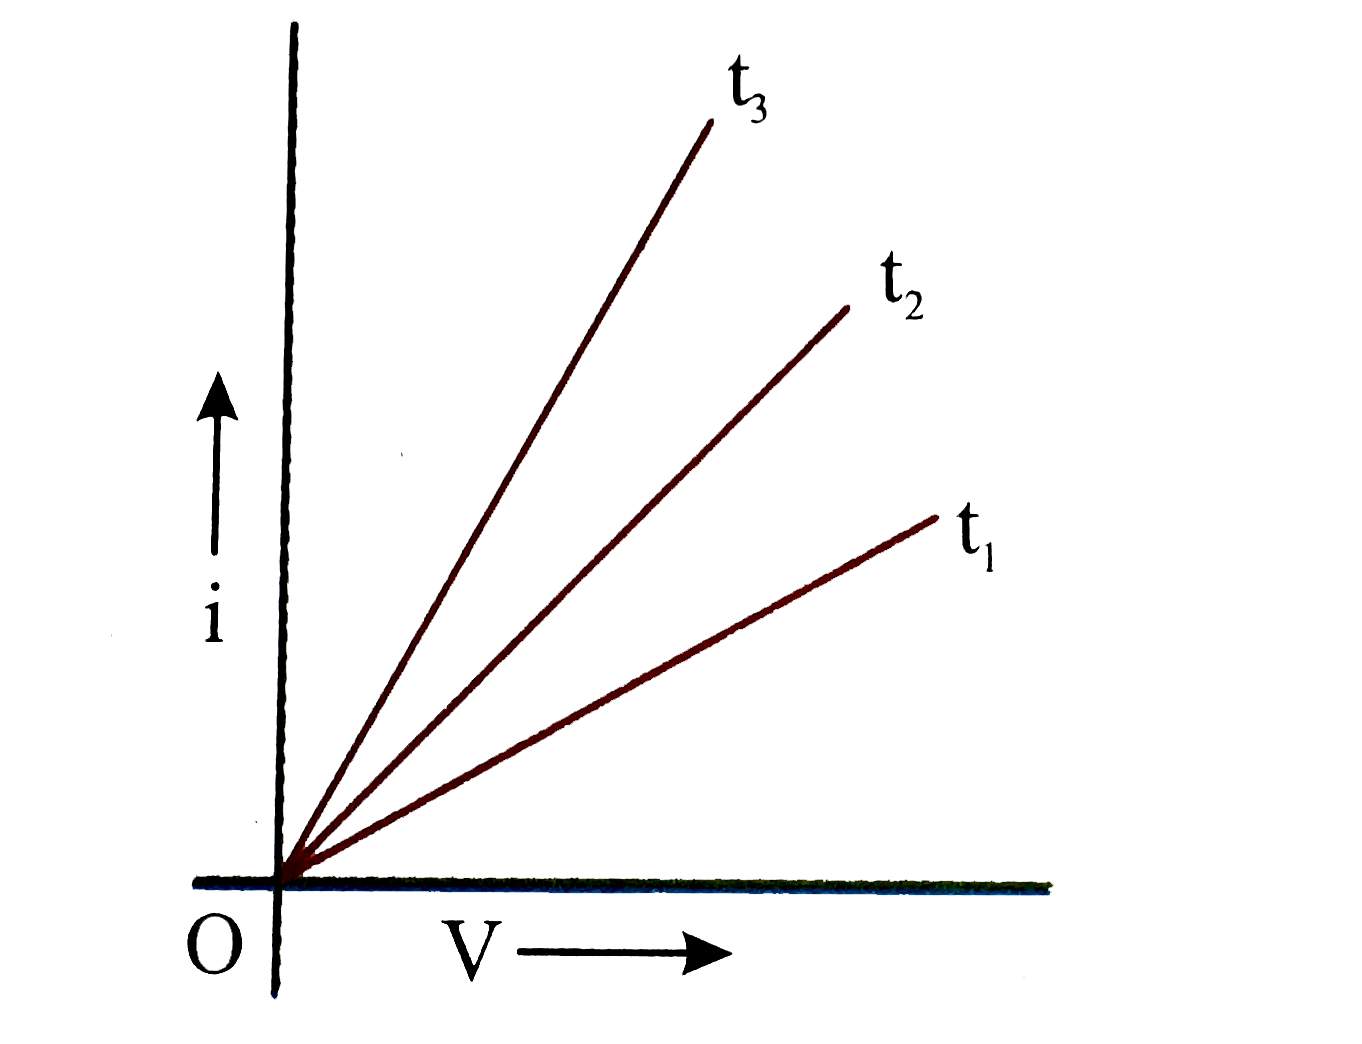
V−i graphs of anichrome wire at three different temeperatures t1, t2 and t3 are shown. From the graph.
t1<t2<t3
t1>t2>t3
t1<t2>t3
t1>t2<t3
The correct Answer is:B
Slope =iV=1R= conductance (G)
Topper's Solved these Questions
- BOOK - NARAYNACHAPTER - EXPERIMENTAL PHYSICSEXERCISE - Level-v(Single answer)23videos
EXPERIMENTAL PHYSICS
- BOOK - NARAYNACHAPTER - EXPERIMENTAL PHYSICSEXERCISE - Multiple answer6videos
EXPERIMENTAL PHYSICS
- BOOK - NARAYNACHAPTER - ELECTROSTATICS AND GAUSS LAWEXERCISE - Intergers type question11videos
ELECTROSTATICS AND GAUSS LAW
- BOOK - NARAYNACHAPTER - MAGNETISMEXERCISE - LEVEL-II (H.W)24videos
MAGNETISM
Similar Questions
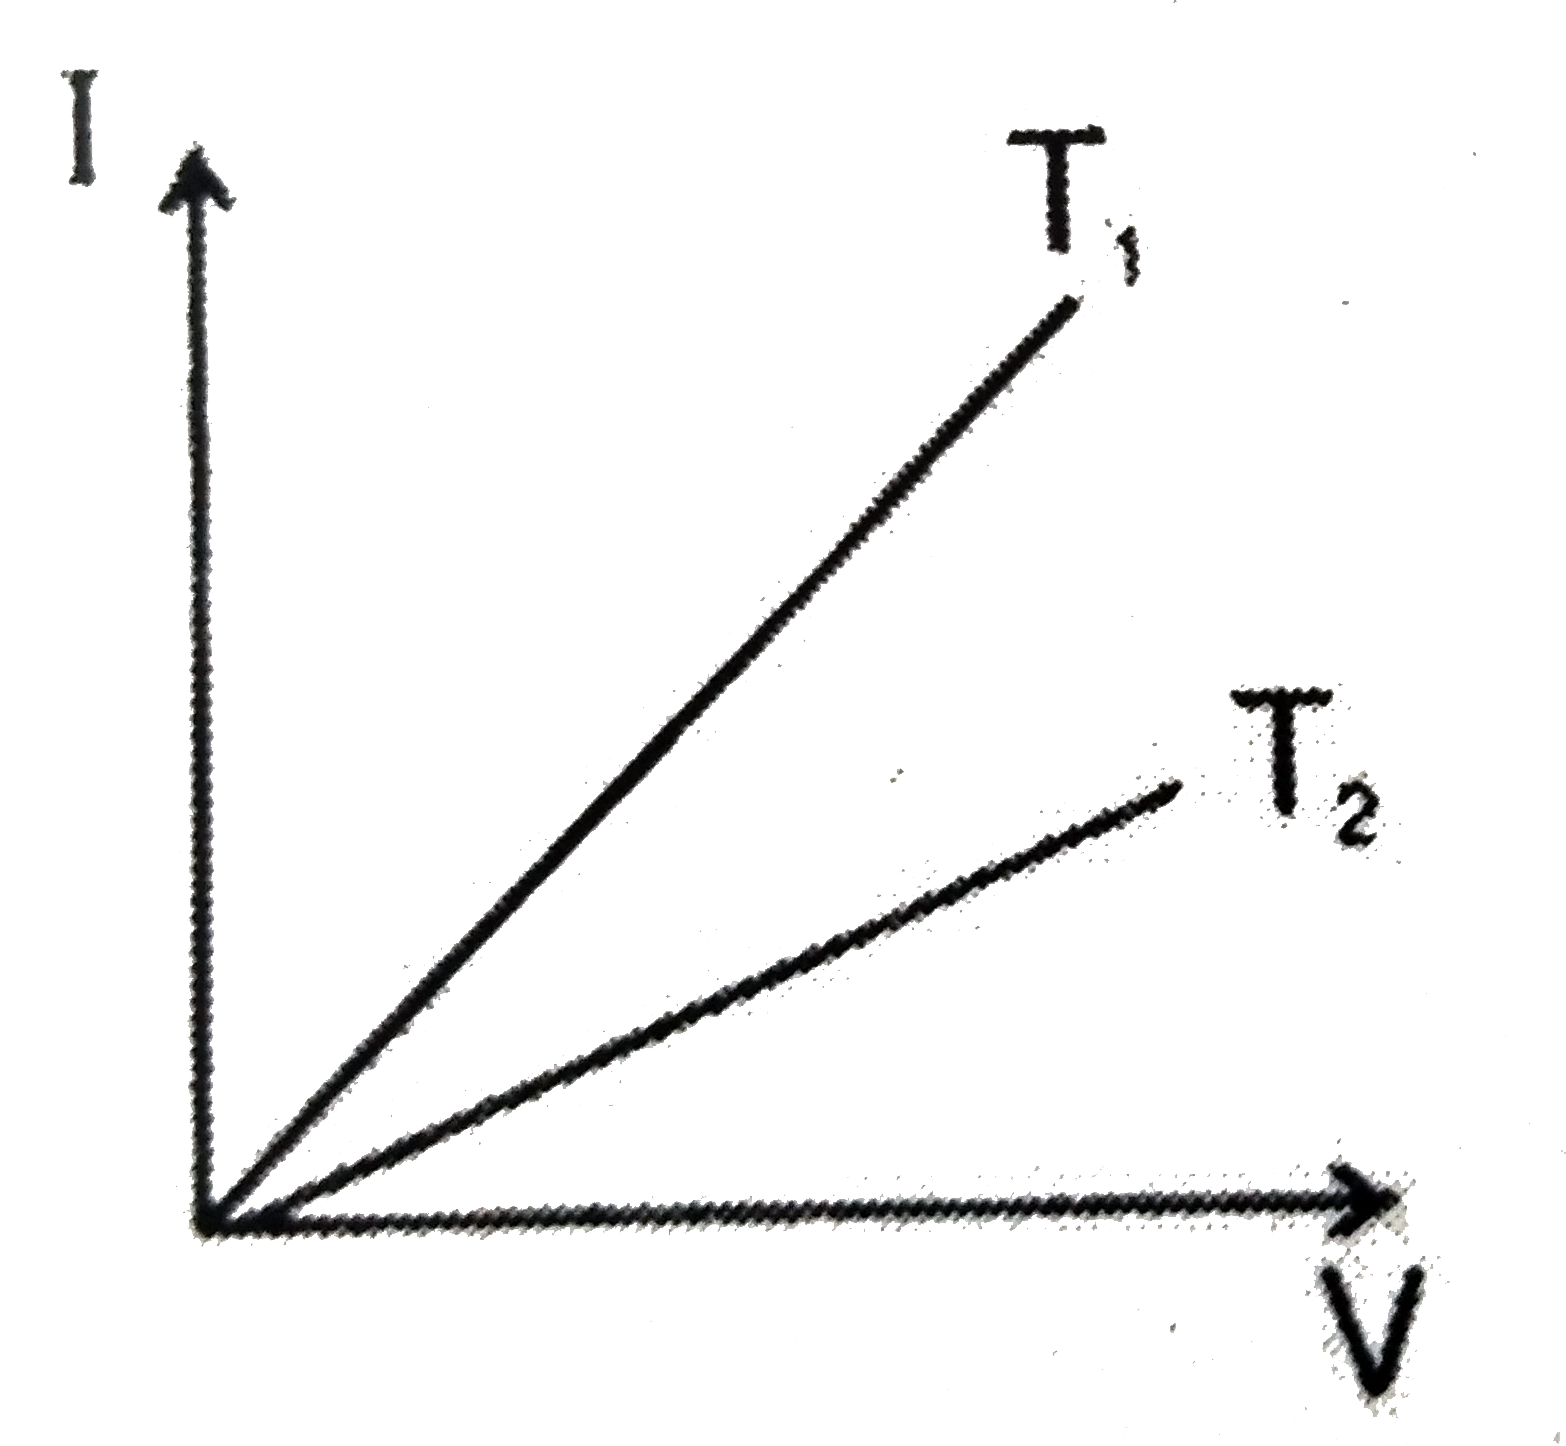
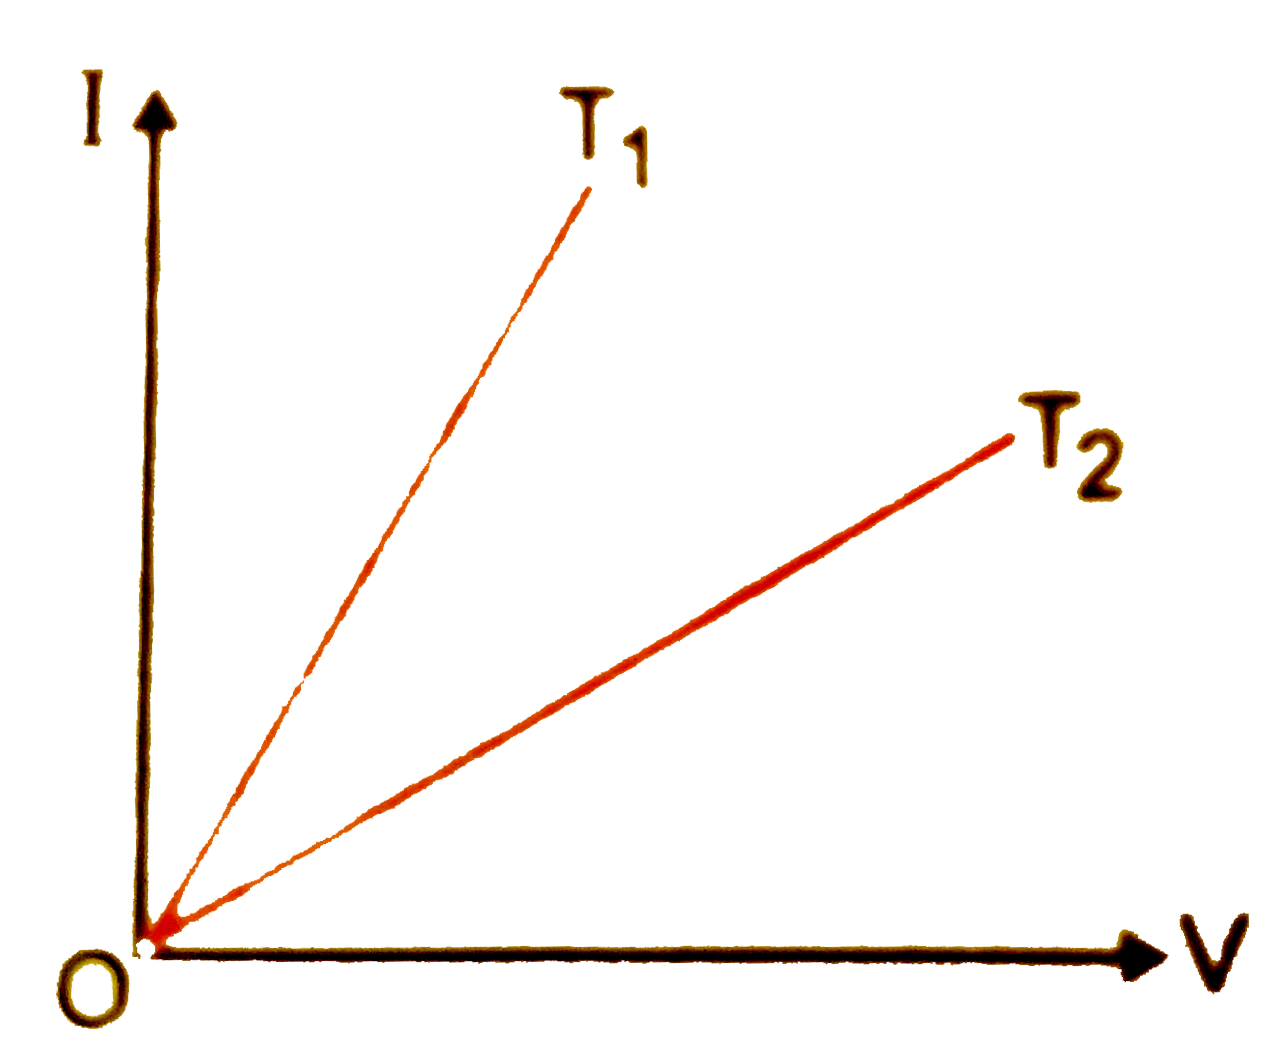
The current-coltage graphs for a given metallic wire at two differenct tempeature T1 and T2 are shown in the figure. Which one is higher, T1 or T2
 View Solution
The current - voltage graphs for a given metallic wire at two different temperatures T1andT2 are shown in the figure.
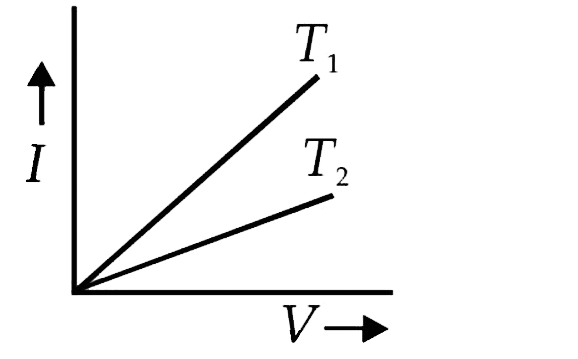
The temperature T2 is greater than T1.View Solution
Knowledge Check
- Question 1 - Select One
The current (I) and voltage (V) graphs for a given metallic wire at two different temperature (T1) and (T2) are shown in fig. It is concluded that
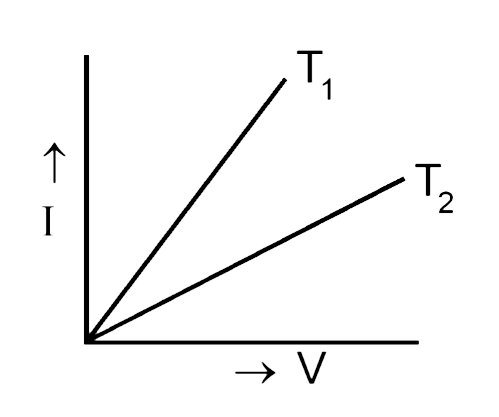 AT1=T2BT1>T2CT1<T2DNone of these
 - Question 2 - Select One
The current (I) and voltage (V) graphs for a given metallic wire at two different temperature (T1) and (T2) are shown in fig. It is concluded that
 AT1>T2BT1<T2CT1=T2DT1=2T2
 - Question 3 - Select One
The voltage V and current I v graphs for a conductor at two different temperatures T1andT2 are shown in the figure. The relation between T1andT2 is
 AT1>T2BT1<T2CT1=T2DT1=1T2
V- I graph for a metallic wire at two different temperature T1 and T2 is shown in figure. Which of the two temperature is higher and why?
 View Solution
I-V graph for a metallie wire at two different tempearture, T1andT2 is as shown in the figure. Which of the two temperatures is lower and why ?
 View Solution
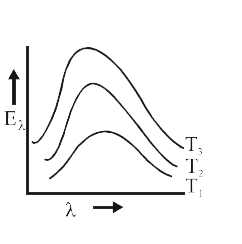
If for a black body the graph of change is emissive power at different temperatures T1,T2andT3 with wavelength is according to the figure then –
 View Solution
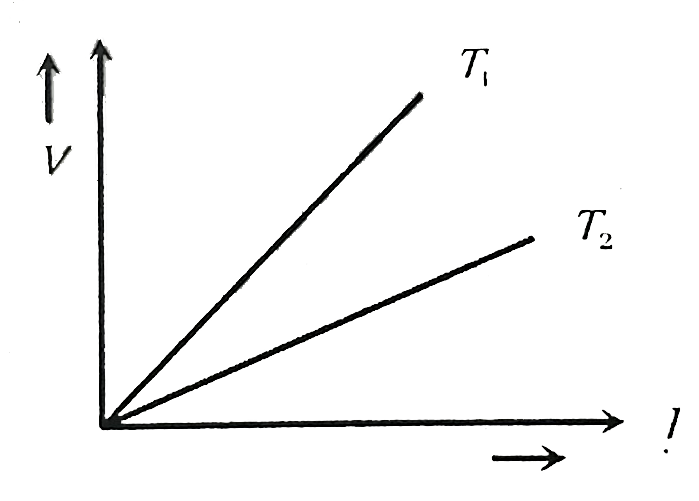
The voltage V and current I graph for a conductor at two different temperatures T1 and T2 are shown in the figure. The relation between T1 and T2 is
 View Solution
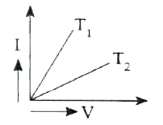
The current I and voltage V variations for a given metallic wire at tow different temperature T1andT2 are shown in the figure. Then which one of the following is correct
 View Solution

