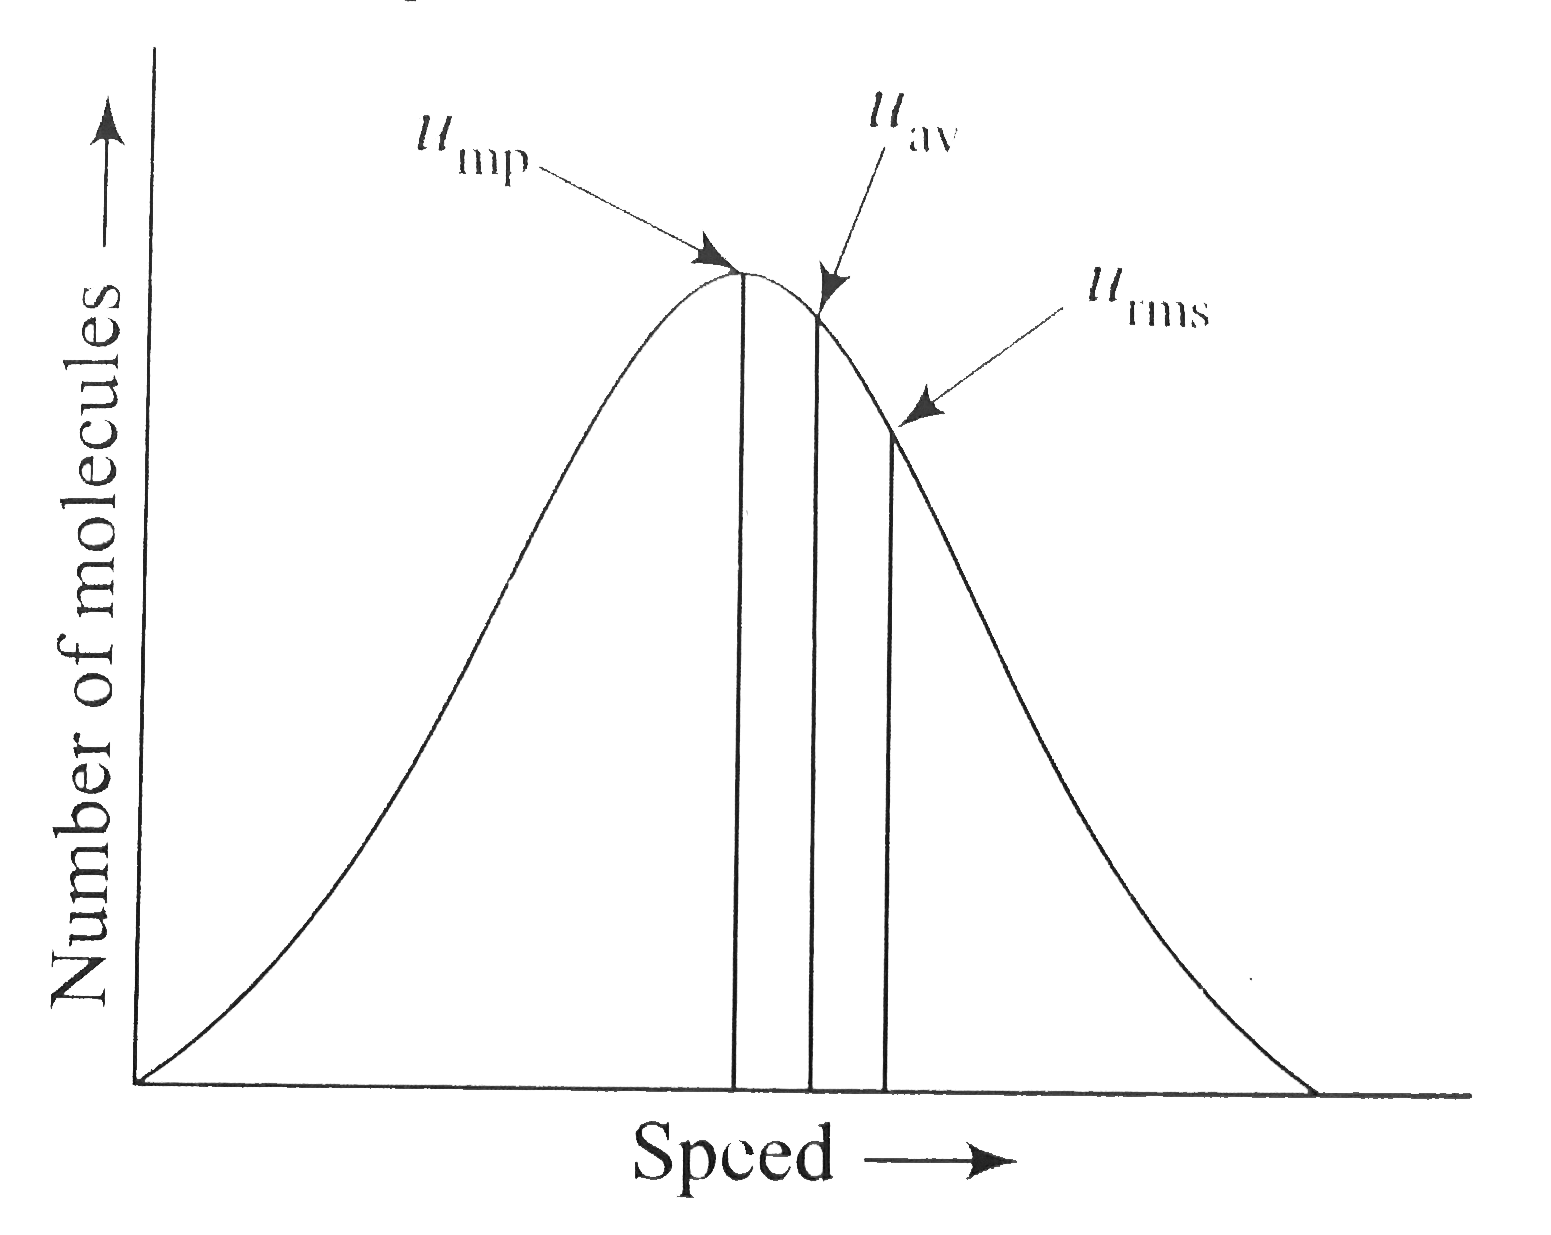
The maximum in the curves describing the Maxwell-Boltzmann distribution of speeds corresponds to
A
root mean square speed
B
mean square speed
C
average speed
D
most probable speed
Video Solution
Text Solution
The correct Answer is:D
The maximum in the curve represents the speed possessed by the maximum number of molecules. This speed is called the most probable speed.

The graph shows that when T is neither high nor low , the number of molecules possessing very high and very low speed is very small. Most of the molecules possess most probable speed.
|
Updated on:21/07/2023
Topper's Solved these Questions
- BOOK - R SHARMACHAPTER - STATES OF MATTEREXERCISE - Follow -up Test 814videos
STATES OF MATTER
- BOOK - R SHARMACHAPTER - STATES OF MATTEREXERCISE - Follow -up Test 98videos
STATES OF MATTER
- BOOK - R SHARMACHAPTER - STATES OF MATTEREXERCISE - Follow -up Test 613videos
STATES OF MATTER
- BOOK - R SHARMACHAPTER - SOME BASIC CONCEPTS OF CHEMISTRYEXERCISE - Archives26videos
SOME BASIC CONCEPTS OF CHEMISTRY
- BOOK - R SHARMACHAPTER - STRUCTURE OF ATOMEXERCISE - ARCHIVES55videos
STRUCTURE OF ATOM
Similar Questions
Knowledge Check
- Question 1 - Select One or More
According to Maxwell Boltzmann distribution of energy
Athe fraction of molecules with most probable kinetic energy decrease at higher temperaturesBthe fraction of molecules with most probable kinetic energy increases at higher temperaturesCmost probable kinetic energy decreases at higher temperaturesDmost probable kinetic energy decreases at higher temperatures. - Question 2 - Select One or More
According to Maxwell Boltzmann distribution of energy
Athe fraction of molecules with most probable kinetic energy decreases at higher temperaturesBthe fraction of molecules with most probable kinetic energy increases at higher temperaturesCmost probable kinetic energy increases at higher temperaturesDmost probable kinetic energy decreases at higher temperatures. - Question 3 - Select One or More
In the graph showing Maxwell Boltzmann distribution of energy ................ .
Aarea under the curve must not change with increase in temperatureBarea under the curve increases with increases in temperatureCarea under the curve decreases with increase in temperatureDwith increase in temperature curve broadens and shifts to the right hand side.
In the graph showing Maxwell Boltzman distribution of energy, ________.
View SolutionAccording to Maxwell , Boltzmann distriubtion of energy ……… .
View SolutionIn the graph showing Maxwell, Boltzmann distribution of energy ……….. .
View SolutionMaxwell distribution is true when
View SolutionThe speed corresponding to the peak of Maxwell-Boltzmann molecular distribution curve is
View Solution

