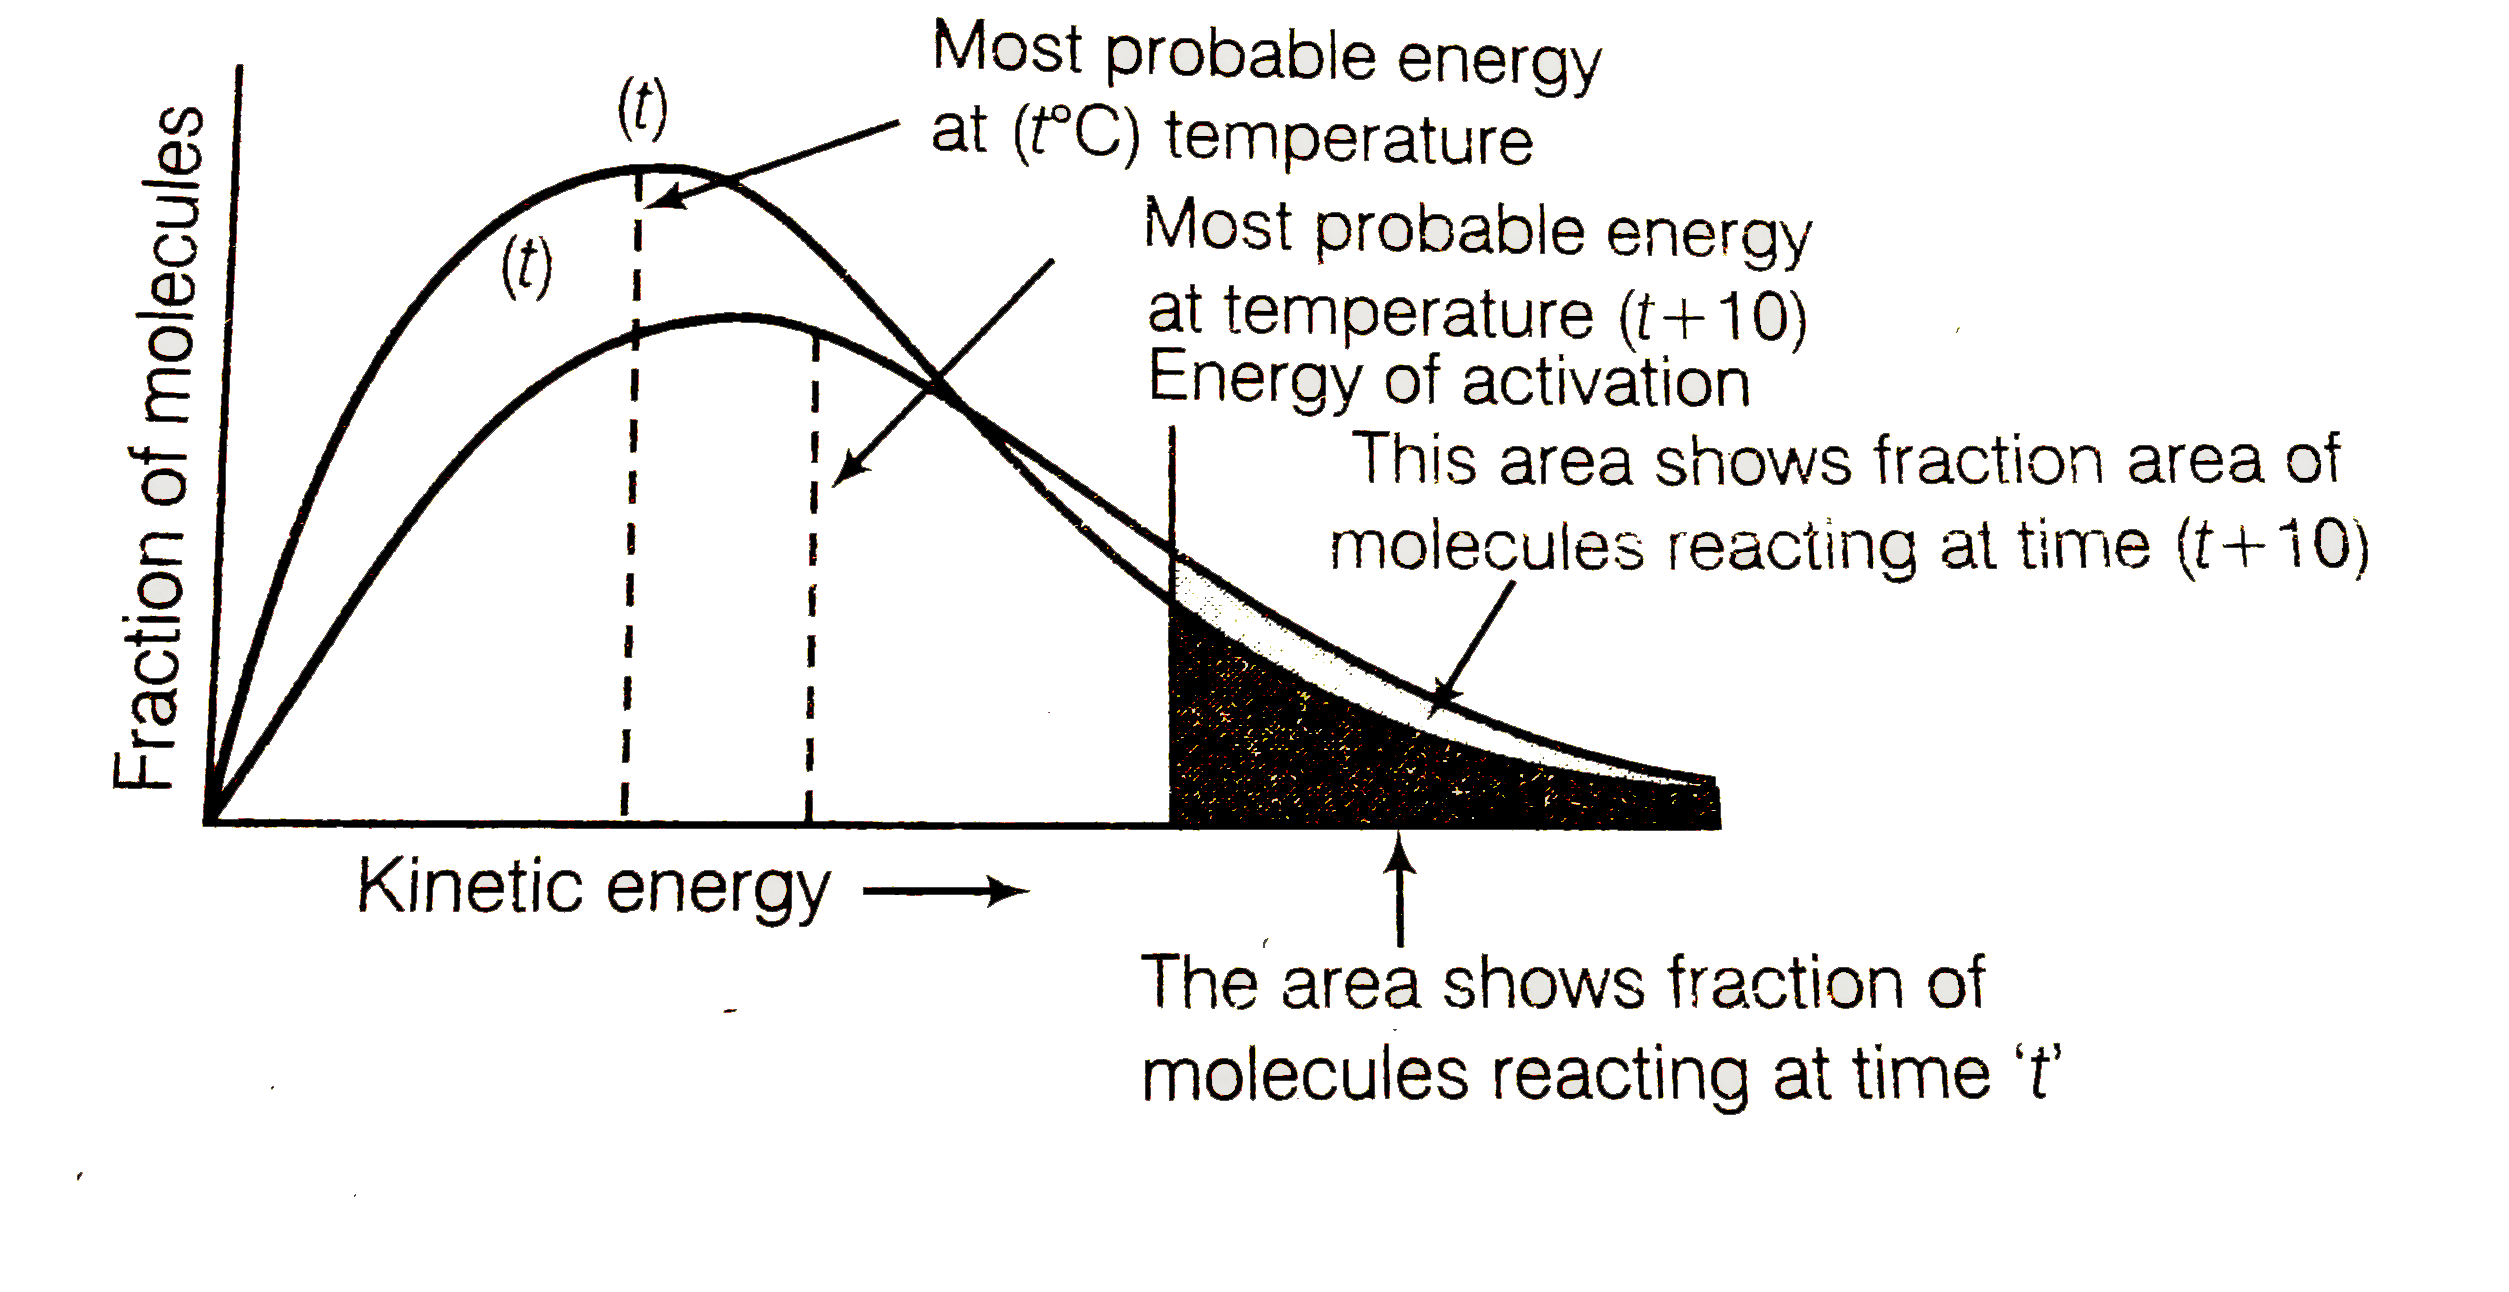
In the graph showing Maxwell, Boltzmann distribution of energy ……….. .
A
area under the curves must not change with increase in temperature
B
area under the curve increase with increase in temperature
C
area under the curve decrease with increase in temperature
D
with increase in temperature curve boradens and shifts to the right hand side
Video Solution
Text Solution
The correct Answer is:A, D
According to Maxwell Boltzman distribution curve, area under the curve must not change with increase in temperature. But with increase in temperature curve broadens and shift towards right hand side due to decrease in fraction of molecules having most probable kinetic energy .

|
Updated on:21/07/2023
Topper's Solved these Questions
Similar Questions
Knowledge Check
- Question 1 - Select One or More
According to Maxwell , Boltzmann distriubtion of energy ……… .
Athe fraction of moleucles with most probable kinetic enegy decreases at higher temperaturesBthe fraction of moleucles with most probable kinetic enegy increases at higher temperaturesCmost probable kinetic energy increases at higher temperatureDmost probable kinetic energy decreases at higher temperature - Question 2 - Select One or More
For a complex reaction ……… .
AOrder of overall reaction is same as molecularity of the slowest stepBOrder of overall reaction is less than the molecularity of the slowest stepCorder of overall reacticn is greater than molecularity of the slowest stepDmolecularity of the slowest step is never zero or non-integer - Question 3 - Select One
The role of a catalyst is to change……….
AGibbs energy of reactionBenthalpy of reactionCactivation energy of reactionDequilibrium constant
In a plant cell DPD is zero when it is ………..
View SolutionActivation energy of a chemial reaction can be determined by …….. .
View SolutionHydrogen peroxide is ……..
View SolutionThe value of rate constant of a pseudo first order reaction
View SolutionHydrogen peroxide is obtained by the electrolysis of ………
View Solution

