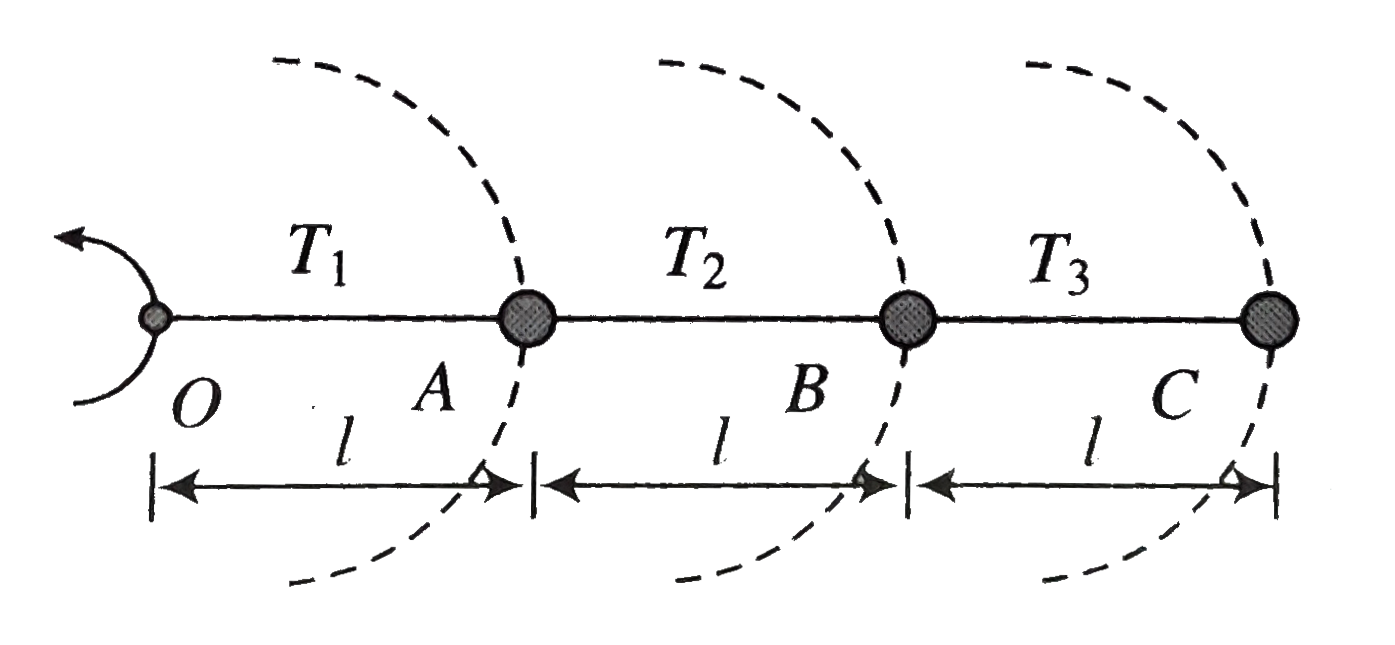
Three identical particles are joined together by a thread as shown in figure All the partical are moving in a horizontal plane If the vertical of the outermost particle is v0 then the ratio of tension in the three sections of the string (T1:T2:T3=?) is
3:5:6
3:4:5
6:9:10
7:6:11
The correct Answer is:C
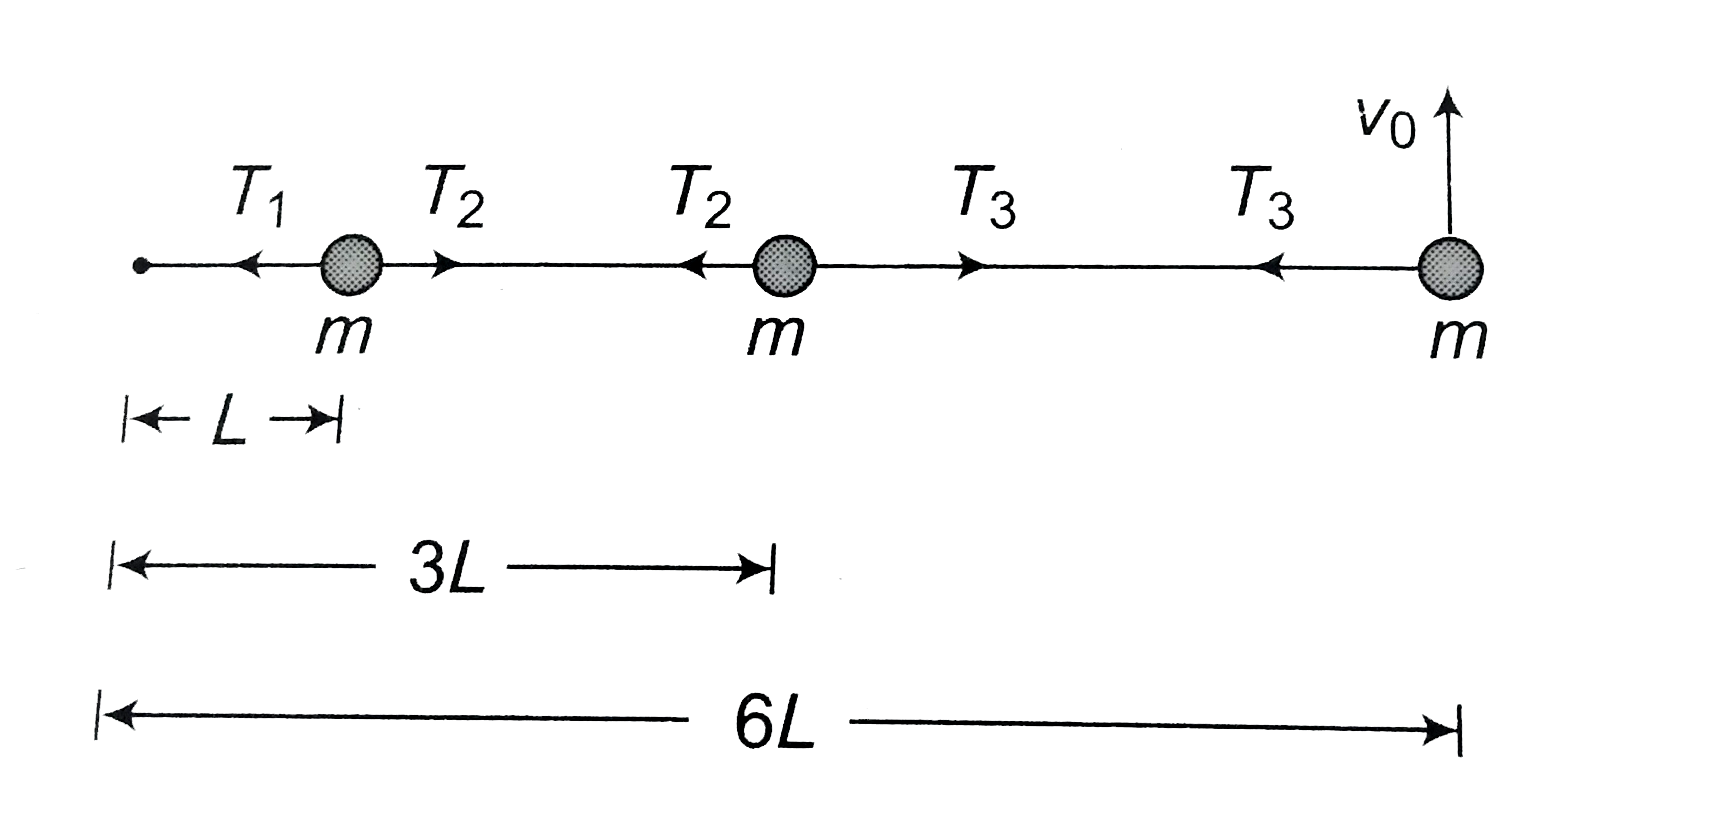
ω will be same for three particles
T1−T2=mω2L …(i)
T1−T3=mω2(3L) …(ii) T3=mω2(6L)….(iii)
T3=6mω20L,T2=9mω2L,T1=10mω2L
T3:T2:T1=6:9:10
Topper's Solved these Questions
Similar Questions
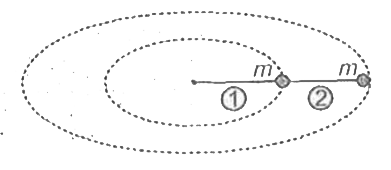
Two particles each of mass m are moving in horizontal circle with same angular speed. If both string are of same length then the ratio of tension in string T1T2 is
 View Solution
Acceleration of two identical particles moving in a straight line are as shown in figure.
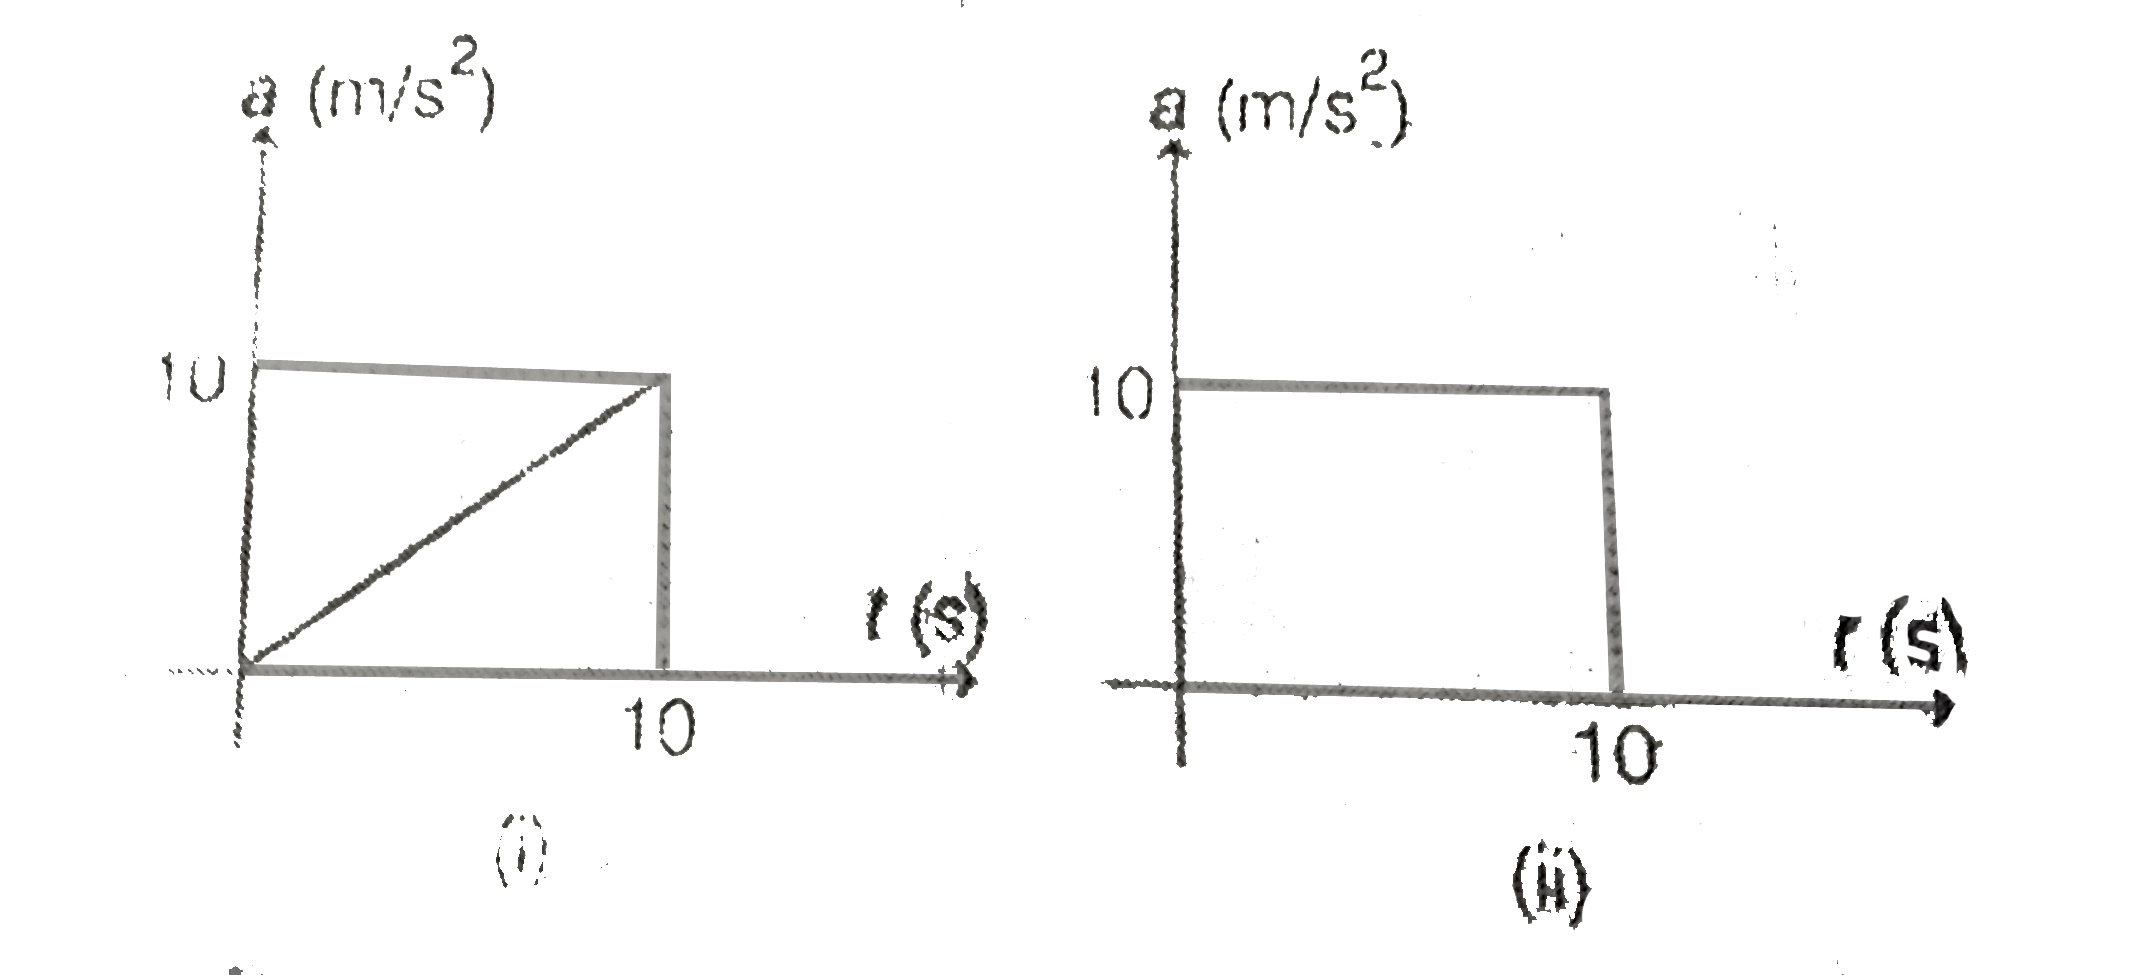
The corresponding a-t graph of their centre of mass will beView Solution
Knowledge Check
- Question 1 - Select One
Three identical particles are joined together by a thread as shown in figure. All the three particles are moving in a horizontal plane. If the velocity of the outermost particle is v0, then the ratio of tensions in the three sections of the string is (TBC:TAB:TDA)
 A3:5:7B3:4:5C7:11:6D3:5:6
 - Question 2 - Select One
A particle of mass m is tied to a string of length L and whirled into a horizontal plan. If tension in the string is T then the speed of the particle will be :
A√TlmB√2TlmC√3TlmD√Tml - Question 3 - Select One
The x-t graph of a particle moving along a straight line is shown in figure

The v-t graph of the particle is correctly shown byA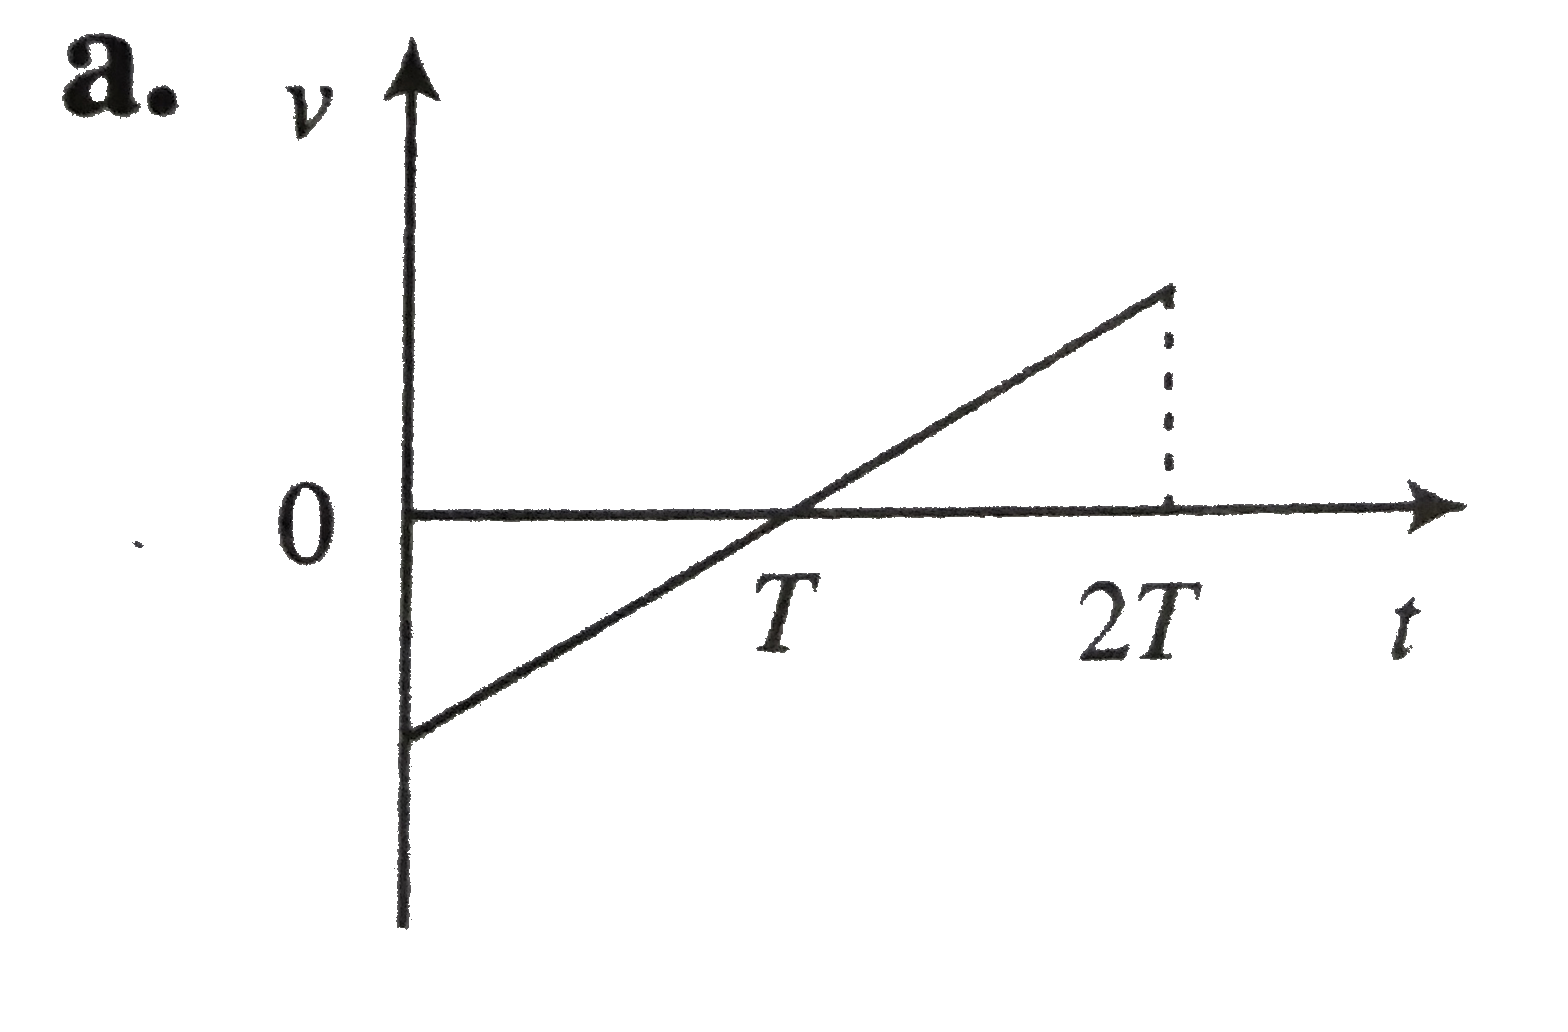 B
B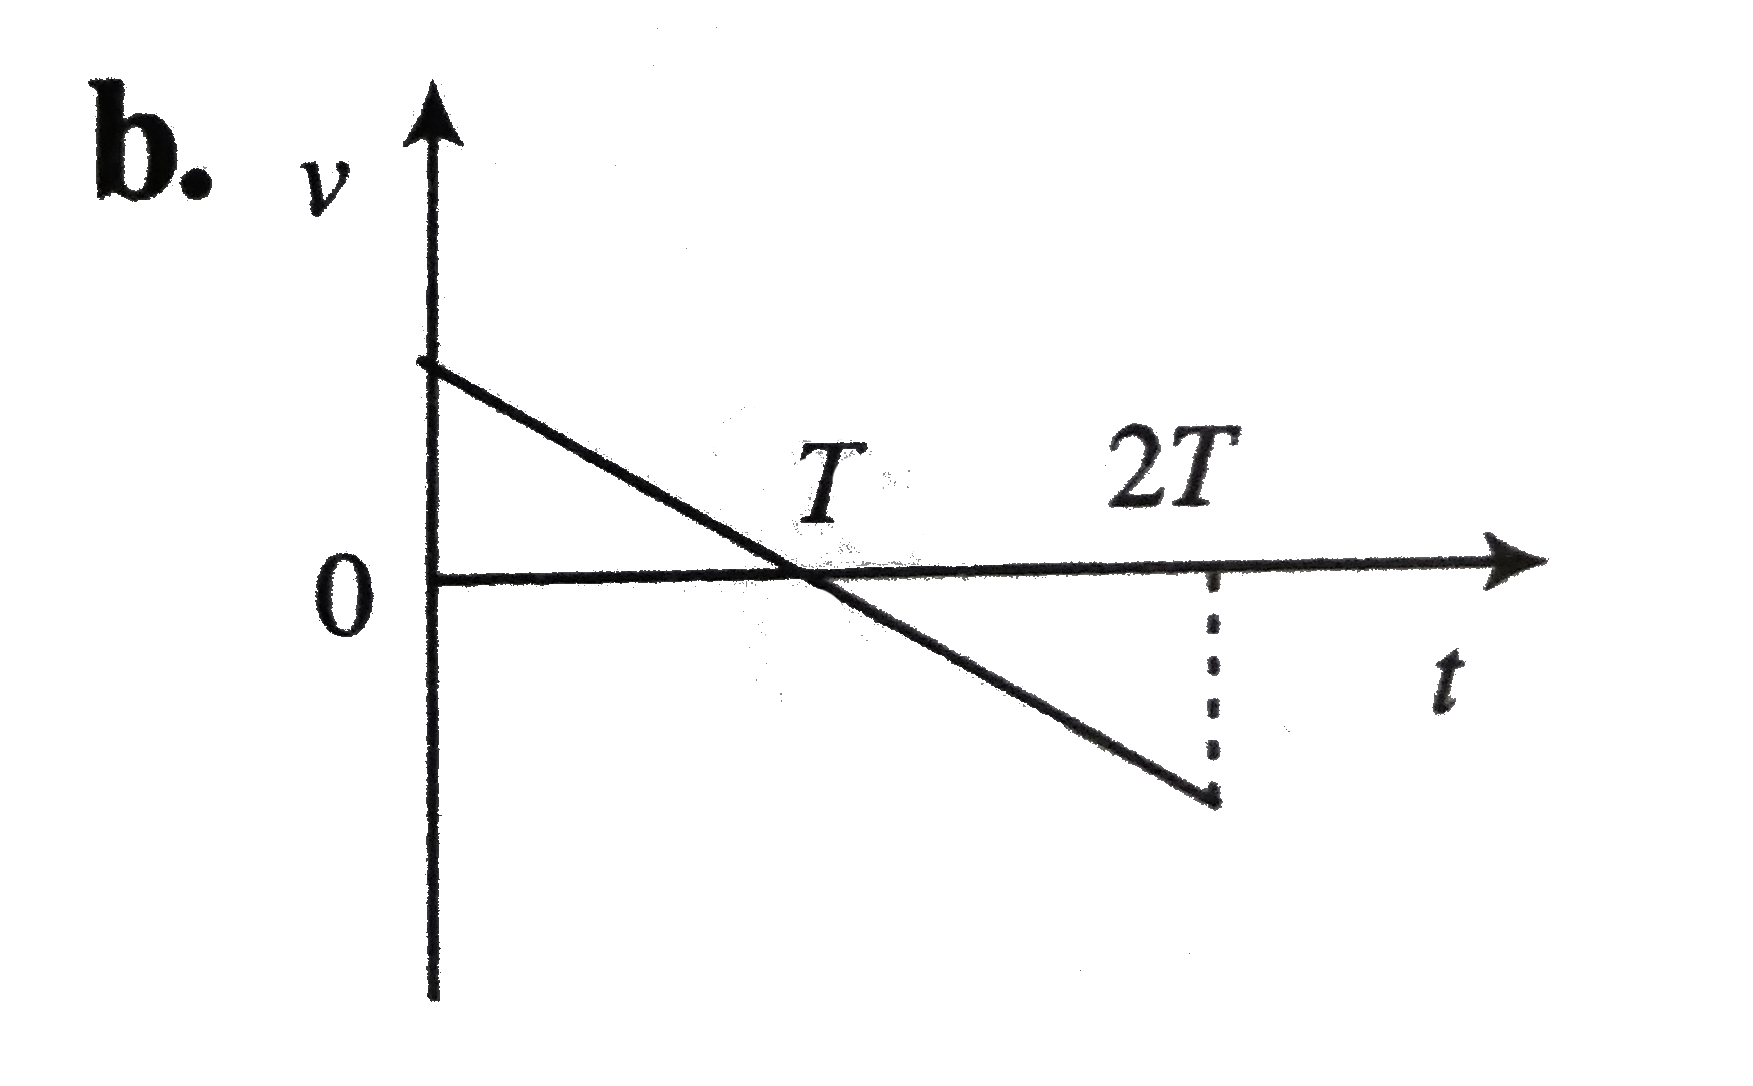 C
C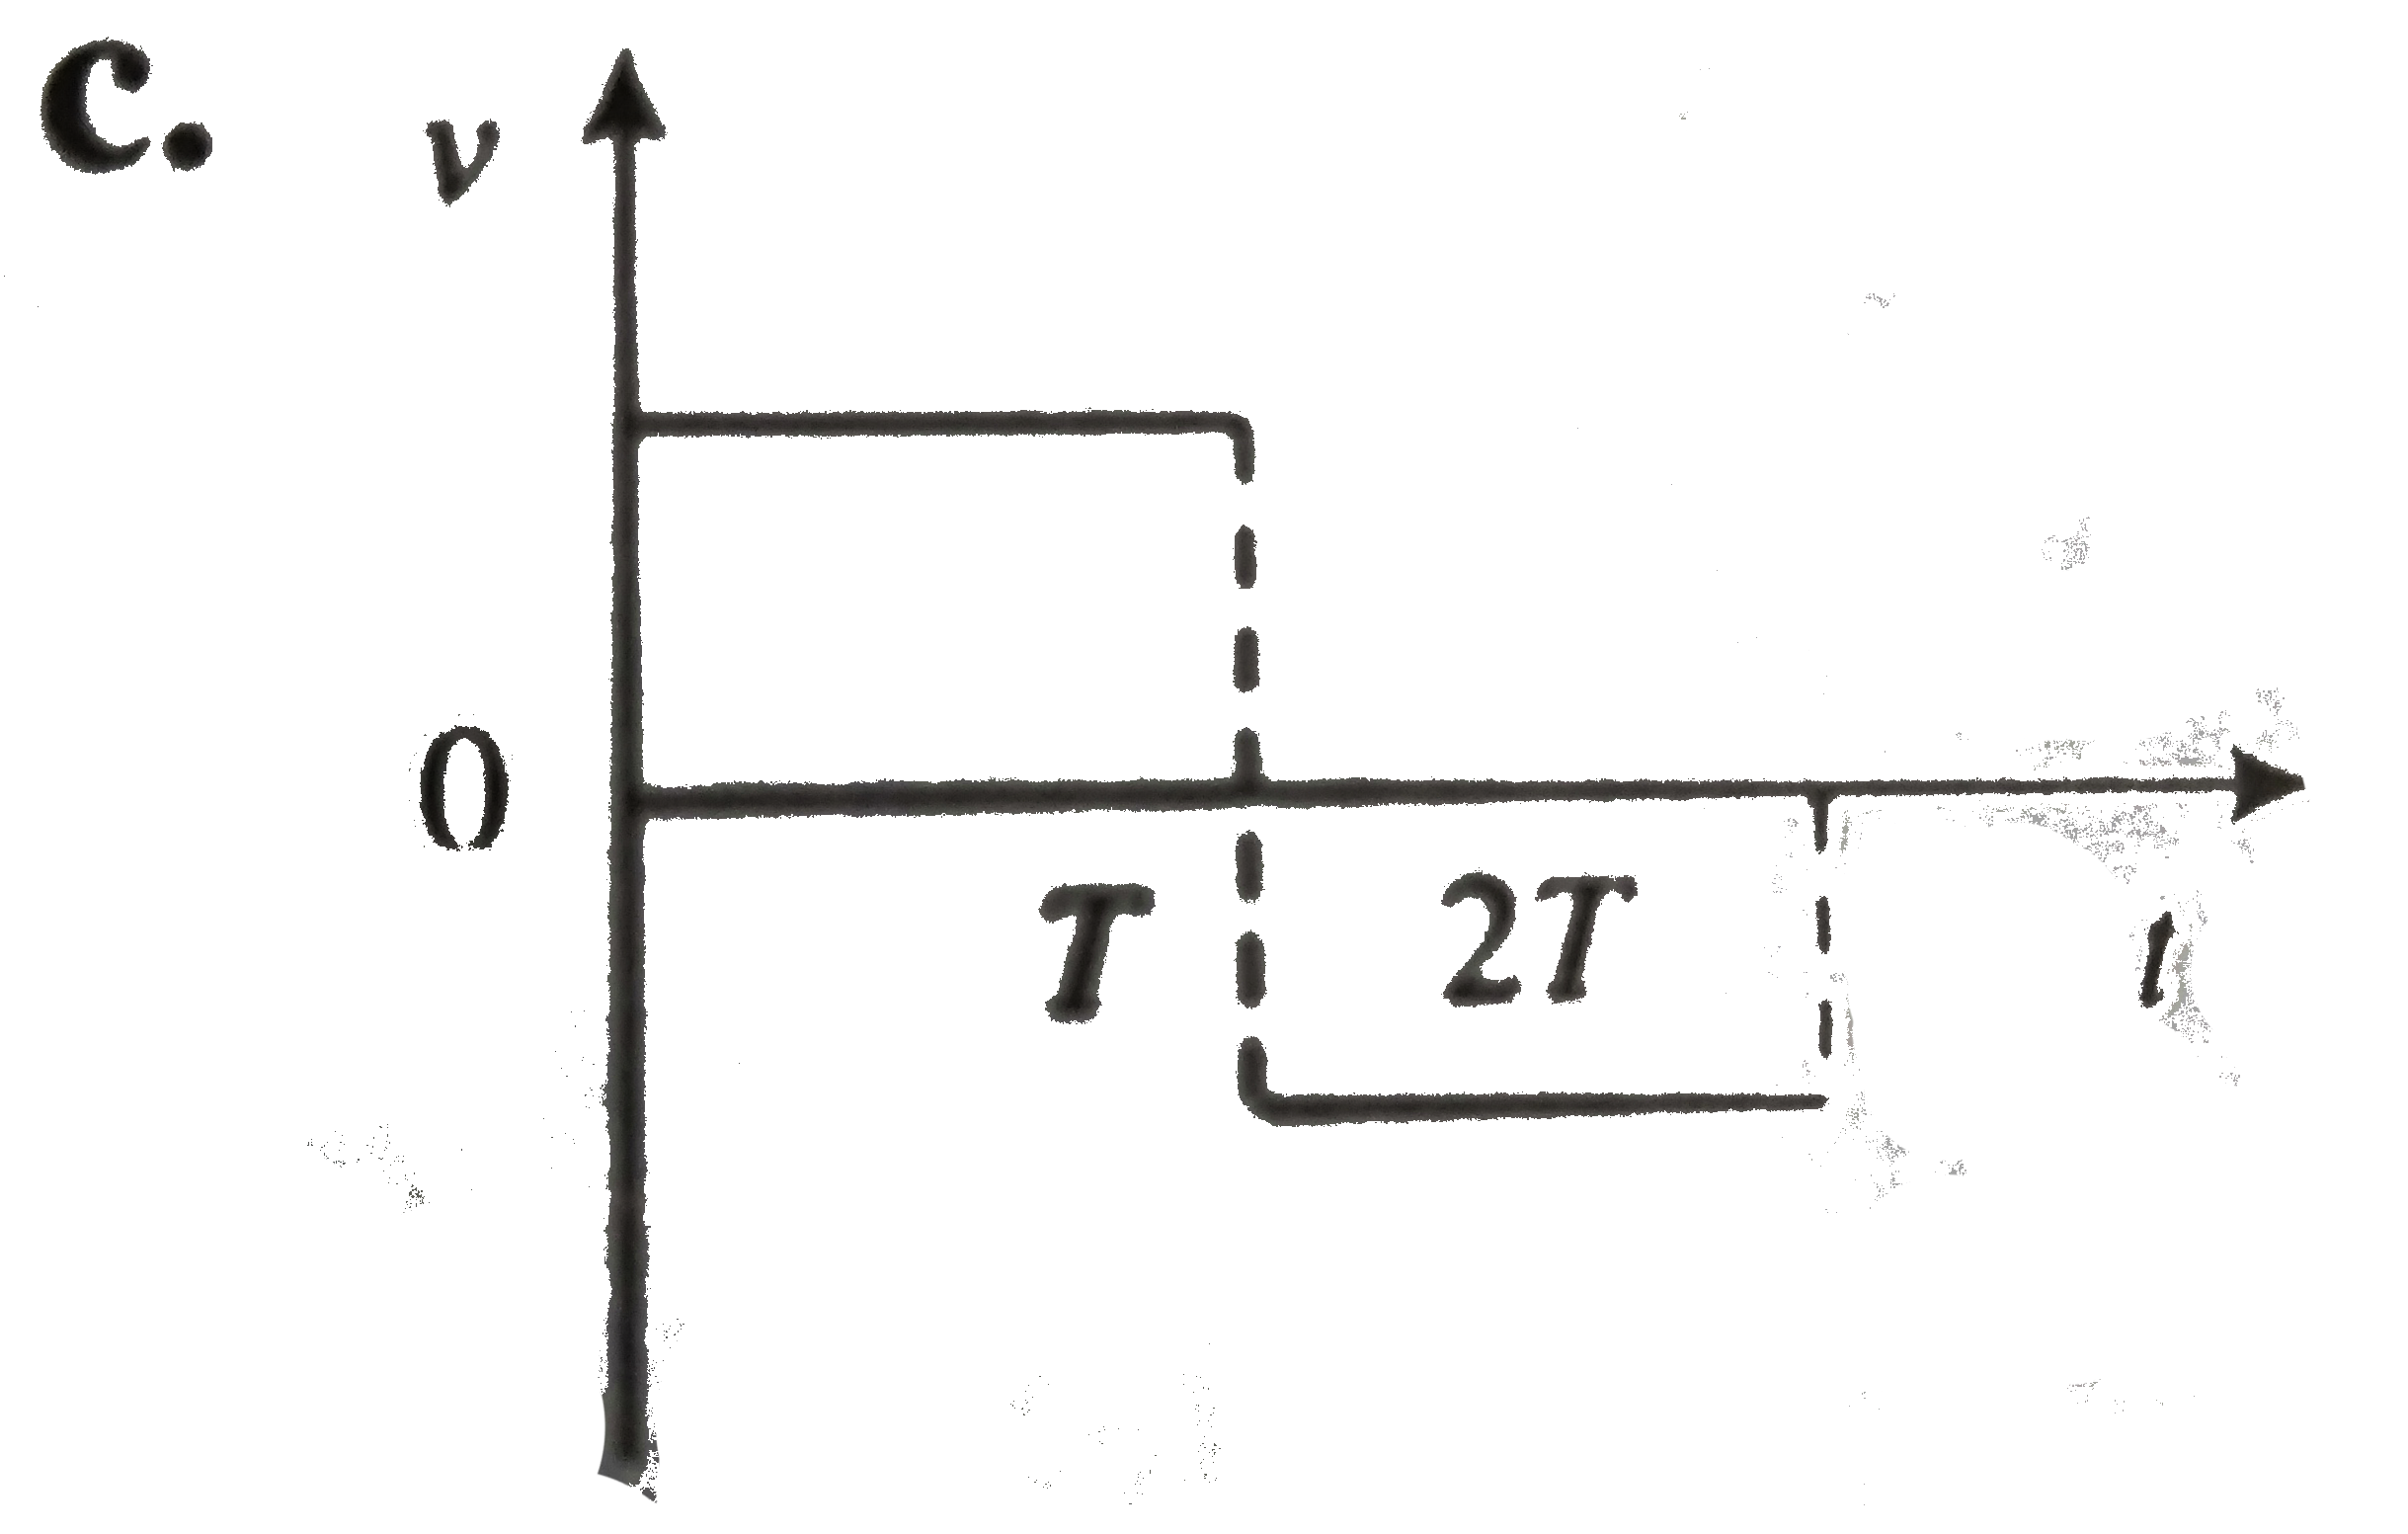 D
D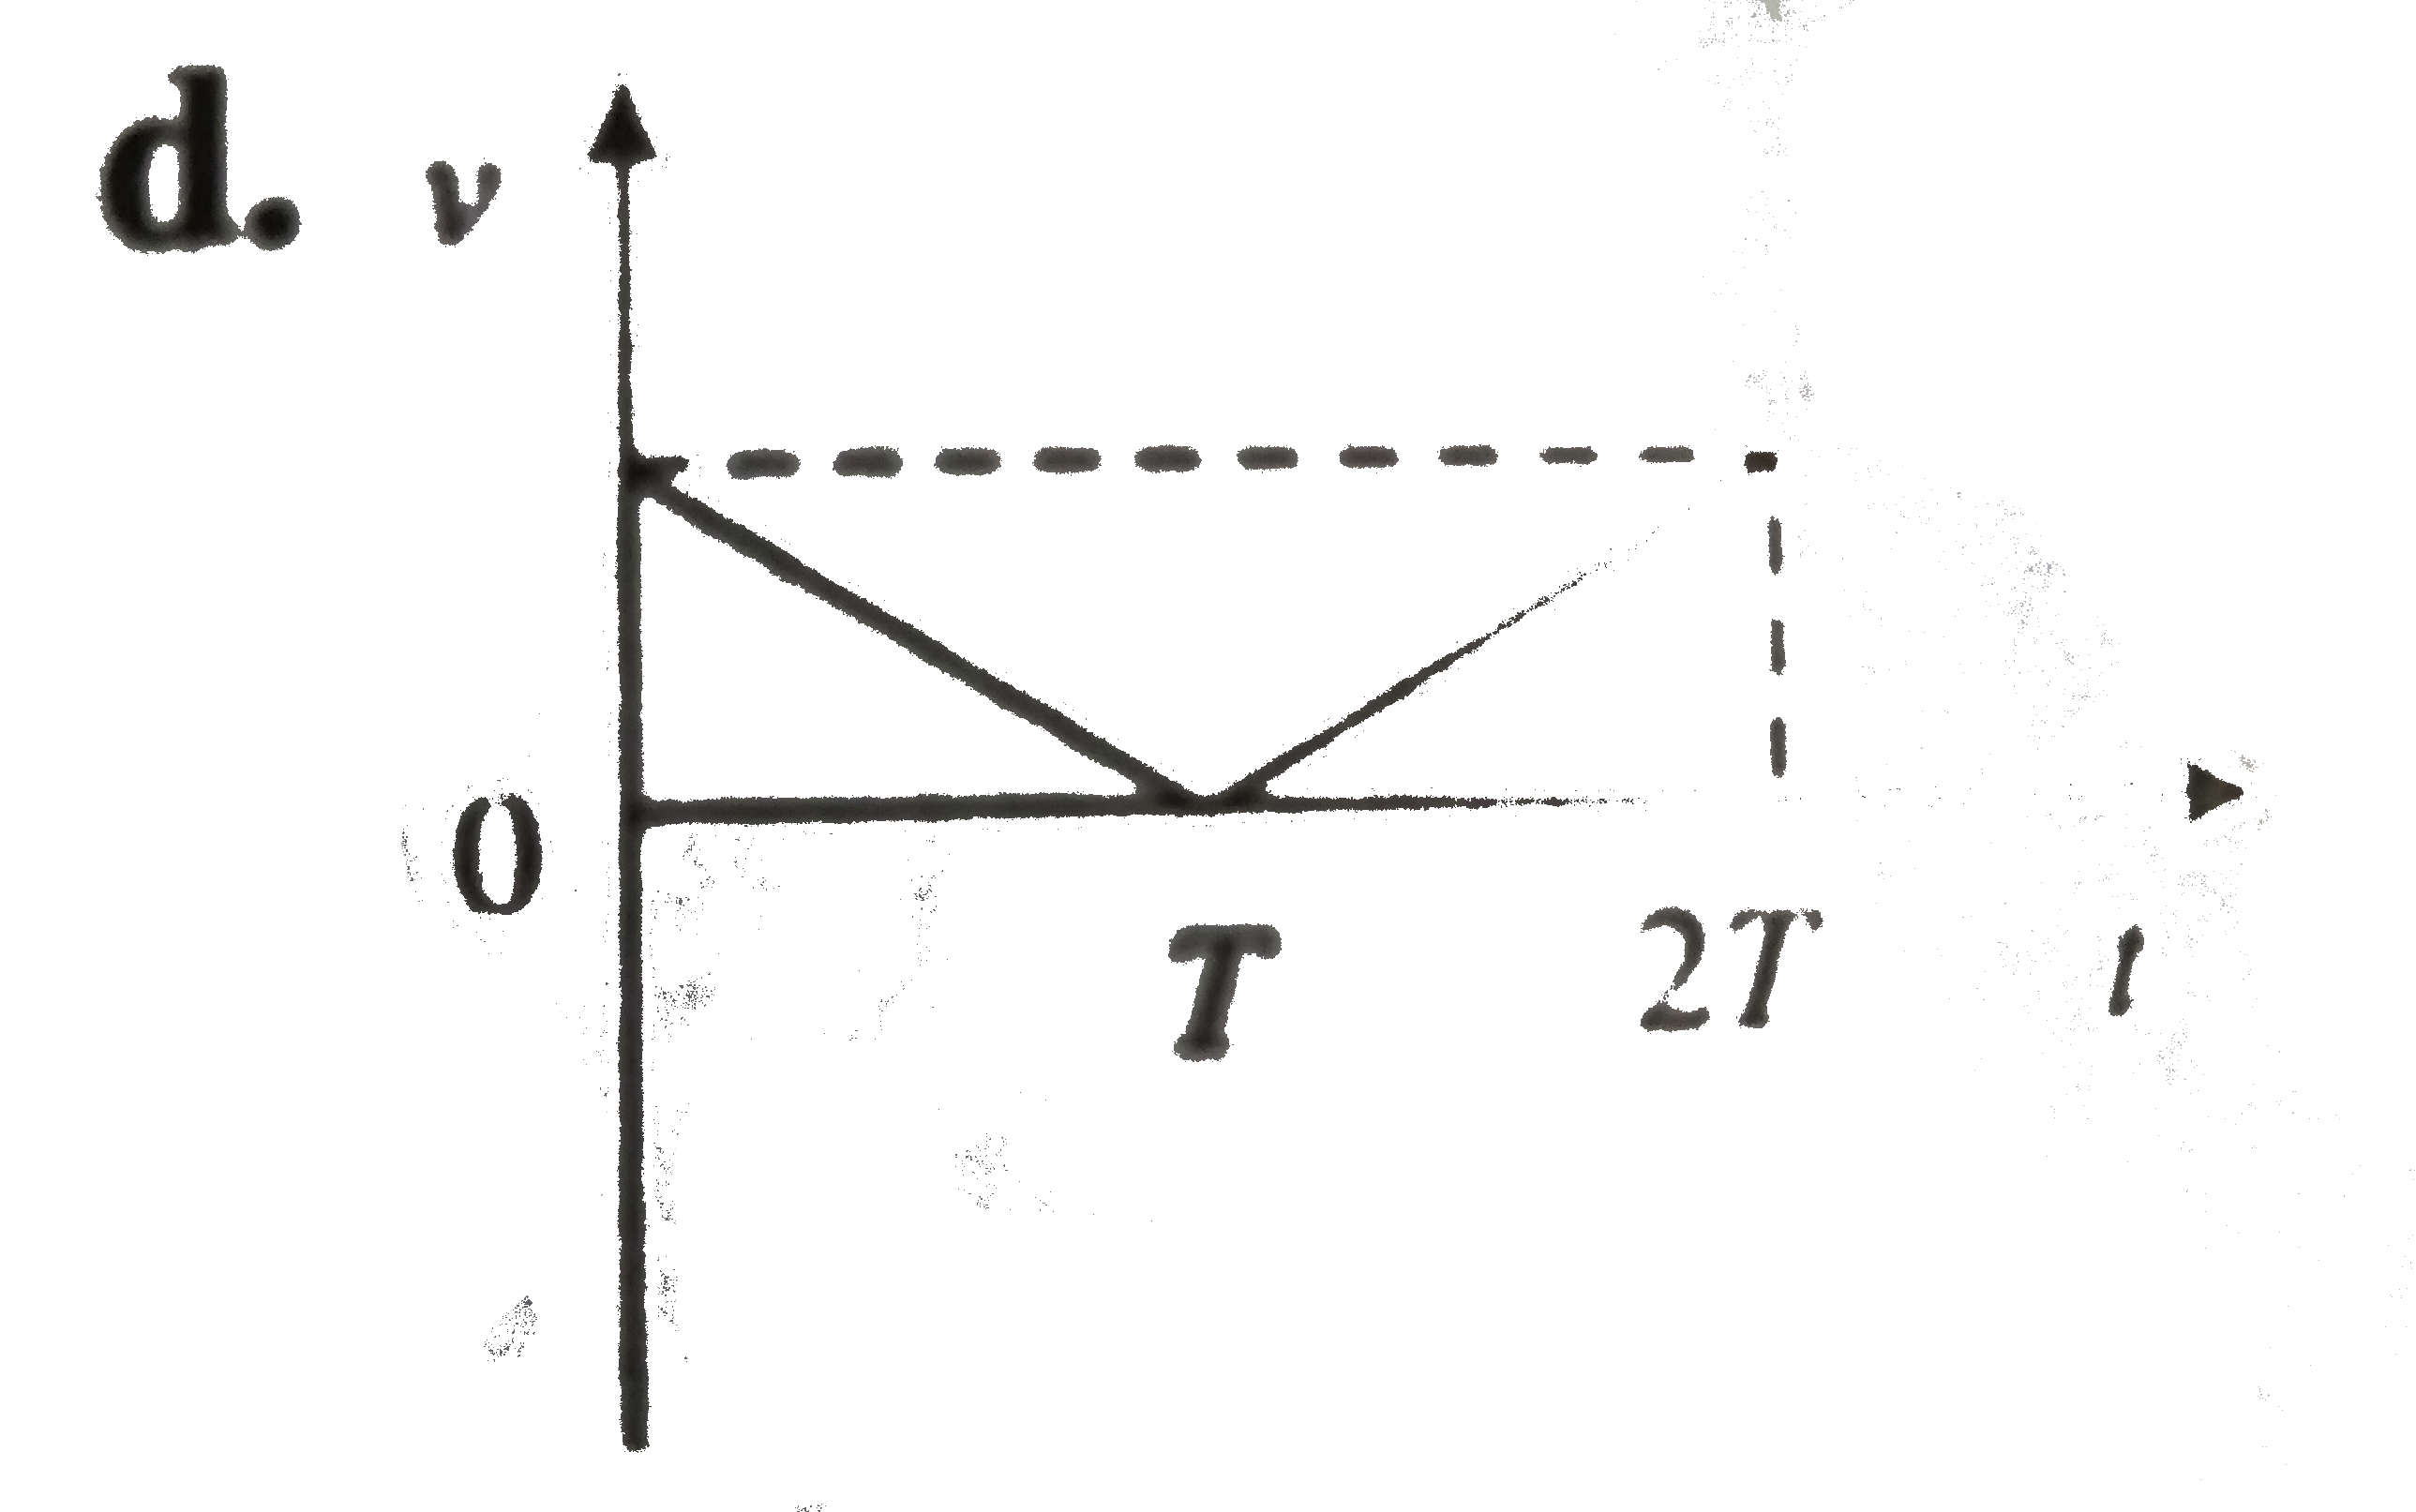
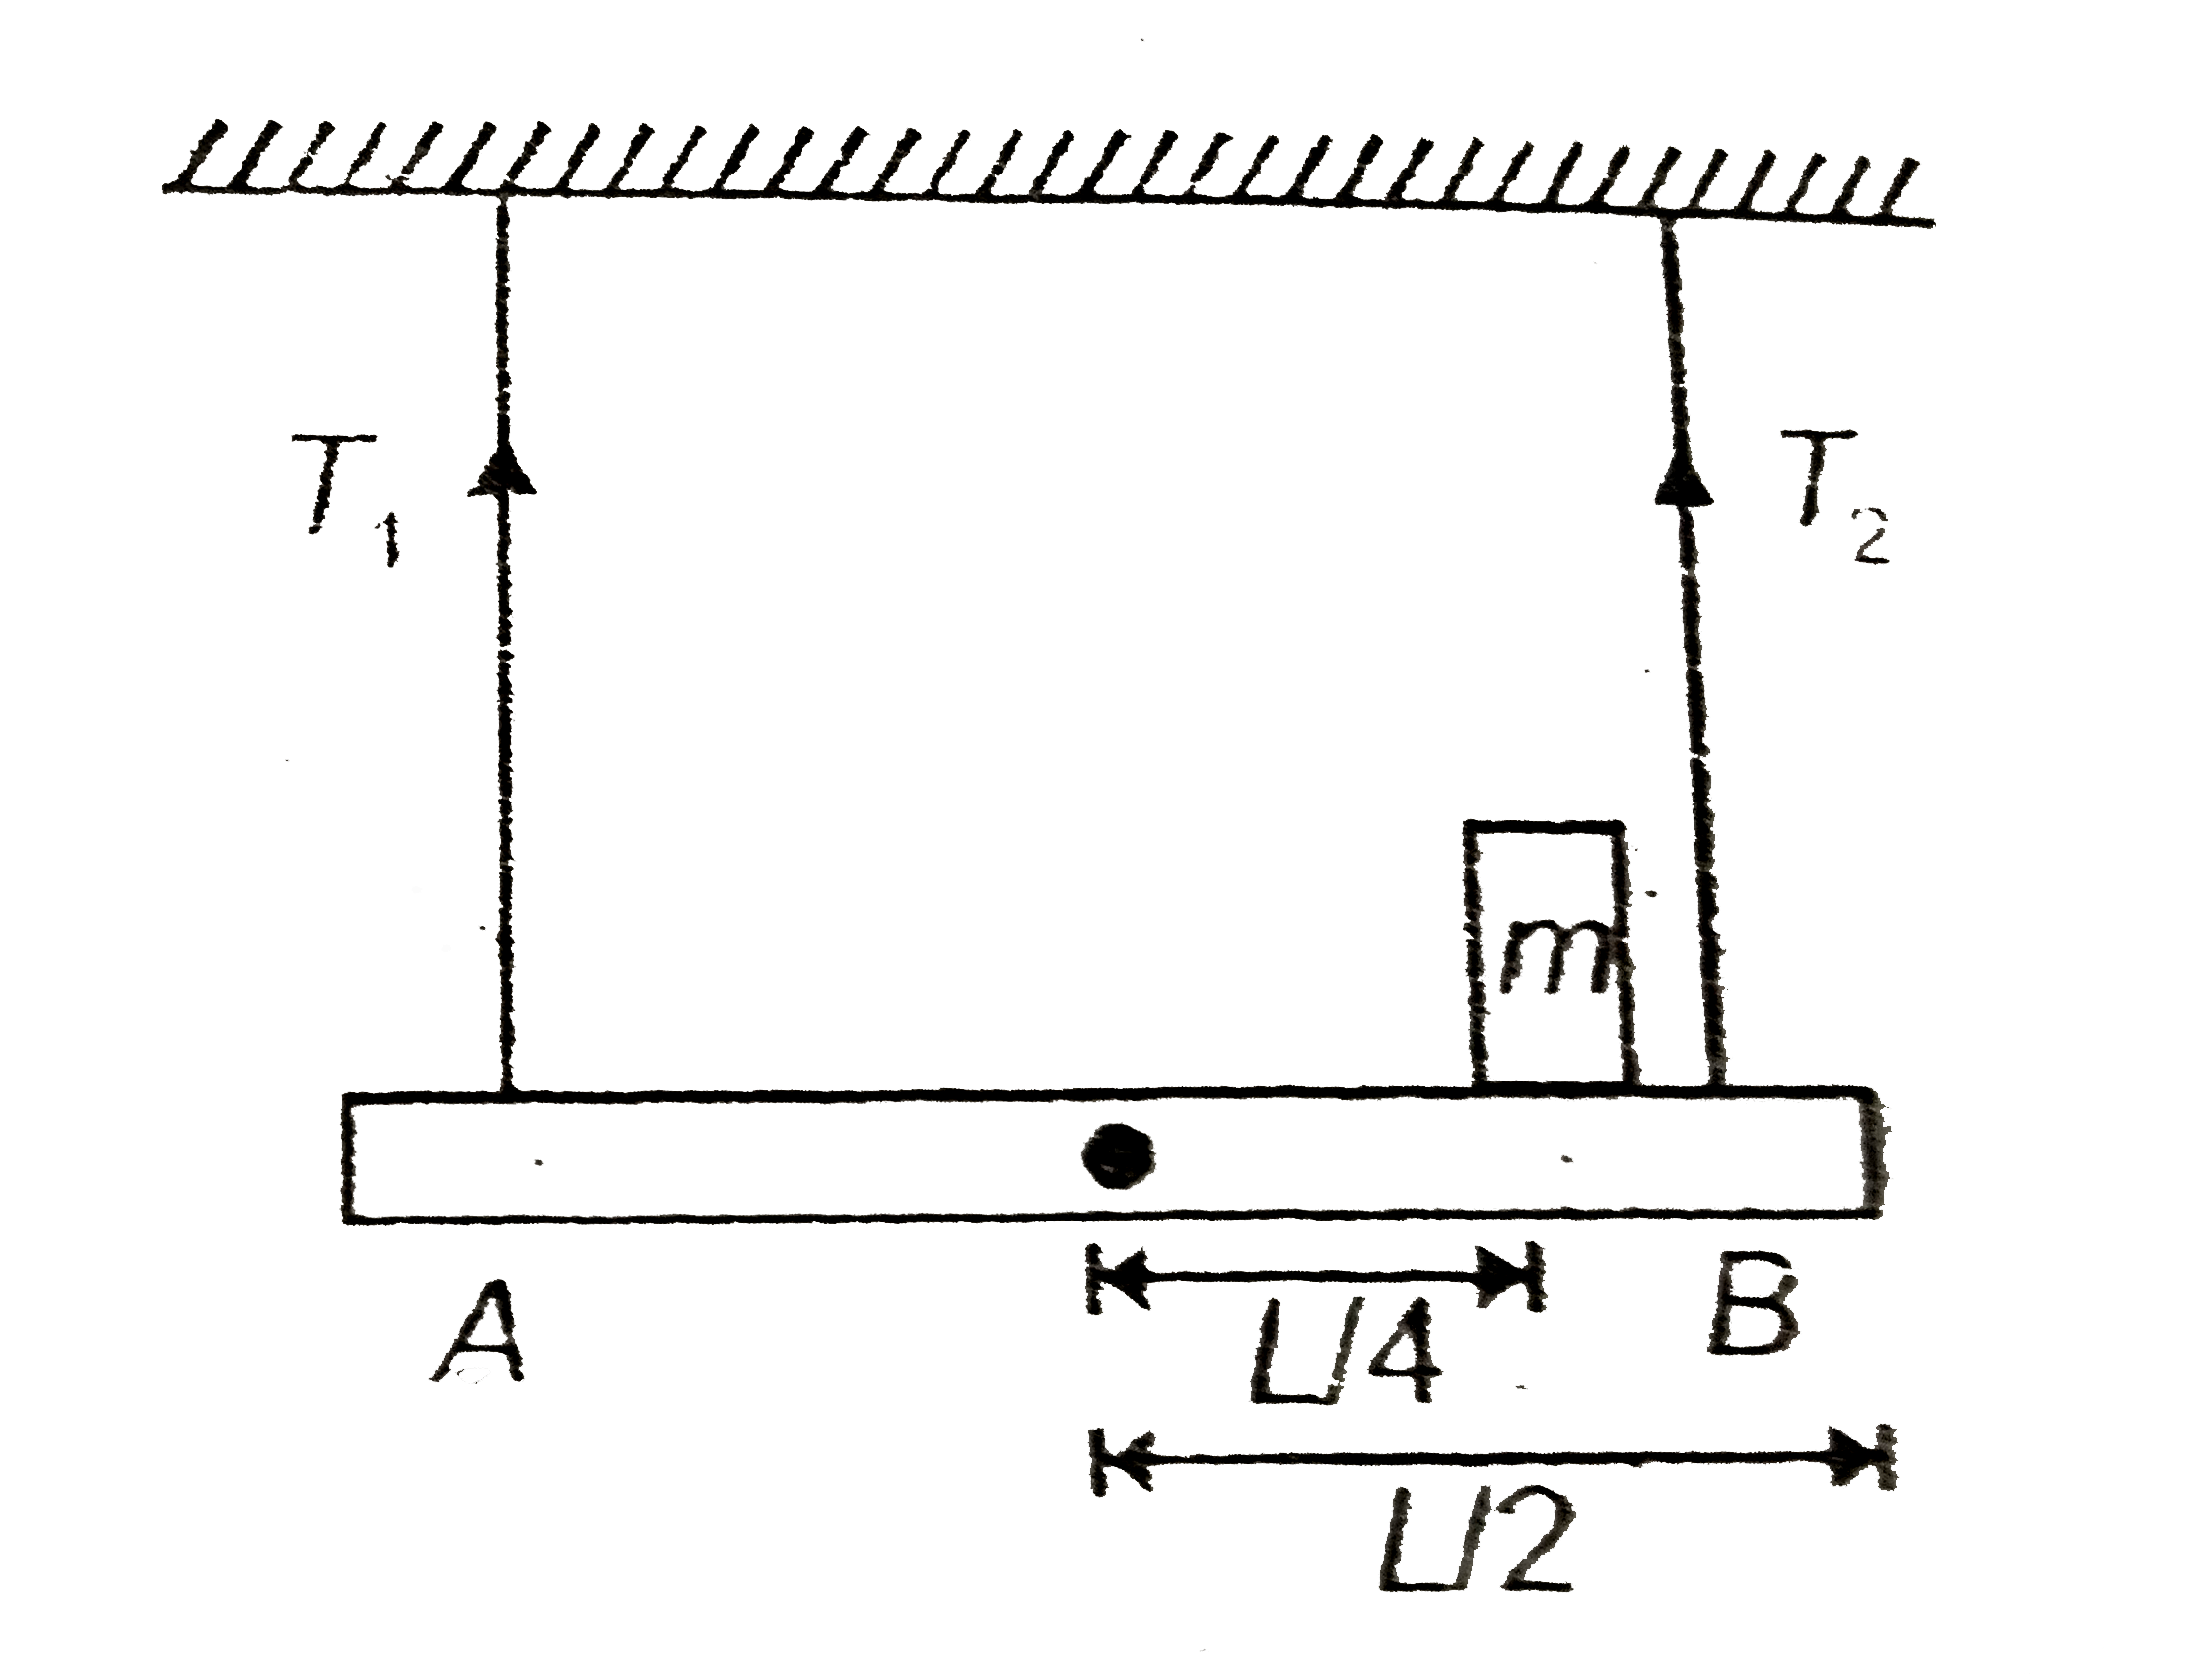
A rod AB of mass m is hung by two ideal threads. Find the ratio of tensions in the two threads (T1T2).
 View Solution
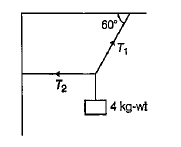
Determine the tensions T1 and T2 in the strings as shown in figure.
 View Solution
The x−t graph of particle moving along a straight line is shown in figure
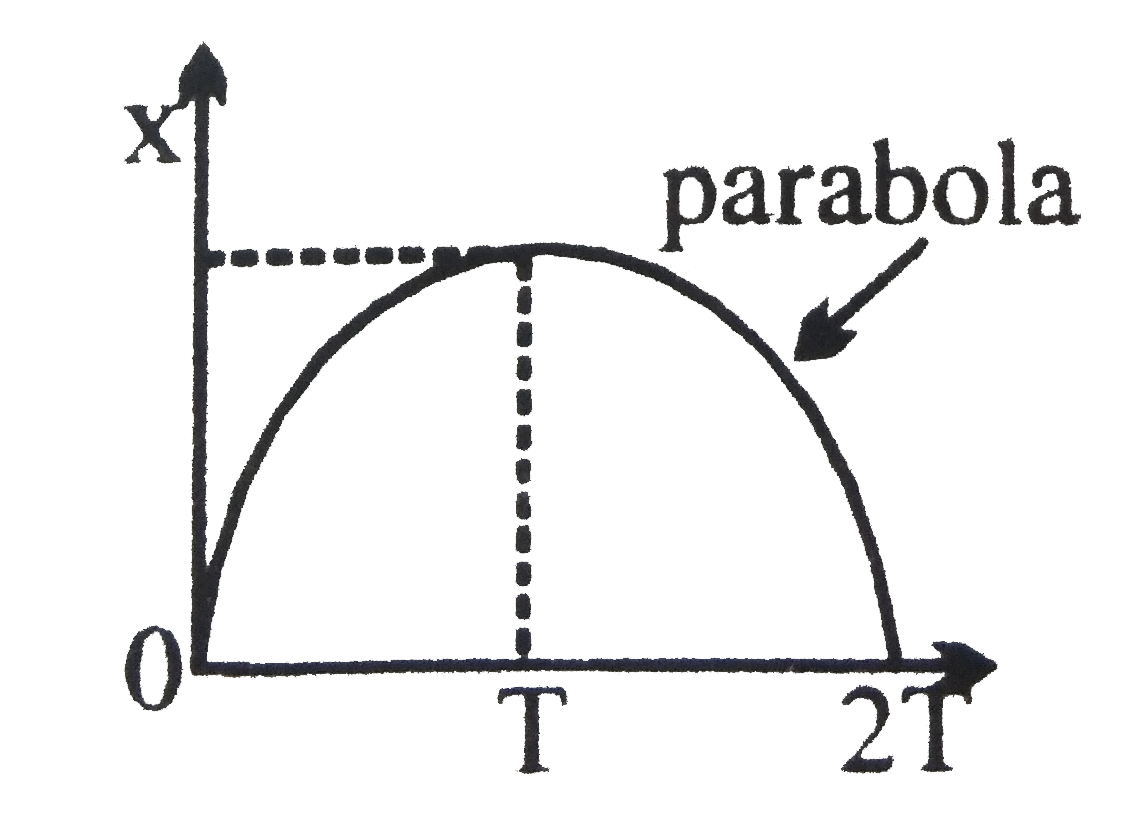
The v−t graph of the particles is correctly shown byView SolutionThe x−t graph of particle moving along a straight line is shown in figure
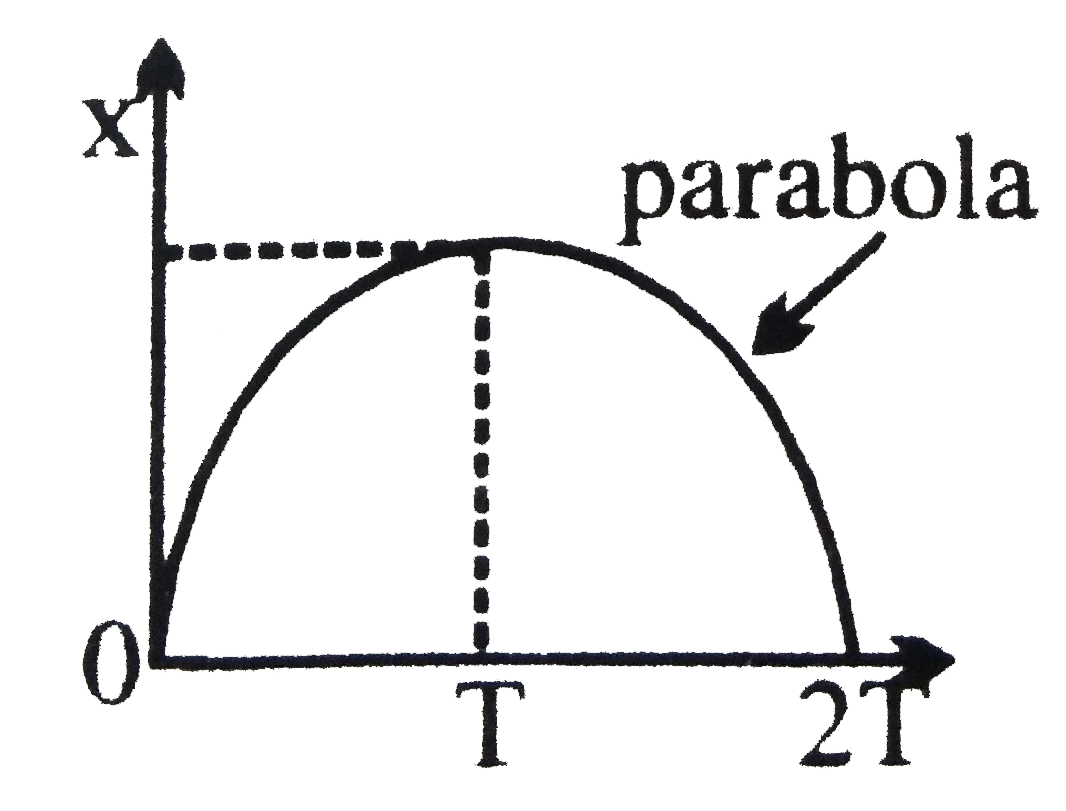
The a−t graph of the particle is correctly shown byView SolutionThe x-t graph of a particle moving along a straight line is shown in figure
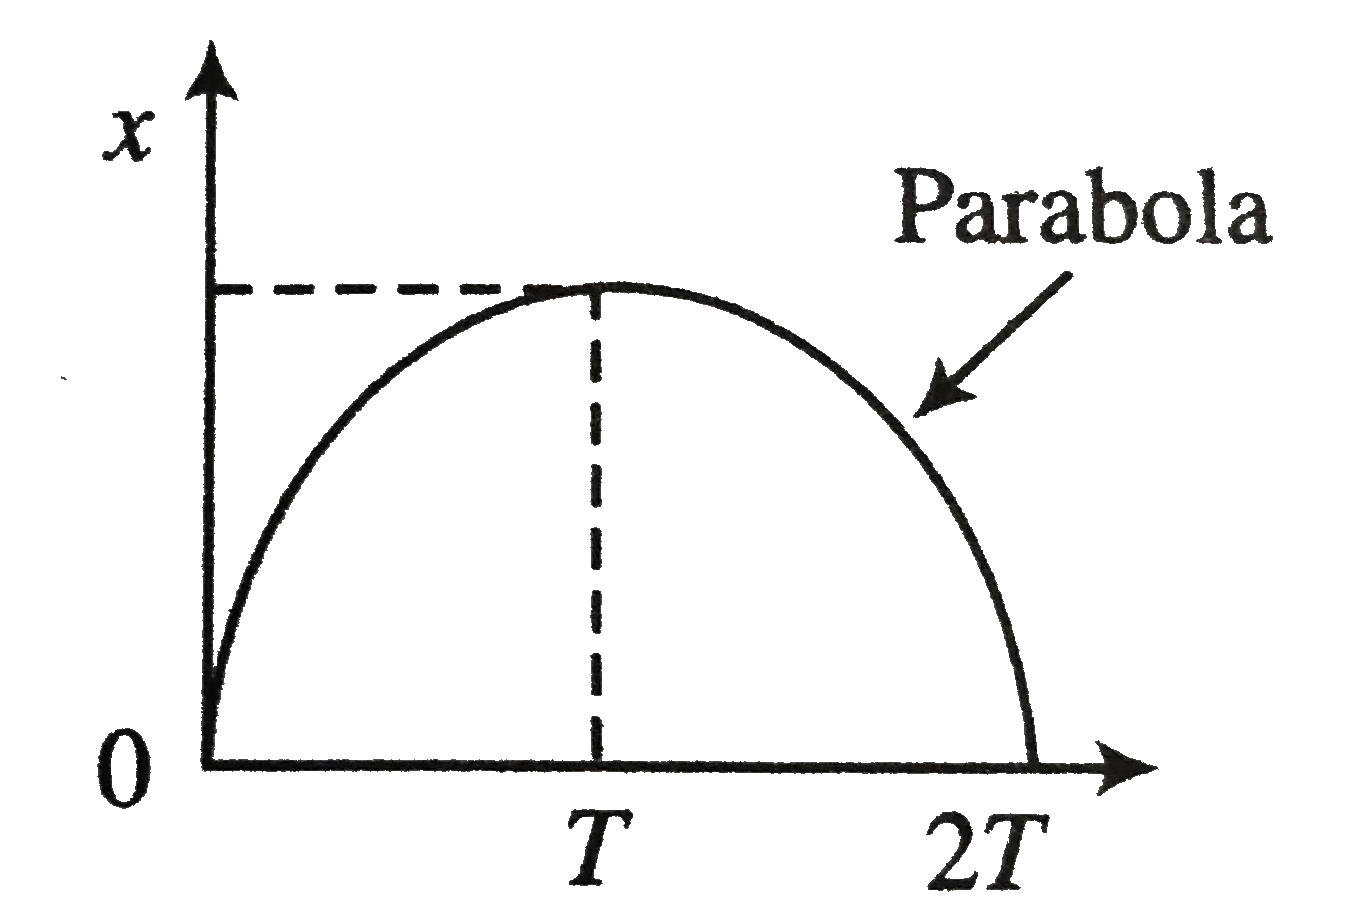
The a-t graph of the particle is correctly shown byView Solution

