In the above graph, point D indicates
Limiting Pooint
Yield point
Breaking point
Elastic limit
The correct Answer is:C
Step by step video, text & image solution for In the above graph, point D indicates by Physics experts to help you in doubts & scoring excellent marks in Class 11 exams.
Topper's Solved these Questions
- BOOK - NARAYNACHAPTER - MECHANICAL PROPERTIES OF SOLIDSEXERCISE - LEVEL-I (C.W)37videos
MECHANICAL PROPERTIES OF SOLIDS
- BOOK - NARAYNACHAPTER - MECHANICAL PROPERTIES OF SOLIDSEXERCISE - LEVEL-II (C.W)32videos
MECHANICAL PROPERTIES OF SOLIDS
- BOOK - NARAYNACHAPTER - MECHANICAL PROPERTIES OF SOLIDSEXERCISE - LEVEL-II (H.W)24videos
MECHANICAL PROPERTIES OF SOLIDS
- BOOK - NARAYNACHAPTER - MECHANICAL PROPERTIES OF FLUIDSEXERCISE - EXERCISE - III30videos
MECHANICAL PROPERTIES OF FLUIDS
- BOOK - NARAYNACHAPTER - MOTION IN A PLANEEXERCISE - Level-II(H.W)31videos
MOTION IN A PLANE
Similar Questions
Study the following graph .
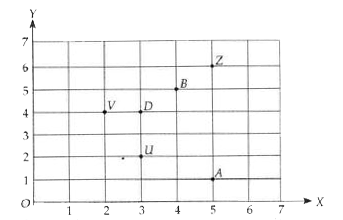
On the basis of above graph, coordinates of U and Z areView SolutionDirection: The bar graph shown below indicate the number of books owned and the number of books issued by the 5 different libraries A, B, C, D, and E. Based on the given bar graph answer the question given below:
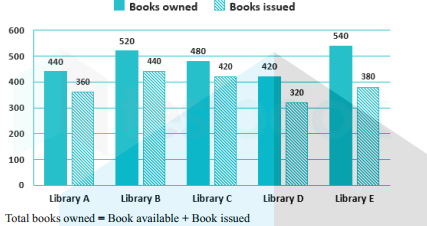
Books available in library D is how much percent of books owned by library B and C together?View Solution
Knowledge Check
- Question 1 - Select One
In the above graph, point B indicates.
ABreaking pointBLimiting pointCYield pointDNone of the above - Question 2 - Select One
In the above graph, point B indicates
ABreaking pointBLimiting PoointCYield pointDElastic limit - Question 3 - Select One
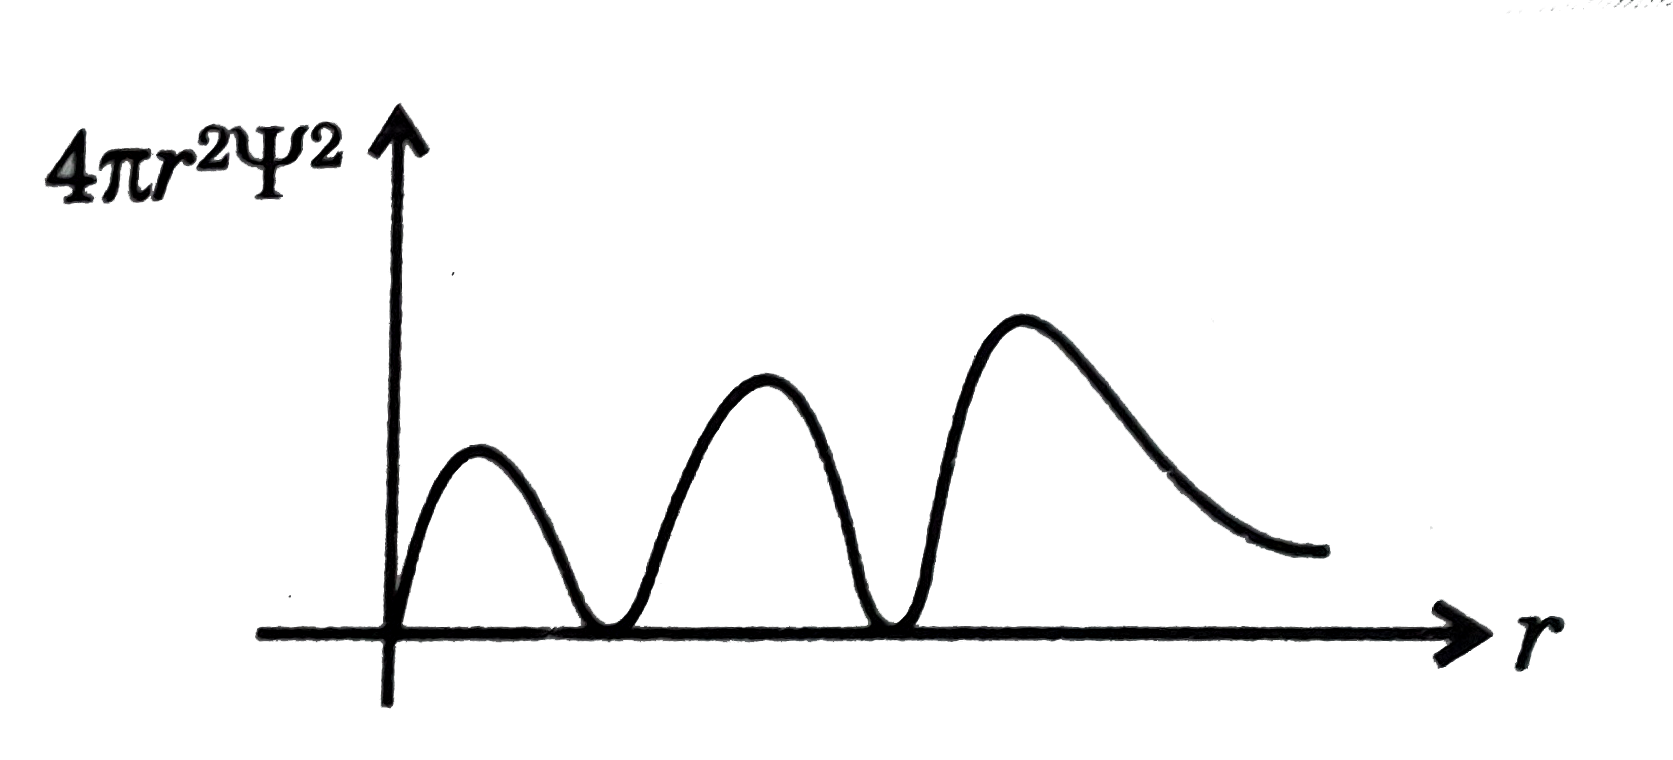
The above graph cannot be of:A3sB4pxC3pxD5dxy
What does a point on PPC indicate ?
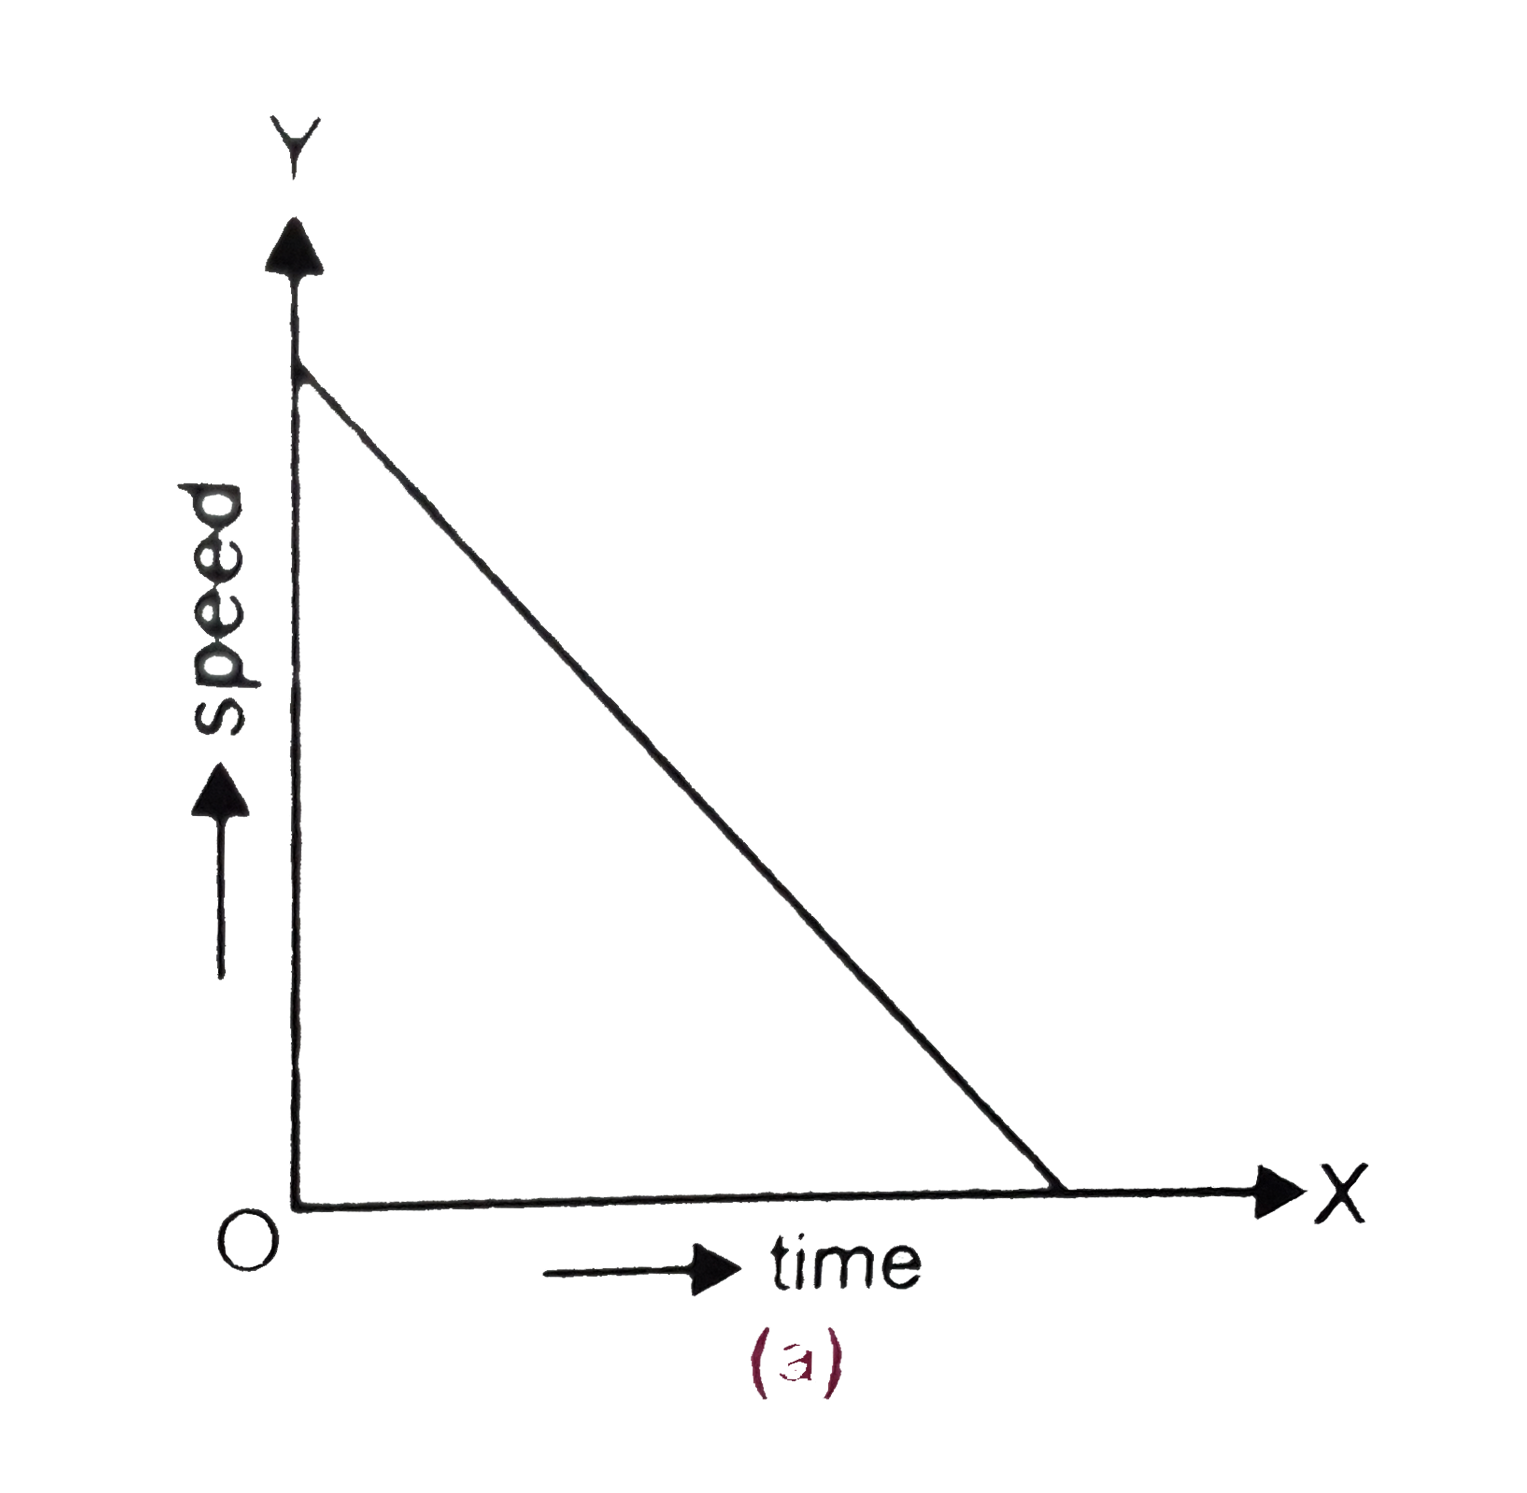
View SolutionWhat do the graph shown in Figure indicate ?
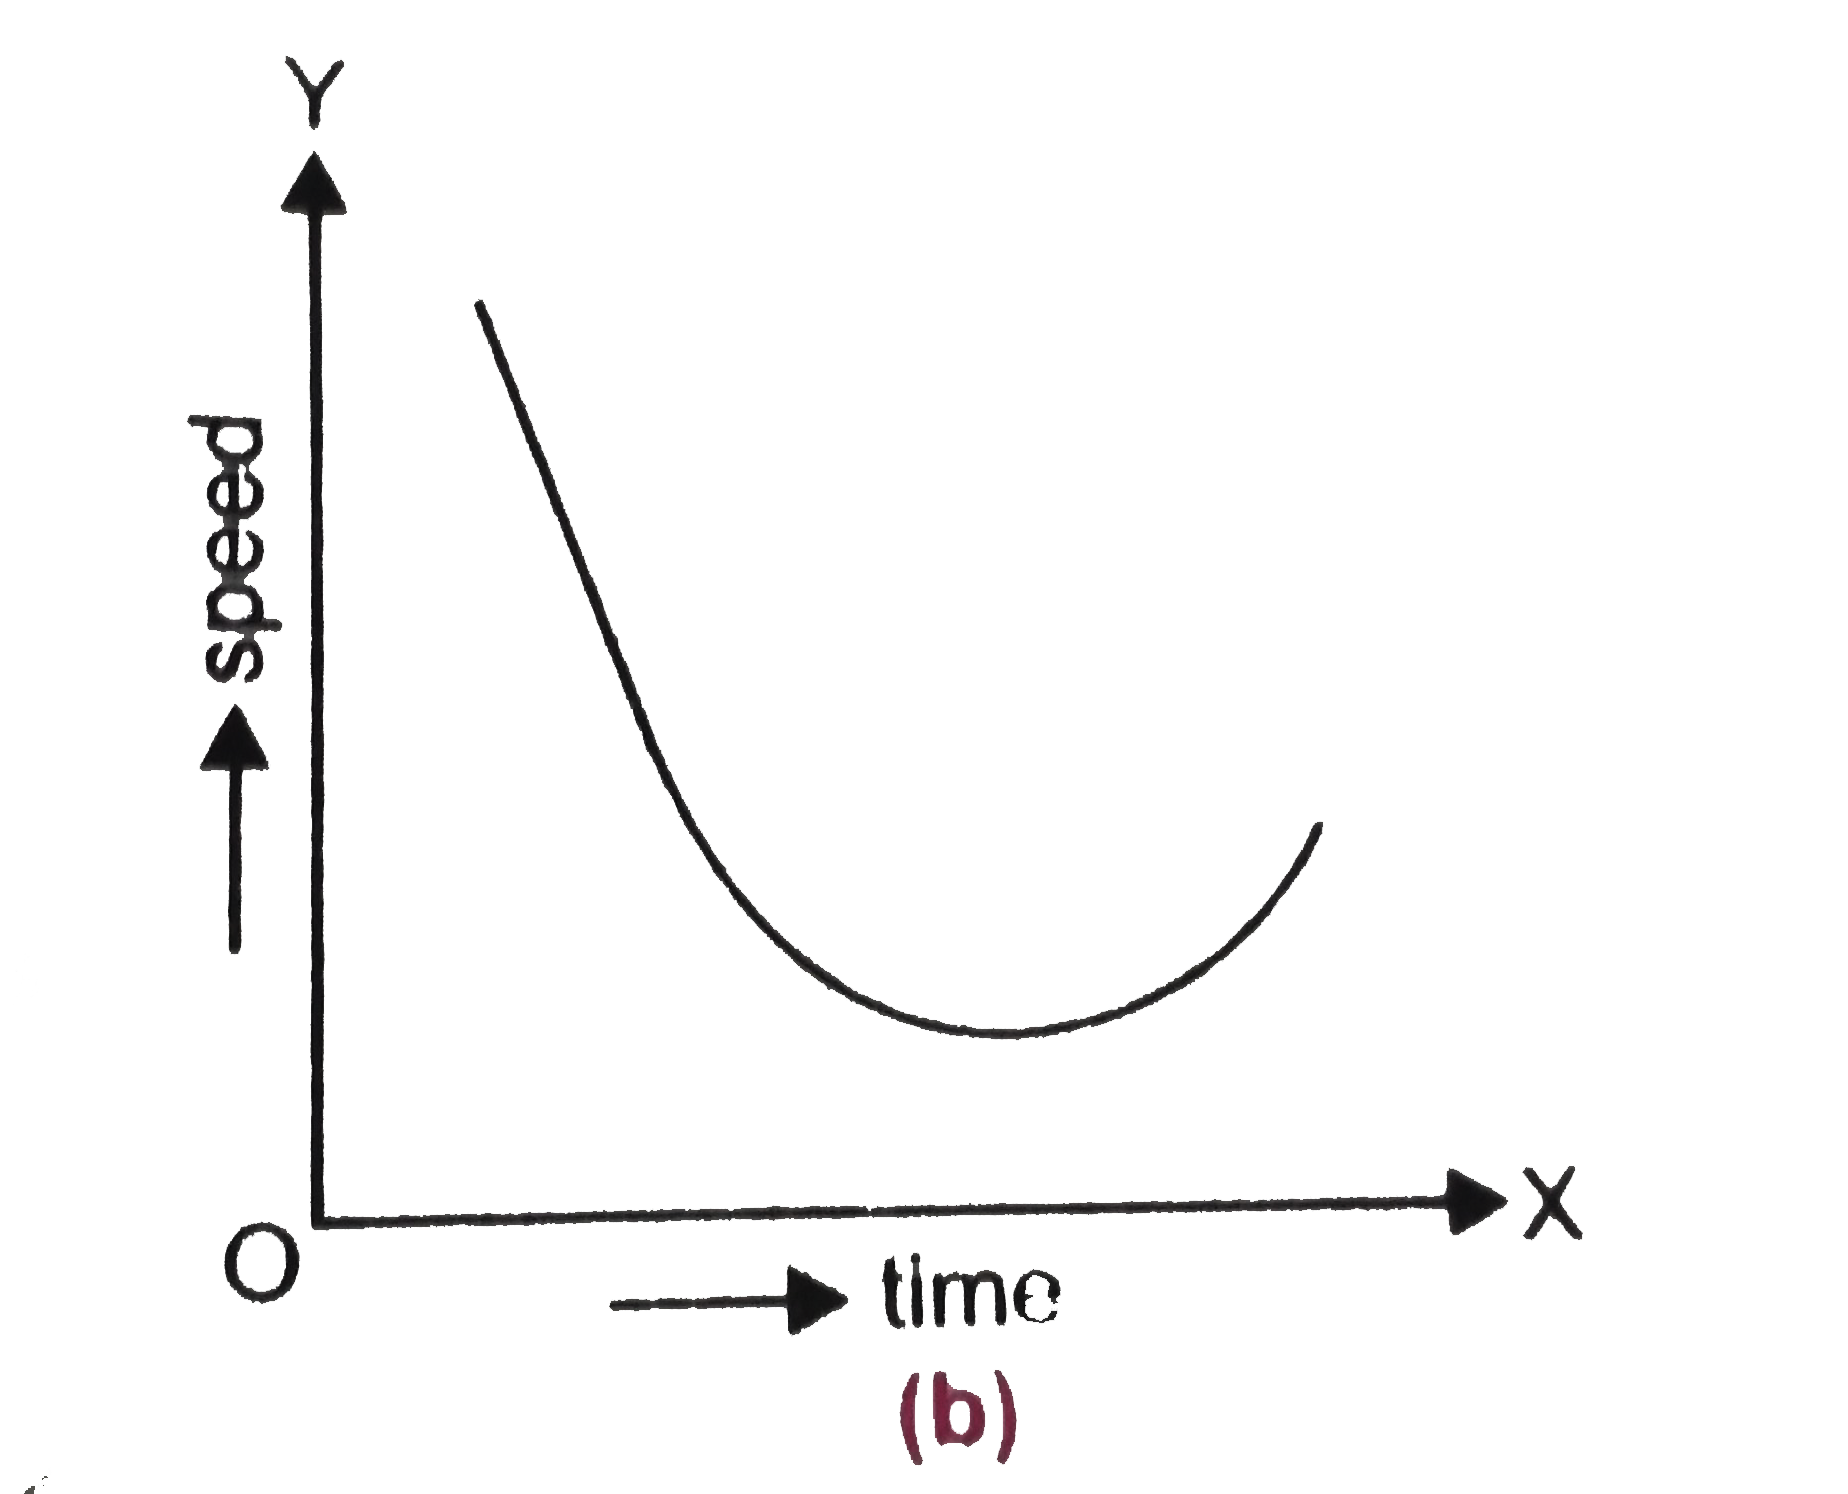 View Solution
In above graph element F is:View Solution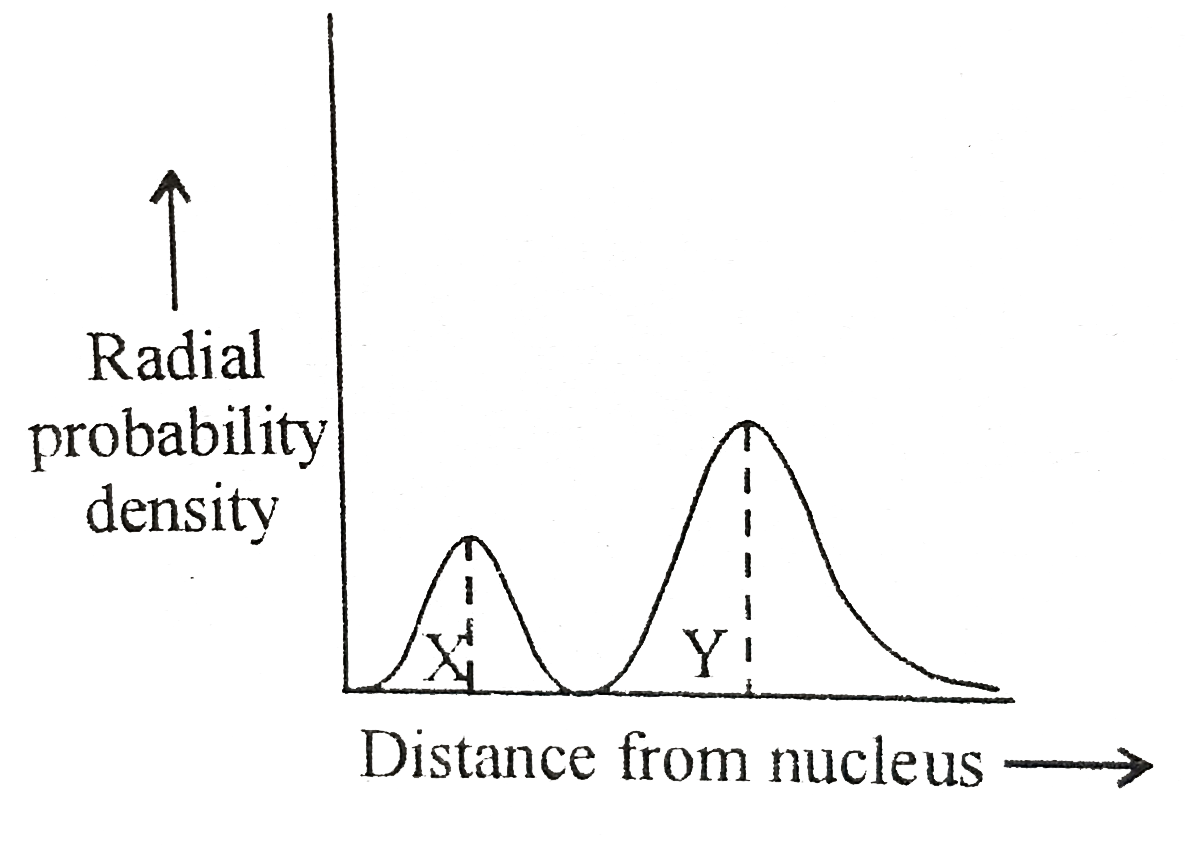
If the above radial probaility curve indicates '2s' orbital, the distance between the peak points X& Y
isView SolutionThe Δ sign written above the arrow indicates ……………of the reactions.
View Solution

