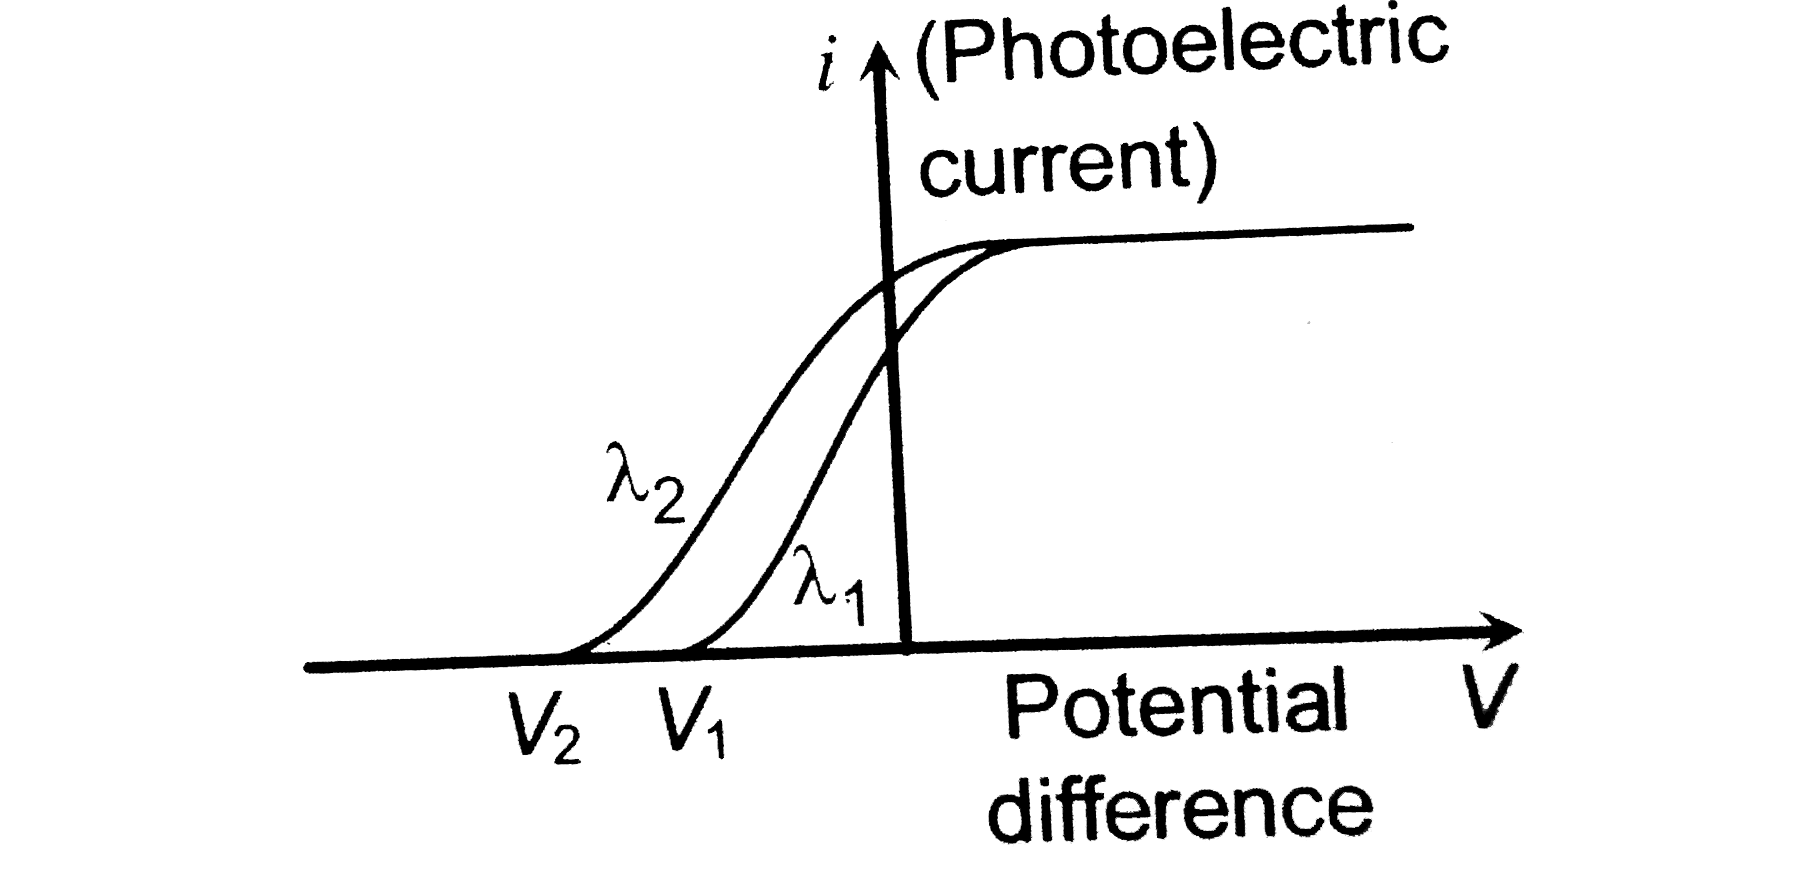
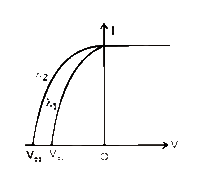
In the following diagram if then
The correct Answer is:D
Step by step video, text & image solution for In the following diagram if V_(2) gt V_(1) then by Physics experts to help you in doubts & scoring excellent marks in Class 12 exams.
Updated on:21/07/2023Topper's Solved these Questions
- DUAL NATUREBOOK - NARAYNACHAPTER - DUAL NATUREEXERCISE - LEVEL-I (C.W)
16 Videos
- DUAL NATUREBOOK - NARAYNACHAPTER - DUAL NATUREEXERCISE - LEVEL-II (C.W)
20 Videos
- DUAL NATUREBOOK - NARAYNACHAPTER - DUAL NATUREEXERCISE - LEVEL-II (H.W)
17 Videos
- DUAL NATURE OF RADIATION AND MATTERBOOK - NARAYNACHAPTER - DUAL NATURE OF RADIATION AND MATTEREXERCISE - ASSERTION AND REASON
15 Videos
- ELECTRIC CHARGES AND FIELDSBOOK - NARAYNACHAPTER - ELECTRIC CHARGES AND FIELDSEXERCISE - EXERCISE -4
43 Videos
Similar Questions
In the following diagram, if the potential difference across AB is 10 V what is the reading shown by V2 ?
How are the reading of V1 and V4, which reading is higher ? Explains your answer (All volt metres are identified).

View SolutionObserve the following diagram and answer the questions:
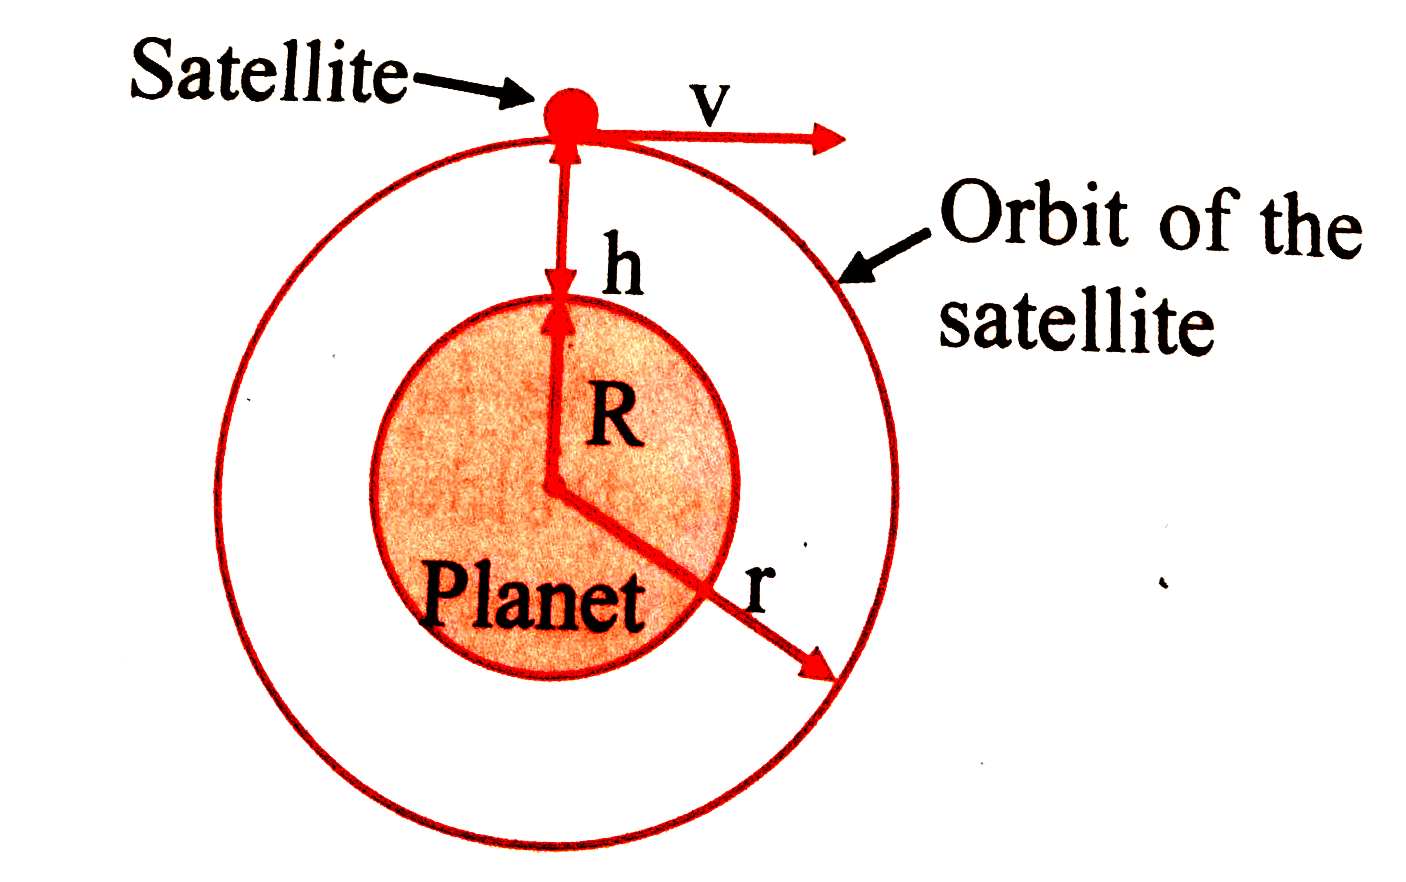
What is the velocity v shown in the figure called gt
View Solution
Knowledge Check
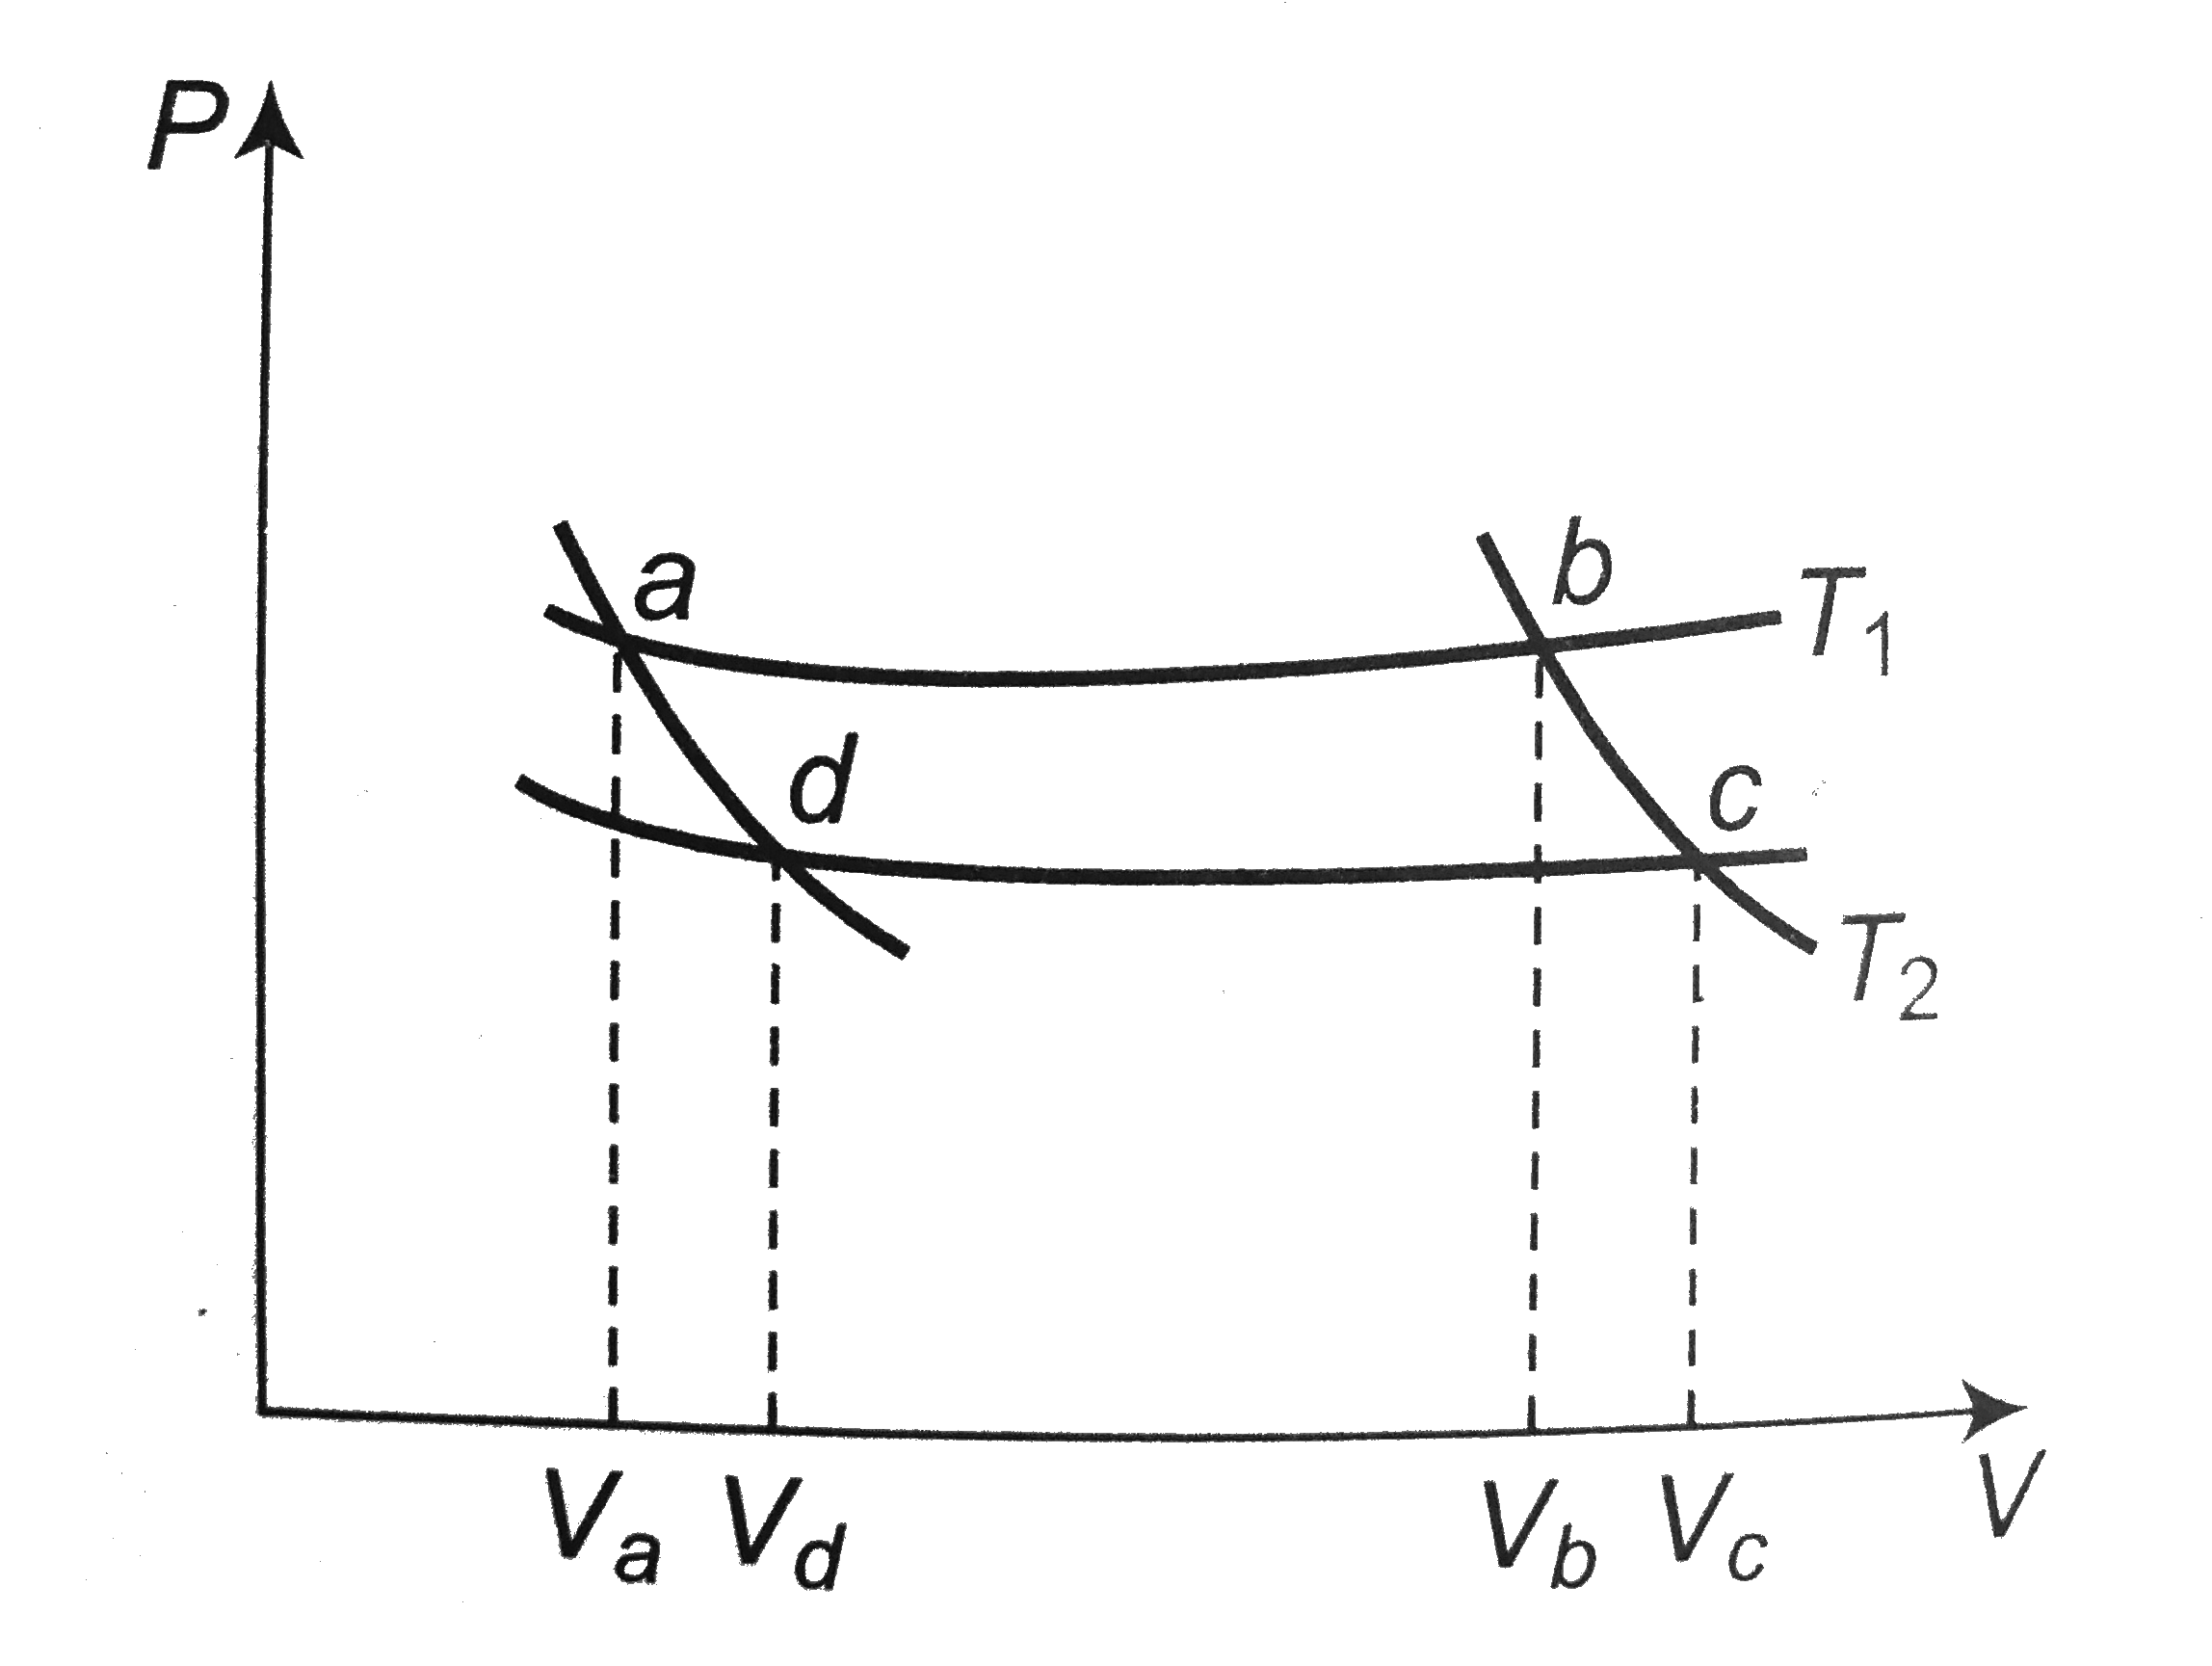
In the following P–V diagram of an ideal gas, two adiabates cut two isotherms at T1 and T2 The value of VB/VC is :
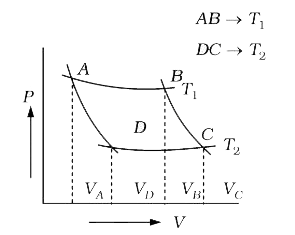 A=VA/VDB<VA/VDC>VA/VDDcannot say
In the following P-V diagram of an ideal gas, two adiabates cut two isotherms at T1=300KandT2=200K. The value of VA=2 unit, VB=8 unit, VC=16 unit. Find the value of VD .
 A4 unitB<4 unitC>5 unitD5 unit
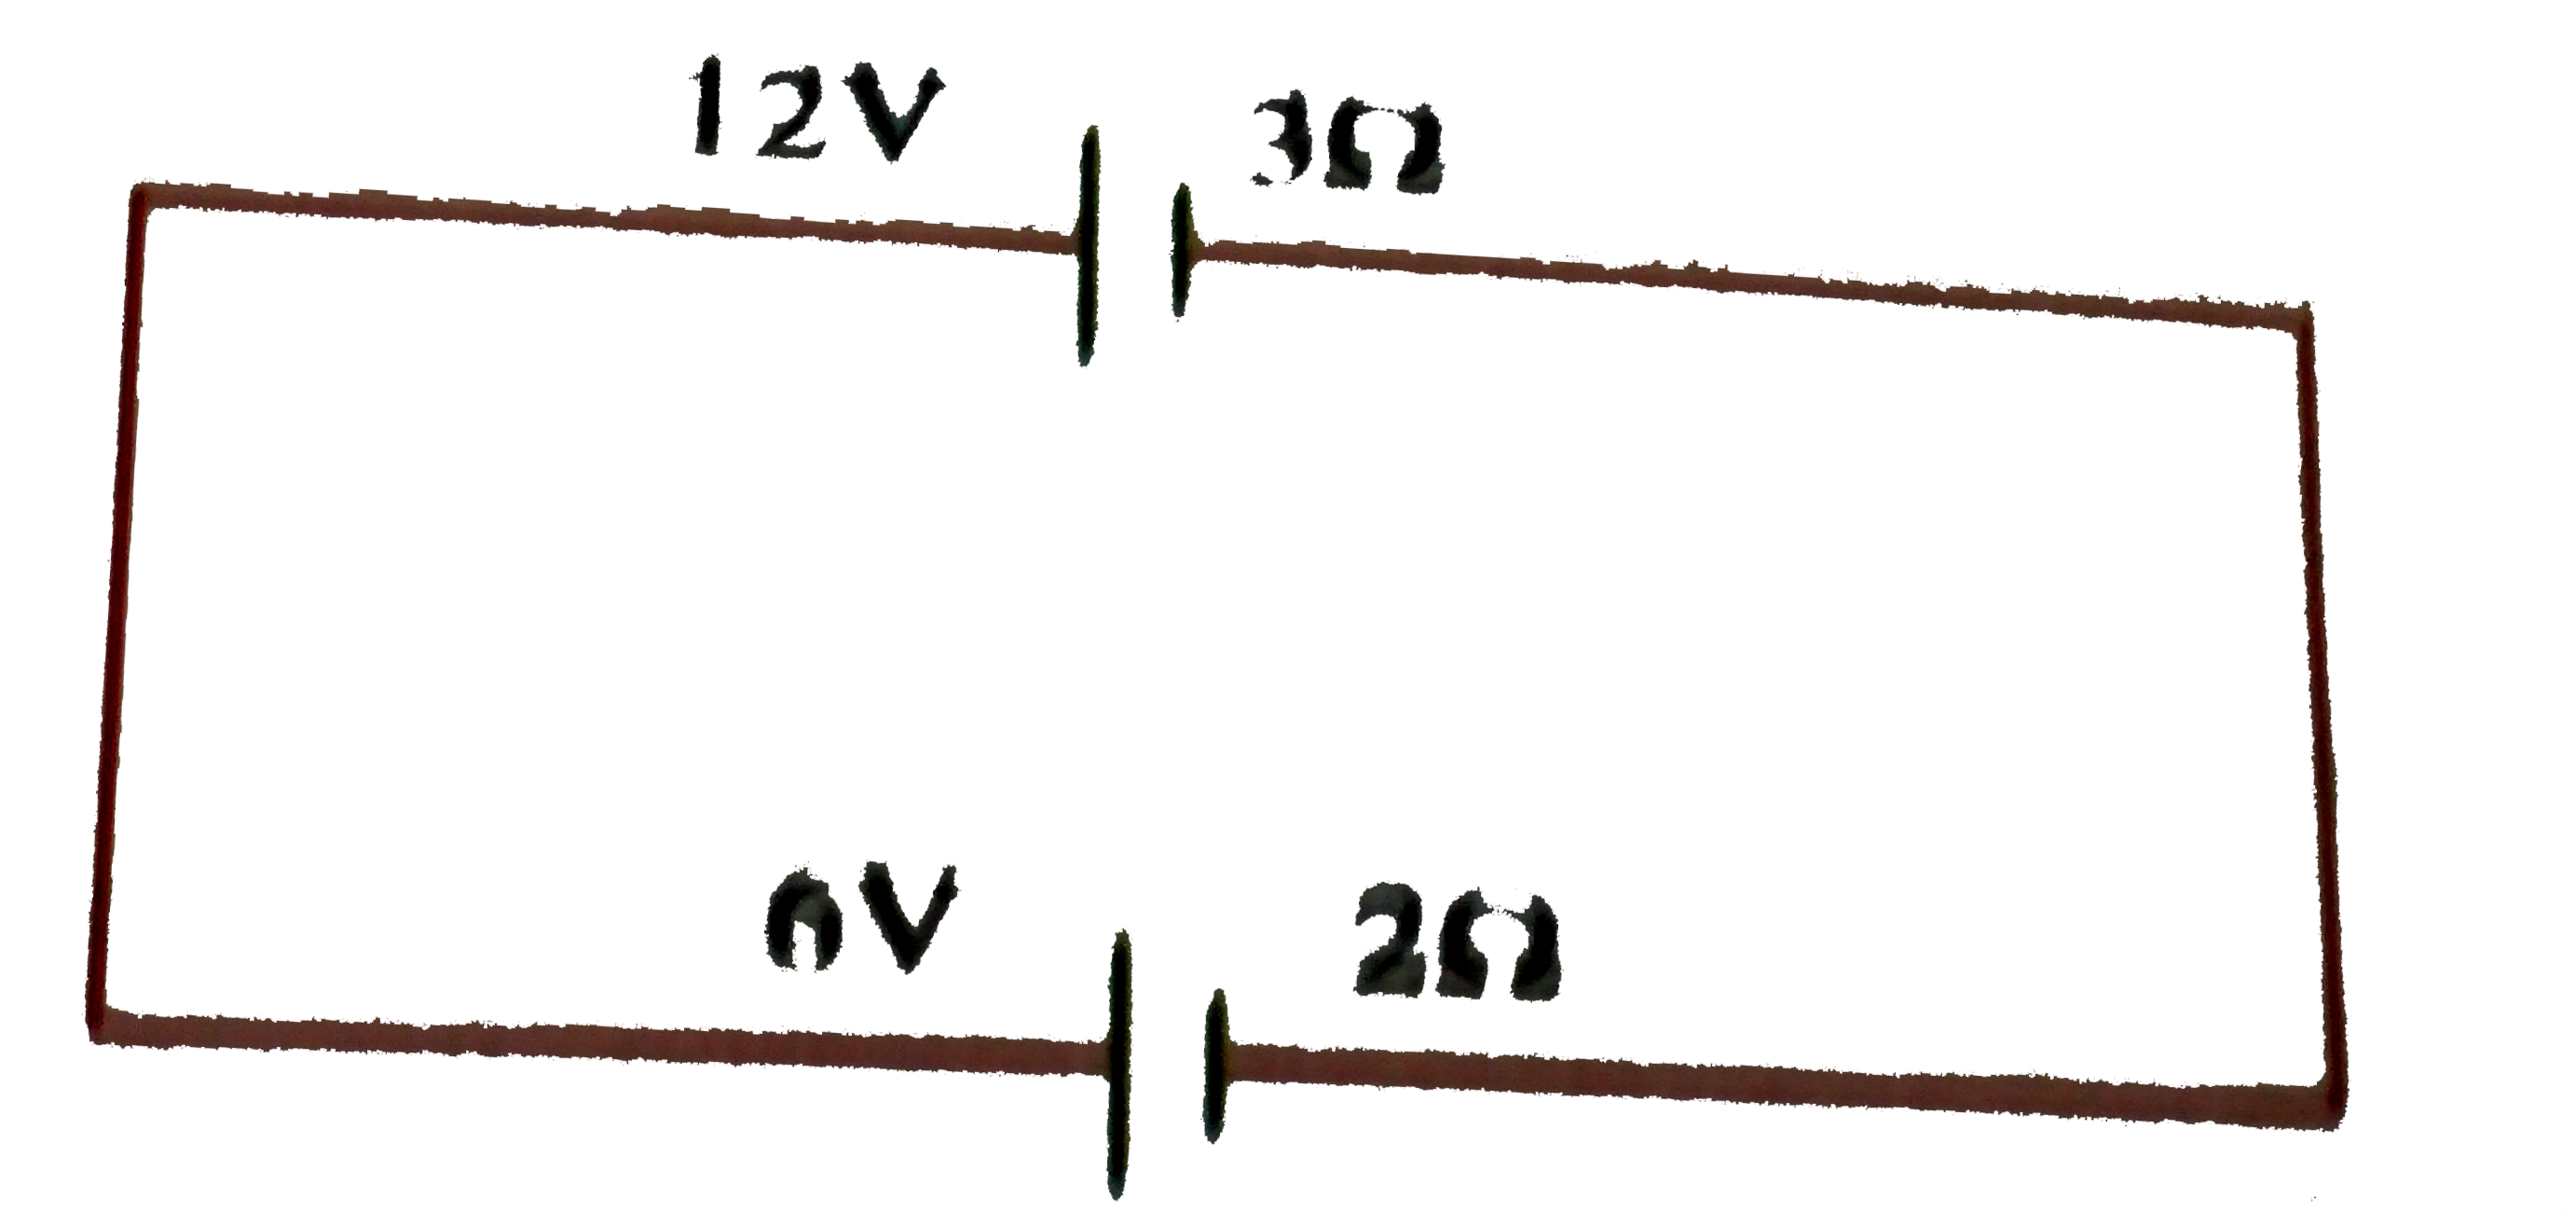
In the following diagram the pd across 6V cell isA6VB5.6VC8.2VD8.4V
In the following V - T diagram what is the relations between P1andP2 :

View SolutionV1,V2 and V3 are the p.ds. across the 1Ω,2Ω and 3Ω resistors in the following diagram, and the current is 5A.

Which one of the columns (a) to (d) shows the correct values of V1,V2 and V3 measured in volts?
View SolutionIn the given diagram if V represent the stopping potential and wavelength of incident light is λ. If V2>V1 then
View SolutionIn the following P-V diagram two adiabatics cut two isothermals at temperature T1andT2 (fig). The value of VaVd will be
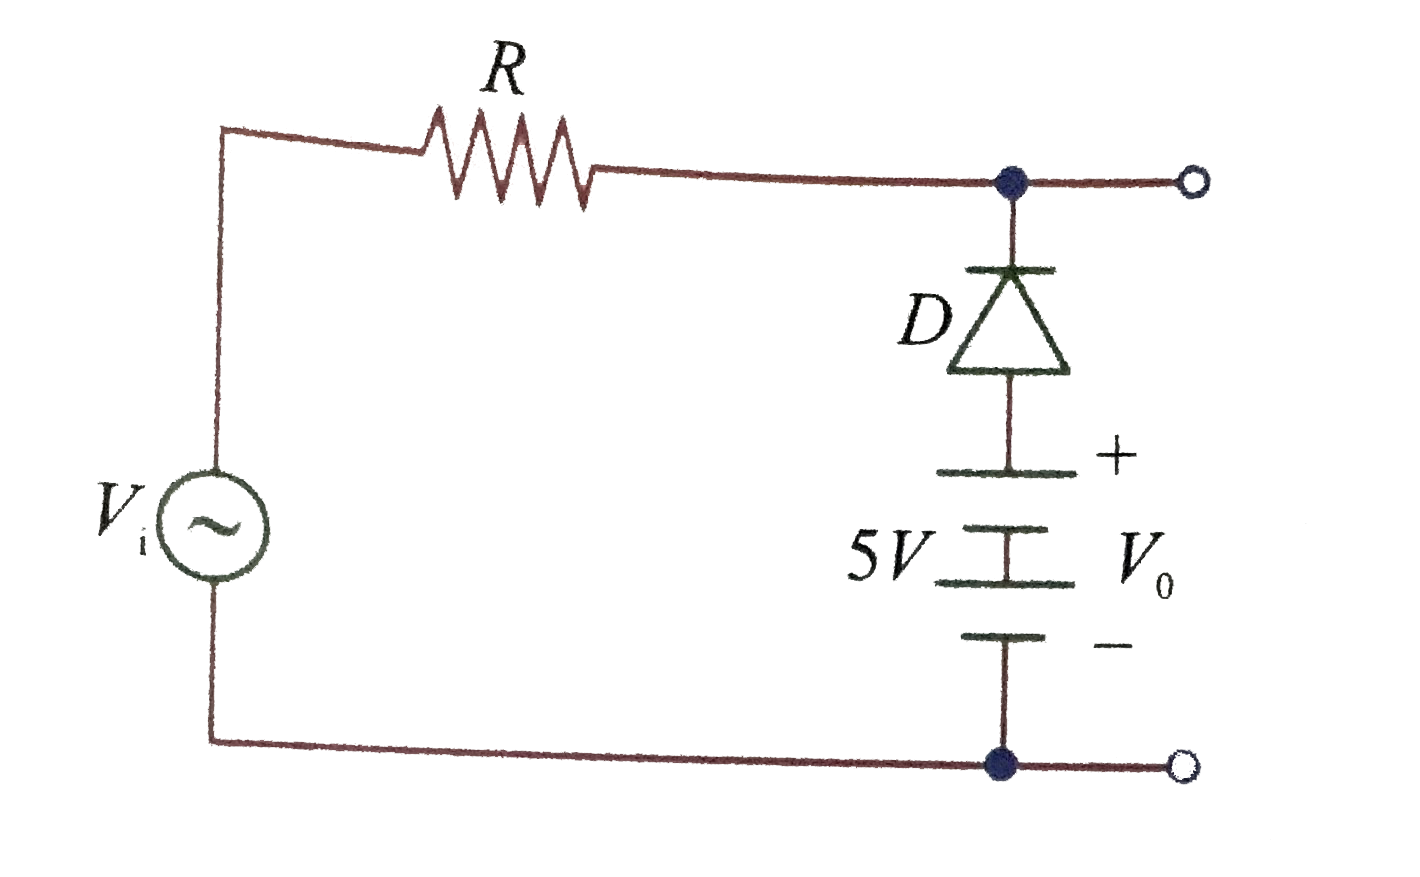
View SolutionIn the diagram D an ideal diode and an alternating voltage of peak value 10V is connected as input V1. Which of the following diagram represents the correct wavelength of output voltage Vθ ?
 .
.
View Solution
