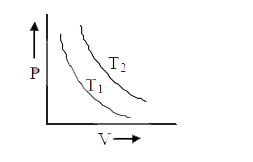
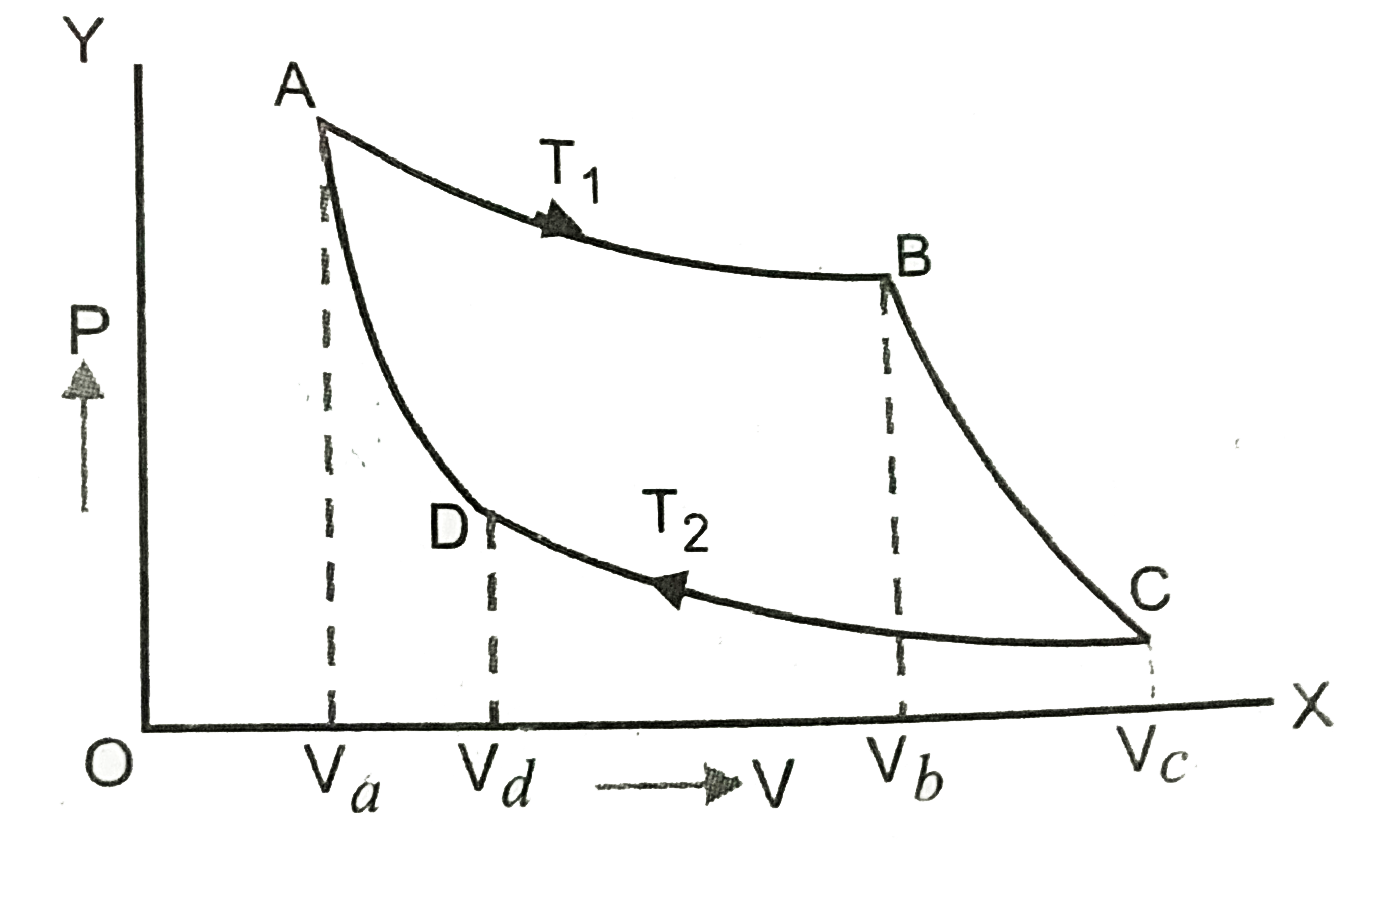
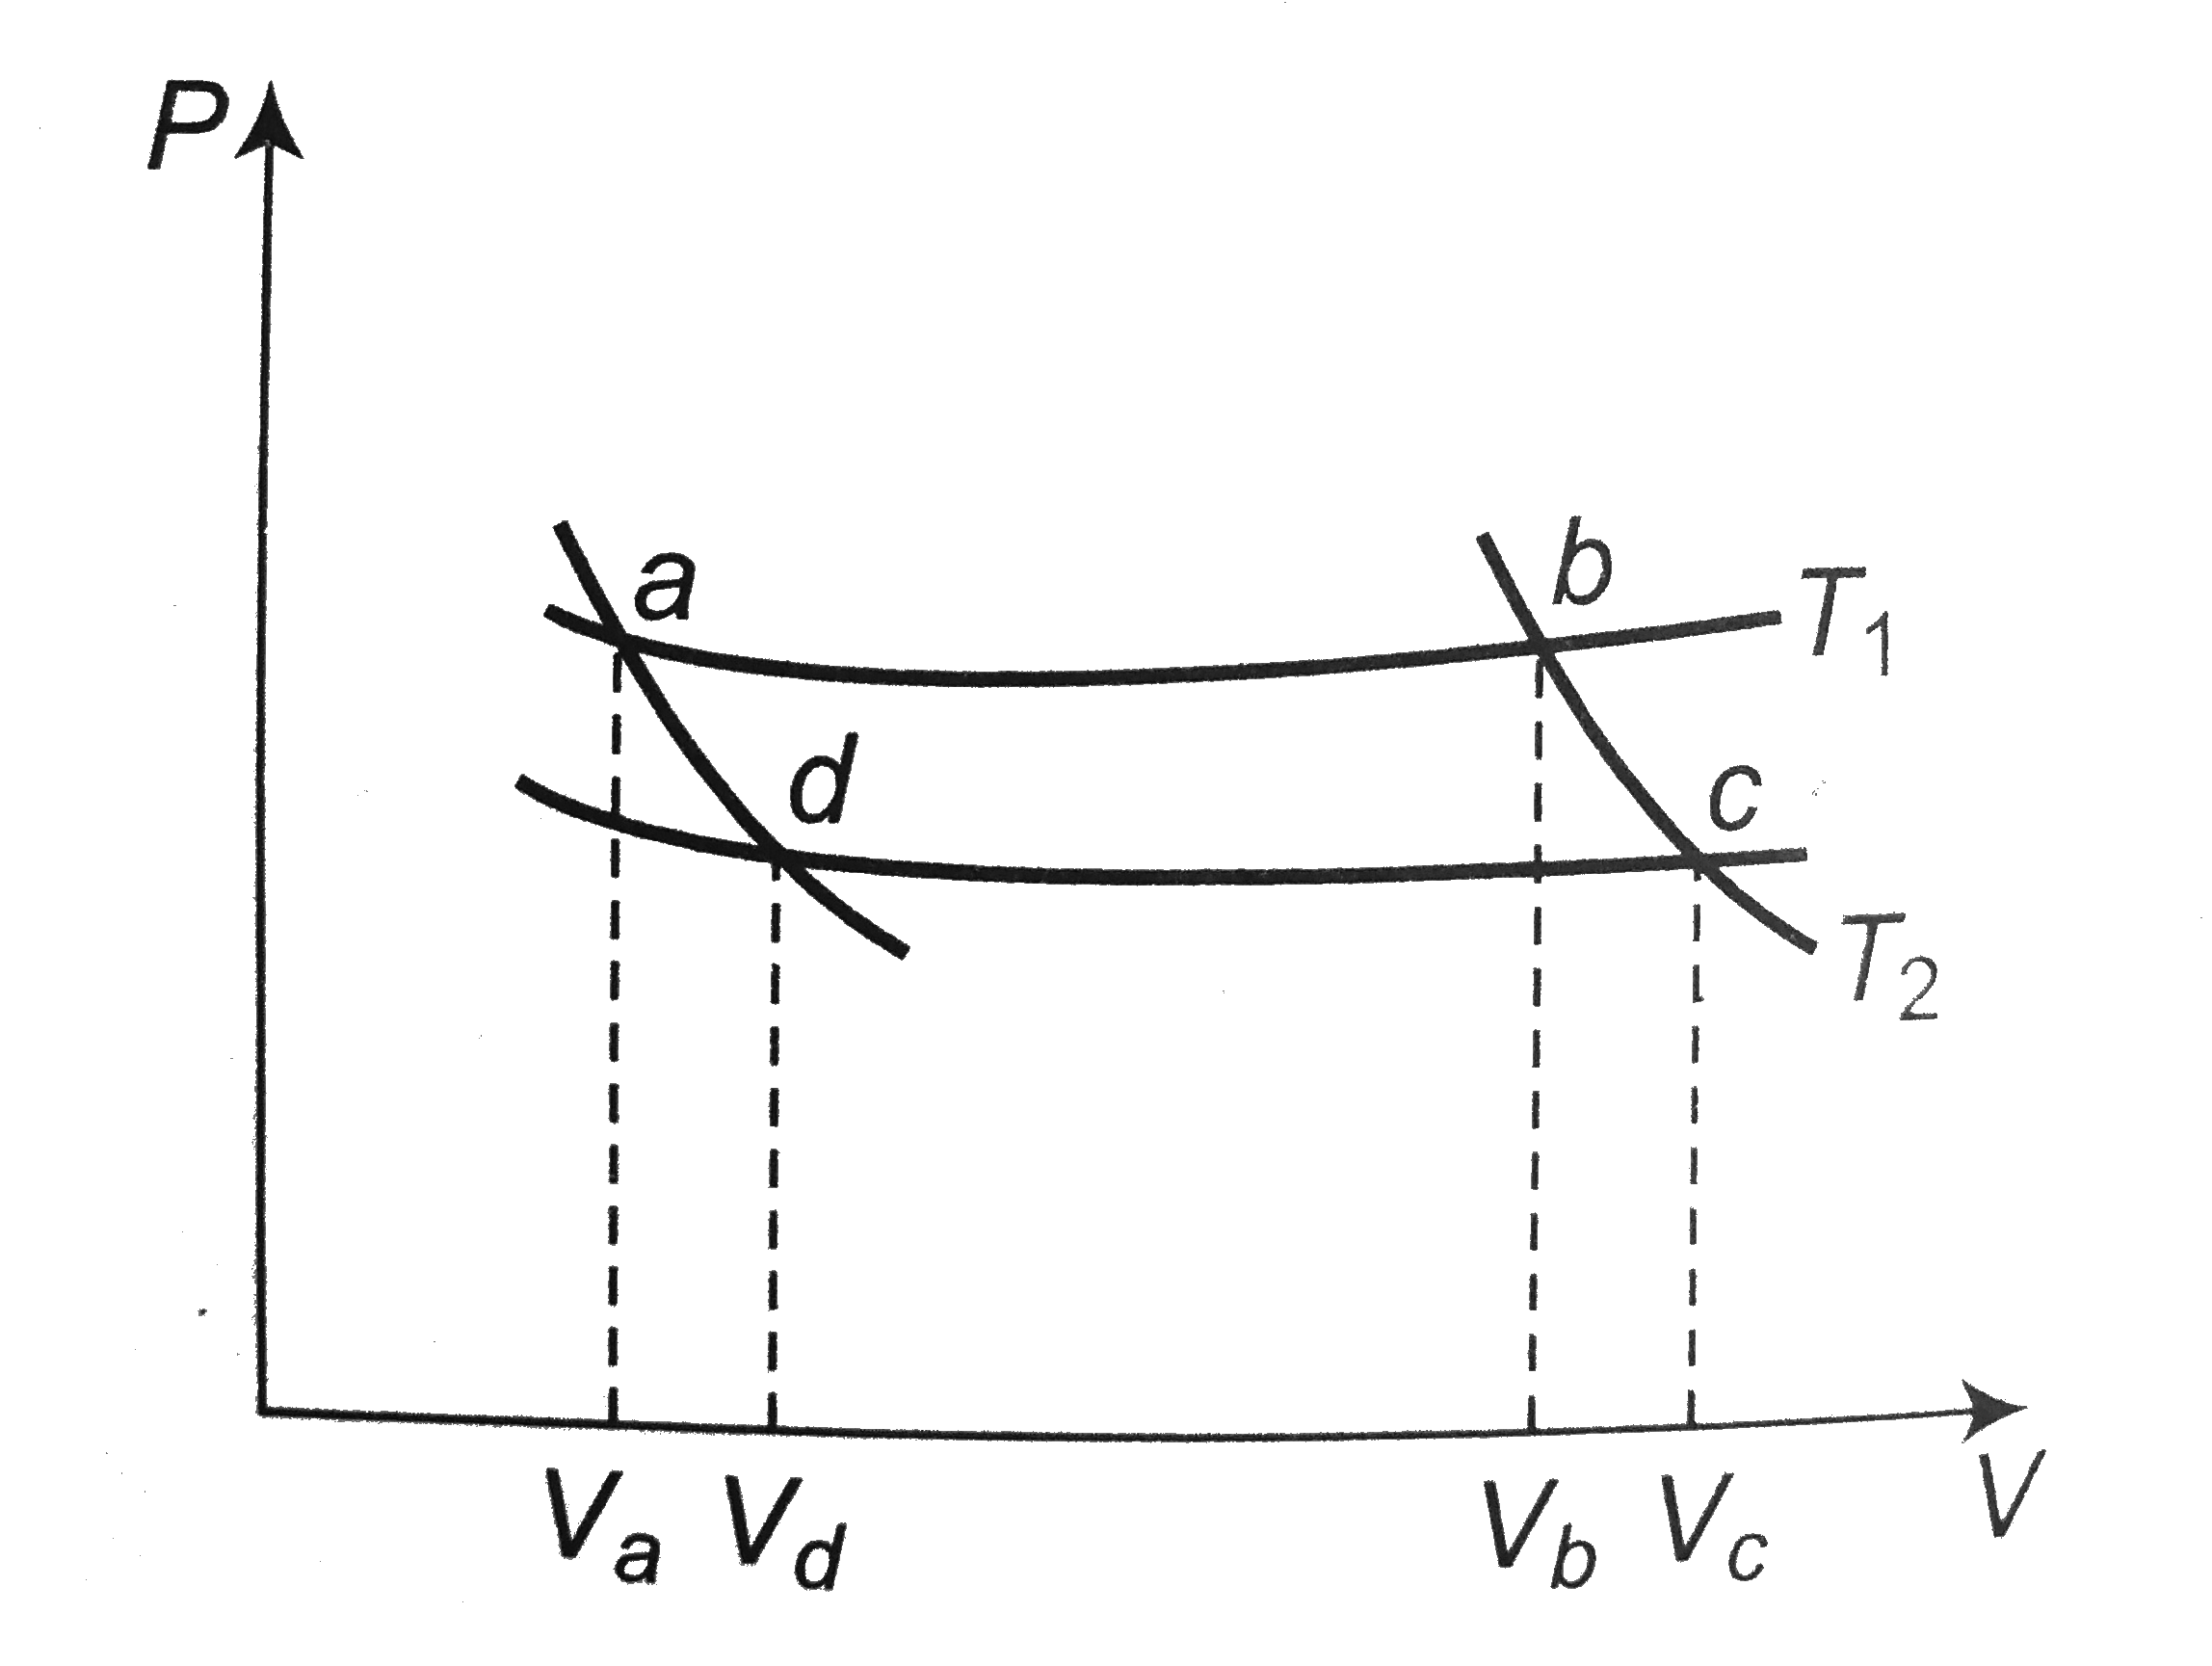
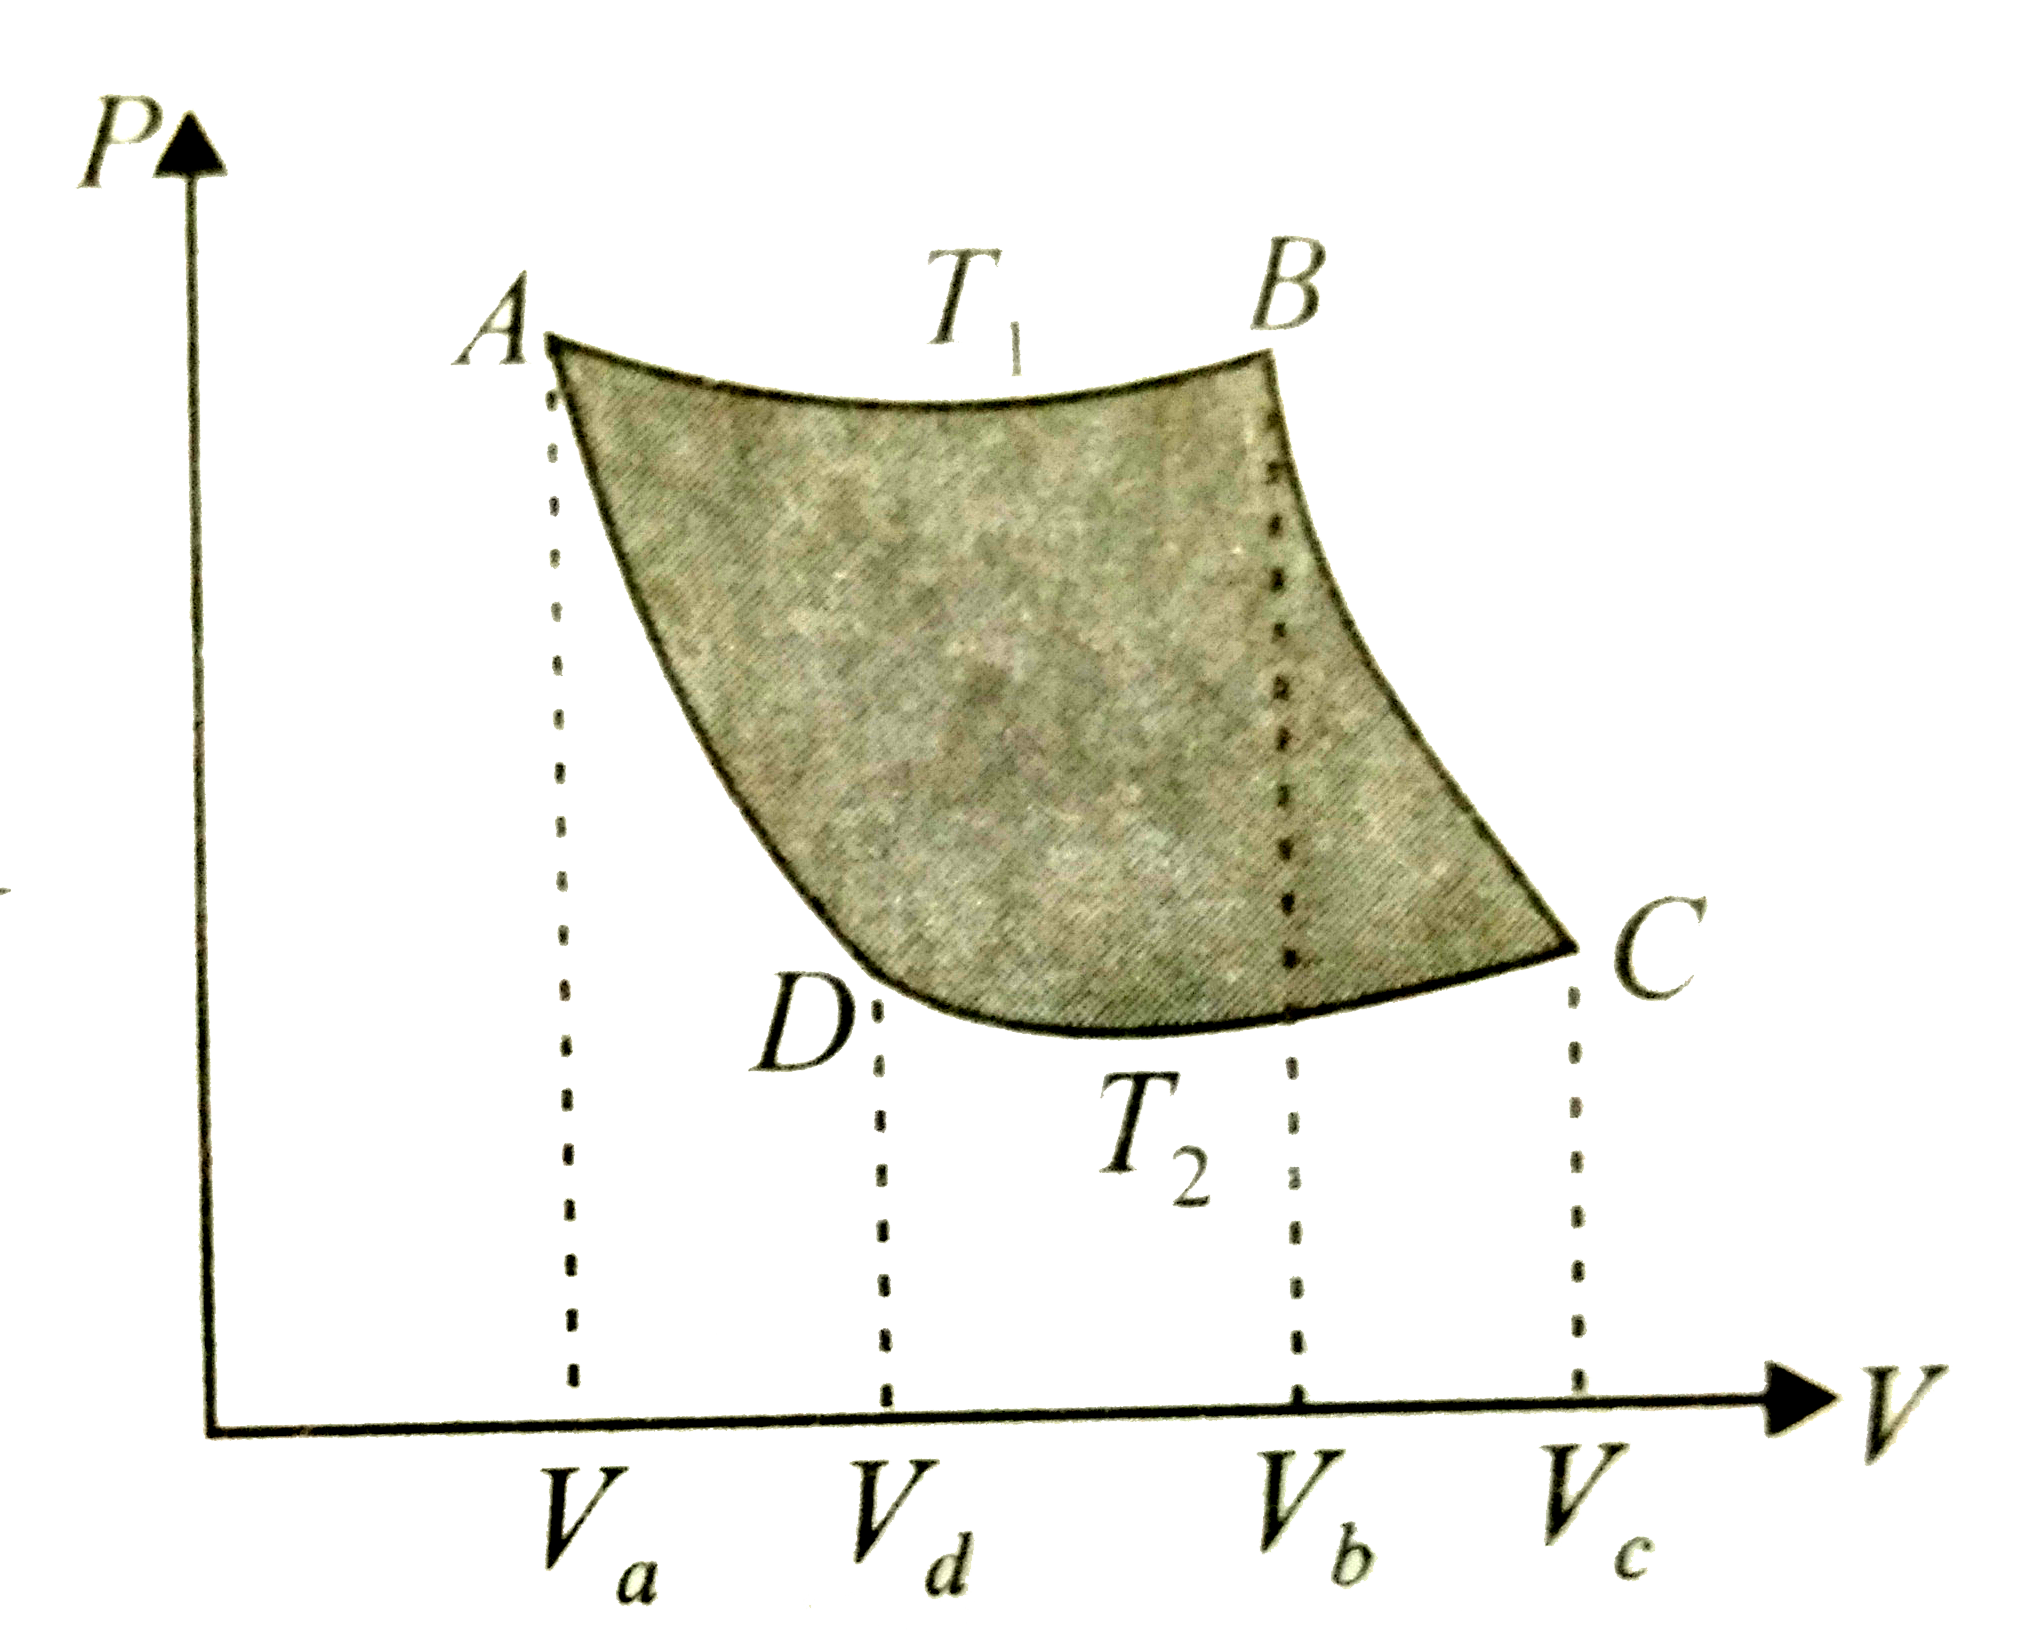
In the following P-V diagram two adiabatics cut two isothermals at temperature T1andT2 (fig). The value of VaVd will be
A
VbVc
B
VcVb
C
VdVa
D
VbVc
Video Solution
Text Solution
The correct Answer is:A
For adiabatic process T1Vγ−1b = constant
For bc curve T1Vγ−1b=T2Vγ−1C or T2T1=(VbVc)γ−1
For ad curve T1Vγ−1a=T2Vγ−1c or T2T1=(VaVd)γ−1
From equation (i) and (ii) , VbVc=VaVd.
|
Topper's Solved these Questions
- KINETIC THEORY OF GASES AND THERMODYNAMICSBOOK - A2ZCHAPTER - KINETIC THEORY OF GASES AND THERMODYNAMICSEXERCISE - Second Law Of Thermodynamics
29 Videos
- KINETIC THEORY OF GASES AND THERMODYNAMICSBOOK - A2ZCHAPTER - KINETIC THEORY OF GASES AND THERMODYNAMICSEXERCISE - Problems Based On Mixed Concepts
49 Videos
- KINETIC THEORY OF GASES AND THERMODYNAMICSBOOK - A2ZCHAPTER - KINETIC THEORY OF GASES AND THERMODYNAMICSEXERCISE - First Law Of Thermodynamics , Internal Energy And Work Done
55 Videos
- GRAVITATIONBOOK - A2ZCHAPTER - GRAVITATIONEXERCISE - Chapter Test
29 Videos
- MOCK TESTBOOK - A2ZCHAPTER - MOCK TESTEXERCISE - Motion With Constant Acceleration
15 Videos
Similar Questions
Knowledge Check
In the following P–V diagram of an ideal gas, two adiabates cut two isotherms at T1 and T2 The value of VB/VC is :
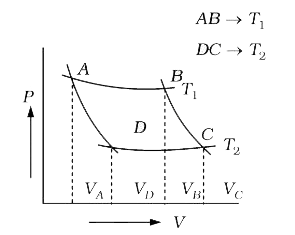 A=VA/VDB<VA/VDC>VA/VDDcannot say
In the following P-V diagram of an ideal gas, two adiabates cut two isotherms at T1=300KandT2=200K. The value of VA=2 unit, VB=8 unit, VC=16 unit. Find the value of VD .
 A4 unitB<4 unitC>5 unitD5 unit
Two different adiabatic parts for the same gas intersect two isothermals at T1andT2 shown in P-V diagram . Then the ratio of VaVb will be
 AVcVdBVdVcCγVdVcD1γVdVc
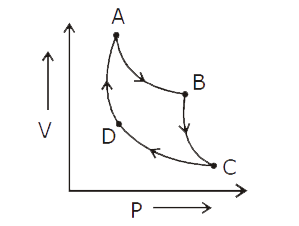
In the P - V diagram, the point B and C correspond to temperatures T1andT2 respectively. State relationship between T1andT2.
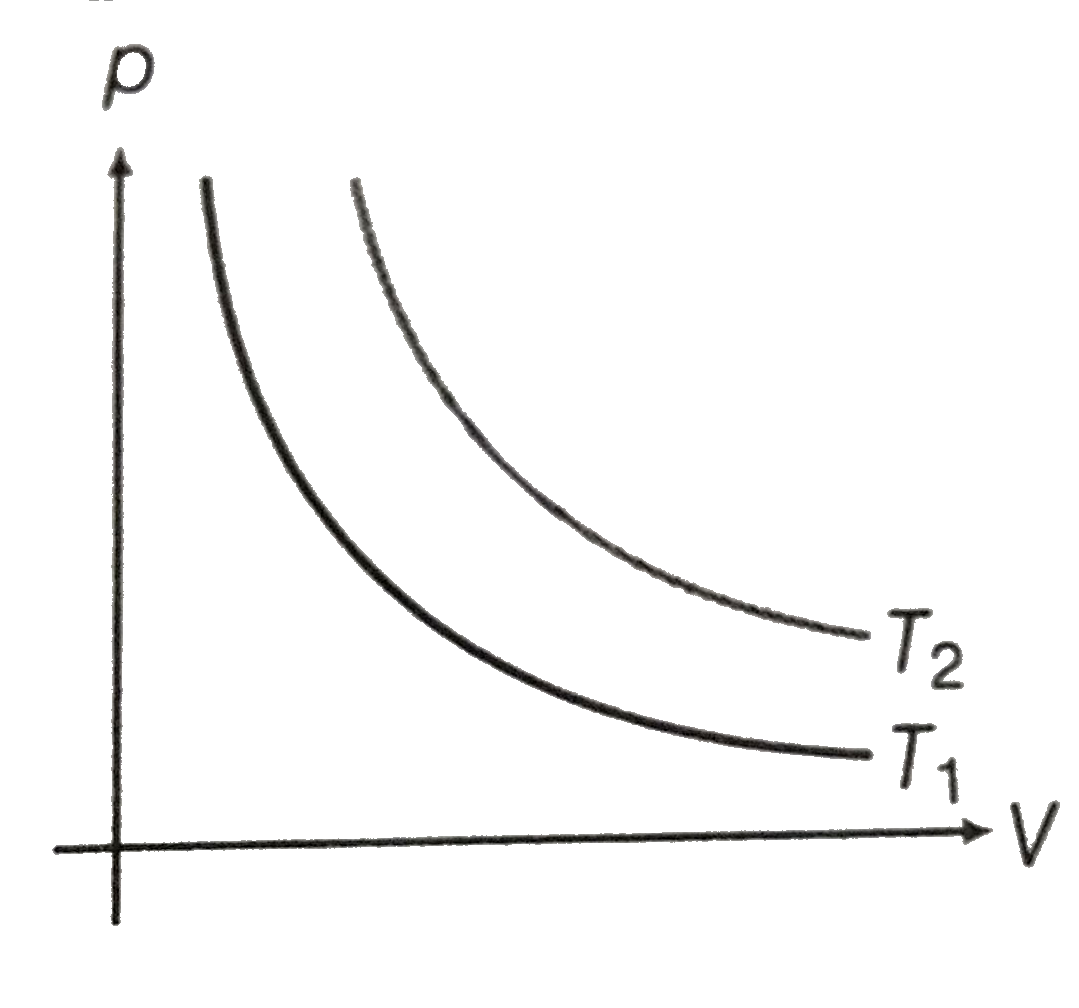
View SolutionThe p−V diagrams of same mass of a gas are drawn at two different temperatues T1 and T2 Explain whether T1>T2> or T2>T1.
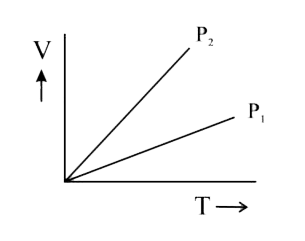
View SolutionIn V-T diagram shown in fig., what is the relation between P1andP2 ?
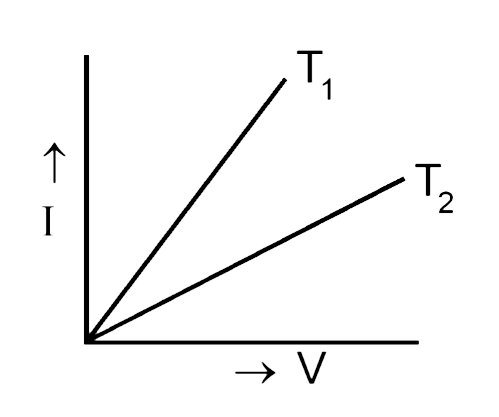
View SolutionThe voltage V and current I v graphs for a conductor at two different temperatures T1andT2 are shown in the figure. The relation between T1andT2 is

View SolutionThe current (I) and voltage (V) graphs for a given metallic wire at two different temperature (T1) and (T2) are shown in fig. It is concluded that
View Solution

