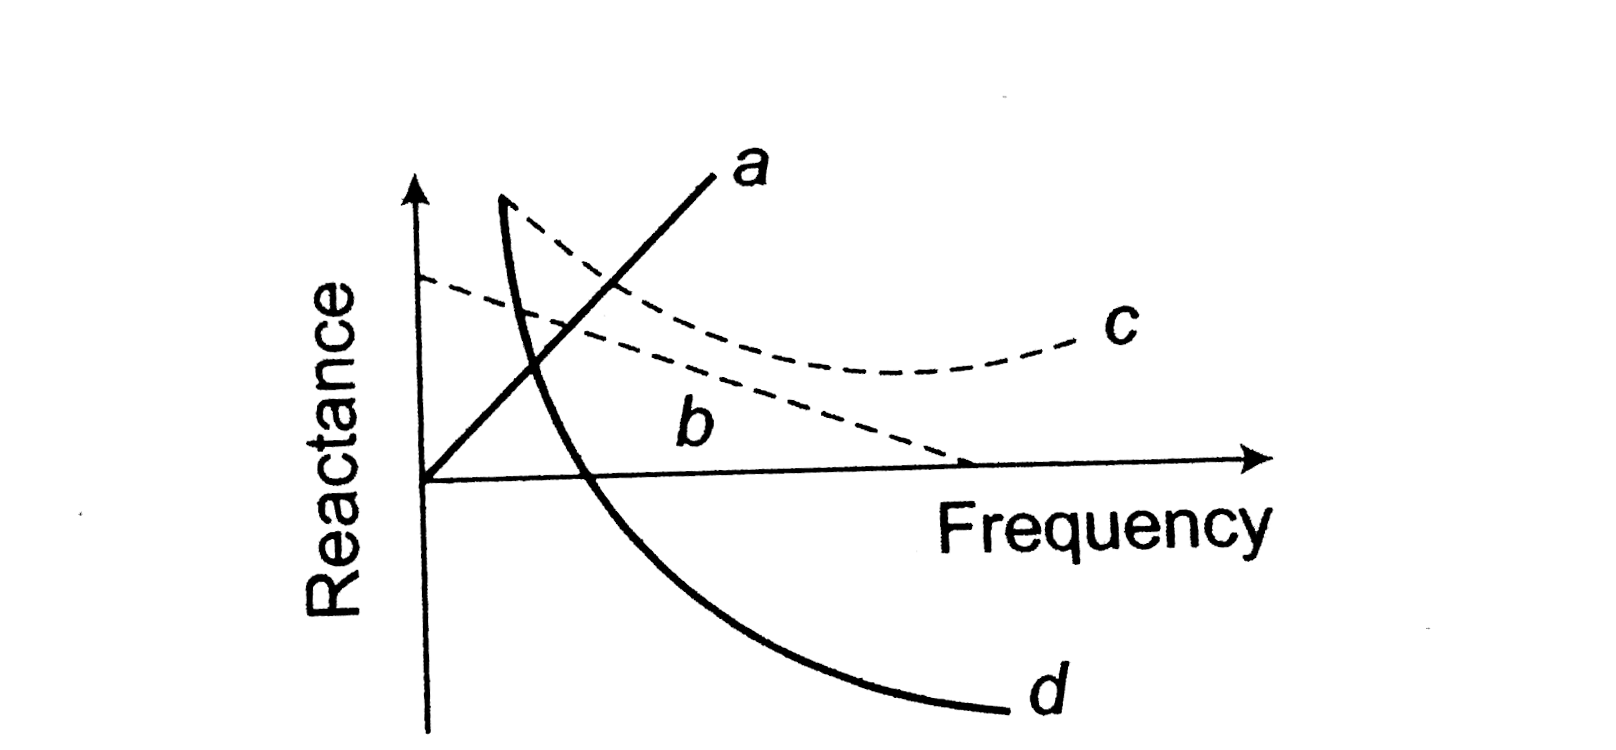
Which of the following plots may represent the thermal energy produced in a resistor for a given current as a function of time?

A
a
B
b
C
c
D
d
Video Solution
Text Solution
The correct Answer is:B
(straight line ).
|
Updated on:21/07/2023
Topper's Solved these Questions
- BOOK - CP SINGHCHAPTER - THERMAL AND ELECTRIC EFFECT oF CURRENTEXERCISE - Exercises101videos
THERMAL AND ELECTRIC EFFECT oF CURRENT
- BOOK - CP SINGHCHAPTER - SEMICONDUCTORSEXERCISE - Exercises140videos
SEMICONDUCTORS
- BOOK - CP SINGHCHAPTER - WAVE NATURE OF LIGHTEXERCISE - EXERCISES140videos
WAVE NATURE OF LIGHT
Similar Questions
Knowledge Check
- Question 1 - Select One
Which of the following plots represents an ideal binary mixture?
Aplot of Ptotalv/s1/XB is linear (XB= mole fraction of 'B' in liquid phase)Bplot of Ptotalv/sYA is linear (YB= mole fraction of 'A' in vapour phase)Cplot of 1Ptotalv/sYA is linearDplot of 1Ptotalv/sYB is non linear - Question 2 - Select One
Which of the following plots represents an ideal binary mixture?
APlot of Ptotal v/s 1/XB is linear (XB= mole fraction of 'B' in liquid phase).BPlot of Ptotal v/s 1/XB is linear (YB= mole fraction of 'A' in vapour phase)CPlot of 1Ptotalv/s YA is linearDPlot of 1Ptotalv/s YB is non linear - Question 3 - Select One
Which of the following plots represents an exothermic reaction?
A B
B C
C D
D
Which of the following plots represents an ideal binary mixture ?
View SolutionWhich of the following plots may represent the reactance of a series LC combination?
 View Solution
Which of the following plots does not represent Boyle's law?
View SolutionWhich of the following plots may represent is impedence of a series LCR combination?
View SolutionWhich of the following curves may represent the speed of the electron in a hydrogen atom as a function of the principal quantum number n ?
View Solution


