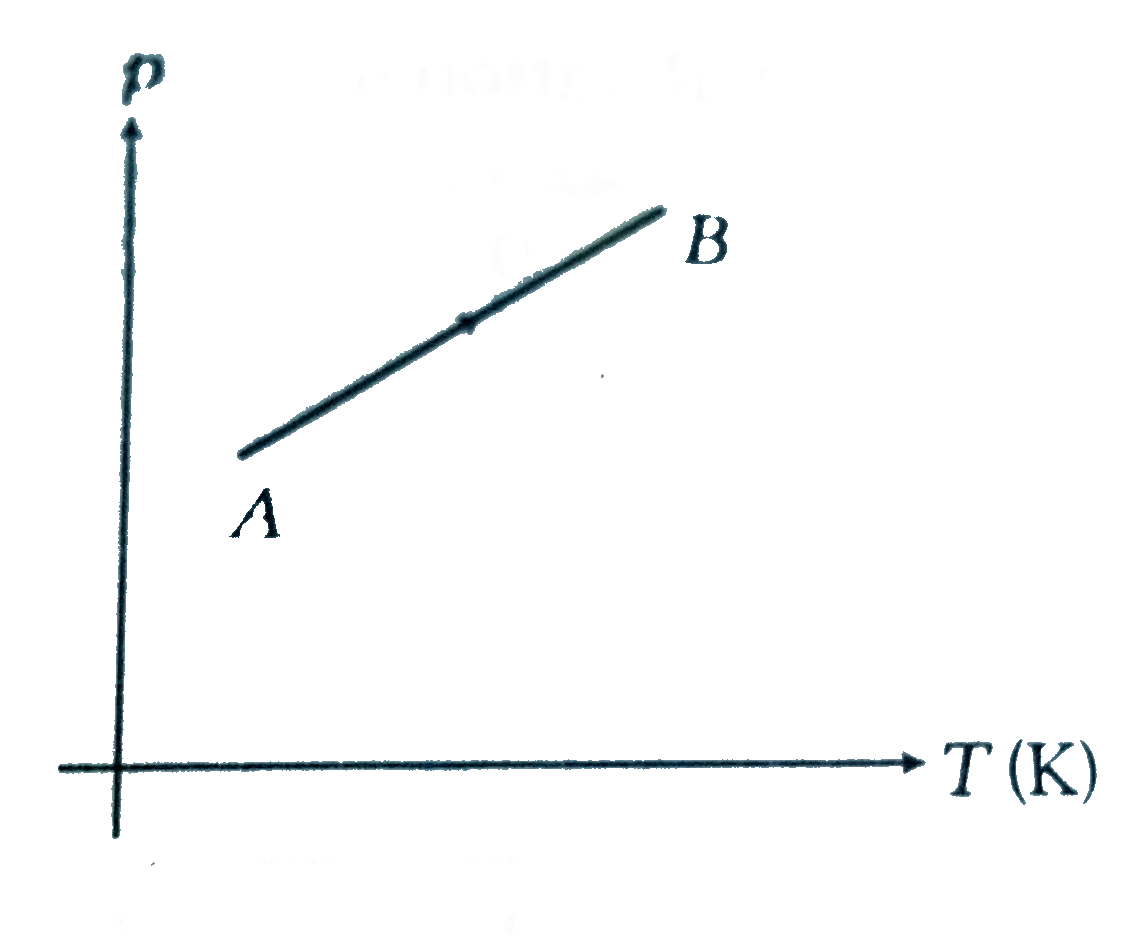
The P−T graph for the given mass of an ideal gas is shown in figure. Then the volume
_E01_022_Q01.png)
increases
decreases
remains constant
data insuficient
The correct Answer is:A
Step by step video, text & image solution for The P-T graph for the given mass of an ideal gas is shown in figure. Then the volume by Physics experts to help you in doubts & scoring excellent marks in Class 11 exams.
Topper's Solved these Questions
- BOOK - NARAYNACHAPTER - THERMAL PROPERTIES OF MATTEREXERCISE - LEVEL - I (C.W.)24videos
THERMAL PROPERTIES OF MATTER
- BOOK - NARAYNACHAPTER - THERMAL PROPERTIES OF MATTEREXERCISE - LEVEL - II (C.W.)20videos
THERMAL PROPERTIES OF MATTER
- BOOK - NARAYNACHAPTER - SYSTEM OF PARTICLES AND ROTATIONAL MOTION EXERCISE - EXERCISE - IV39videos
SYSTEM OF PARTICLES AND ROTATIONAL MOTION
- BOOK - NARAYNACHAPTER - THERMODYNAMICSEXERCISE - Exercise187videos
THERMODYNAMICS
Similar Questions
The p−T graph for the given mass of an ideal gas is shown in figure. What inference can be drawn regarding the change in Volume (whtherit is constant, increasing or decreasing) ?
 View Solution
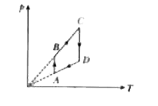
Pressure temperature (p-1) graph of n moles of an ideal gas is shown in the figure. Among the following four graphs, which are the corresponding pressure volume (p-V) and density pressure (p-p) graphs?
 View Solution
Knowledge Check
- Question 1 - Select One
The process on an ideal gas, shown in figure,is <br><imga≤ocr_imageload∈g=lazysrc=https://d10lpgp6xz60nq.cloudfront.net/physics_imagesHCV_VOL2_C24_E01_027_Q01.pngwh=80%mx-autosty≤=background:white;>
A(a)isothermalB(b)isobaricC(c)isochoricD(d)none of these. - Question 2 - Select One
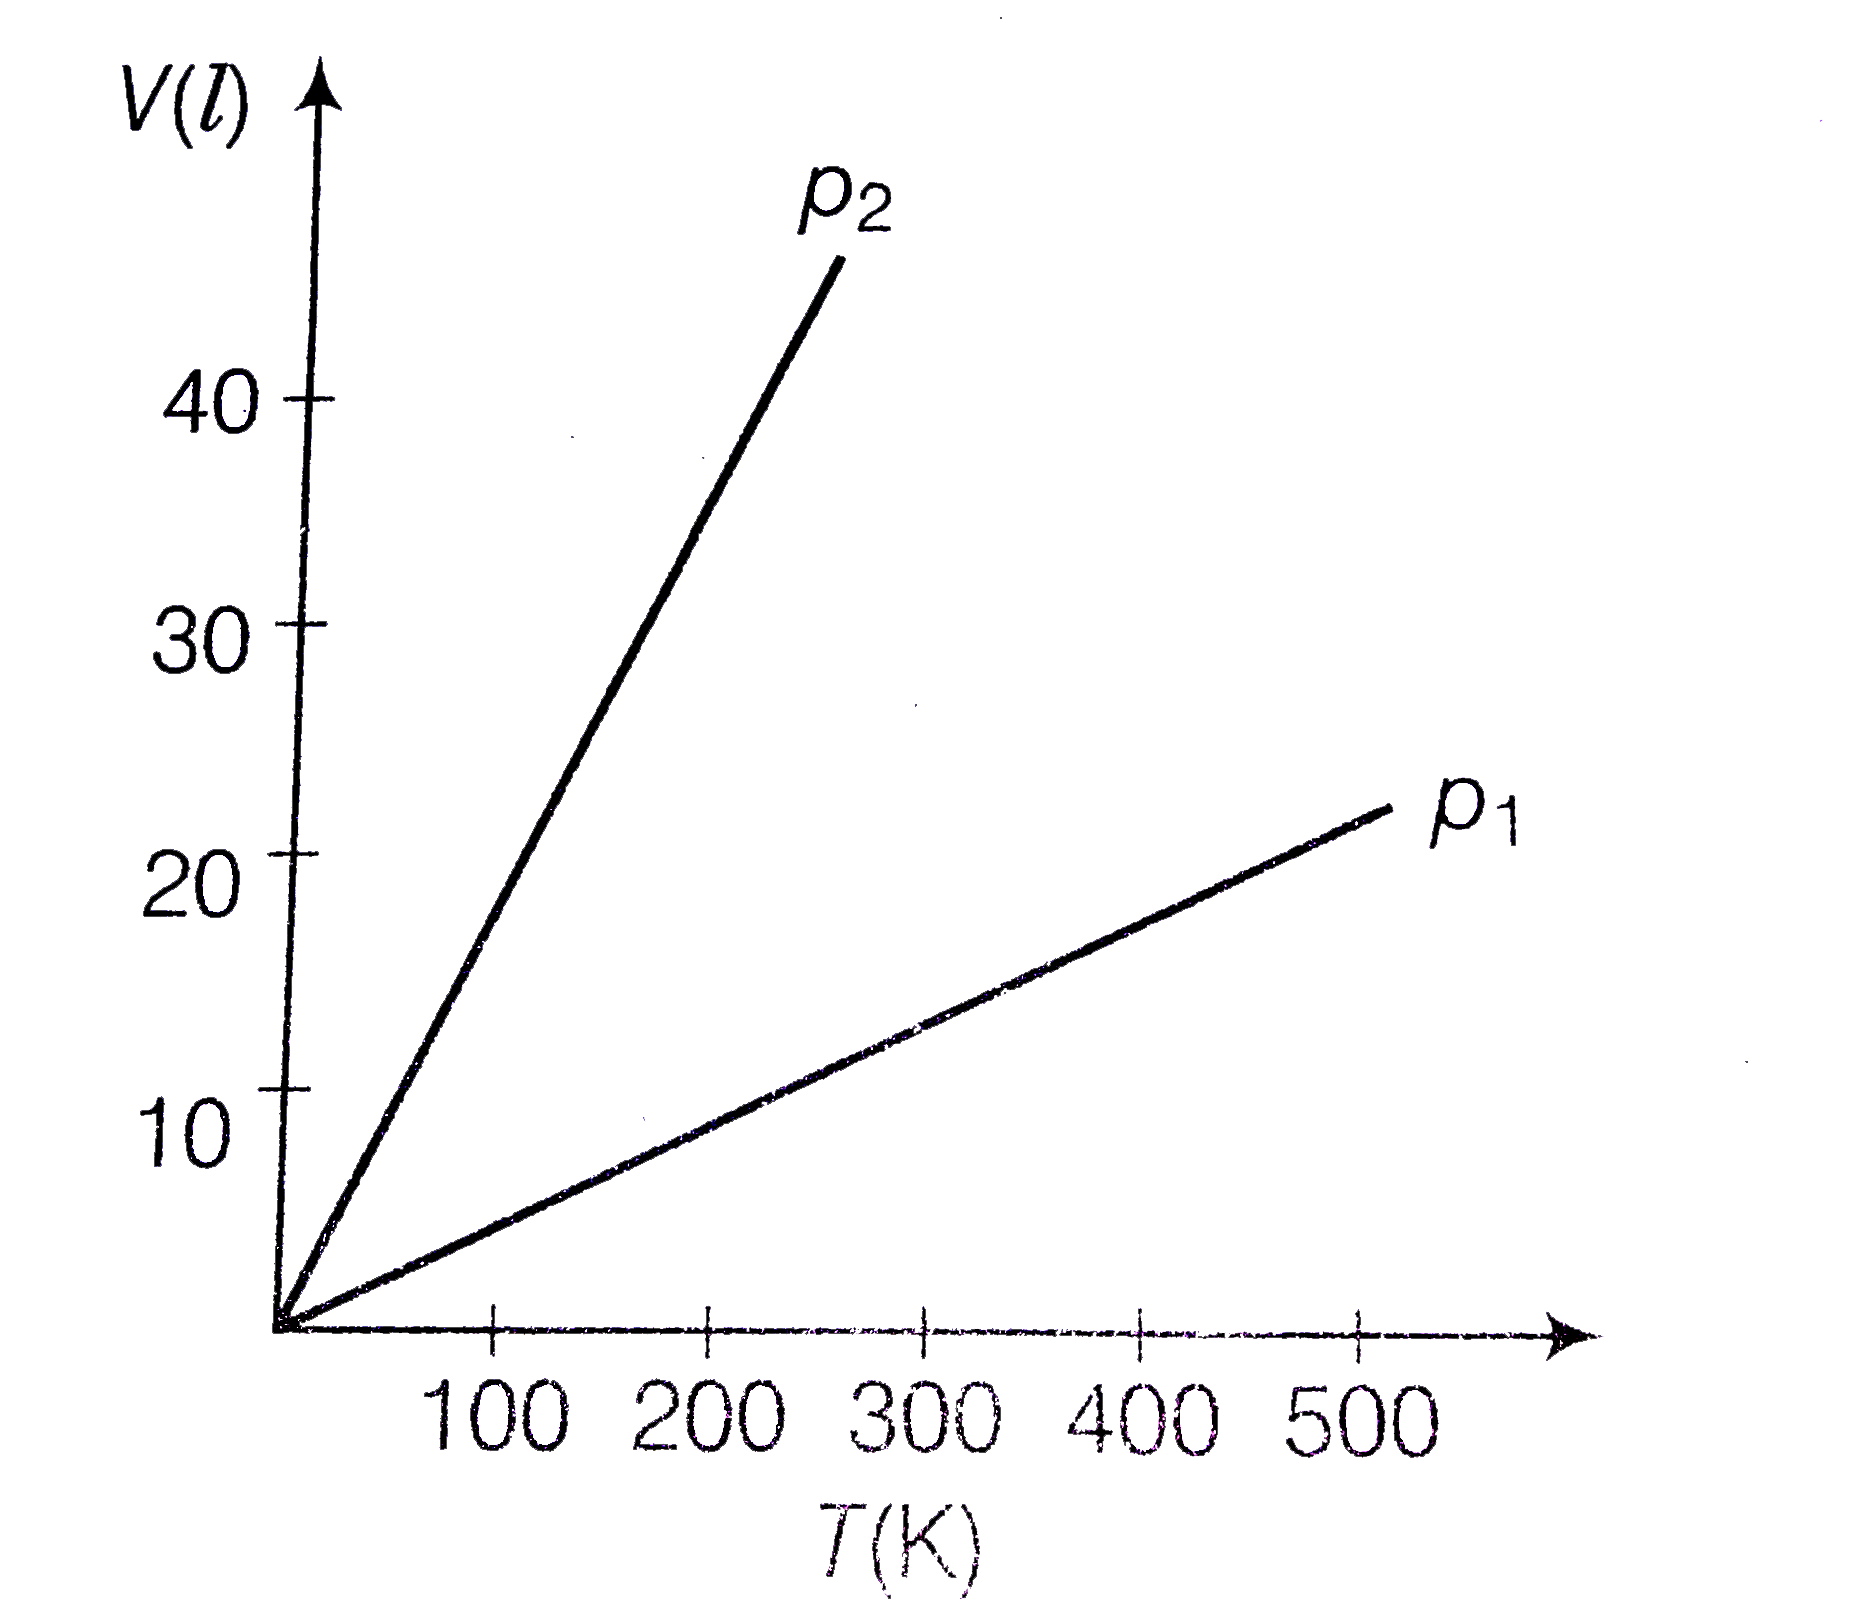
Volume versus temperature graphs for a given mass of an ideal gas are shown in figure. At two different values of constant pressure. What can be inferred about relation between P1 and P2 ?
 AP1>P2BP1=P2CP1<P2DData is insufficient
 - Question 3 - Select One
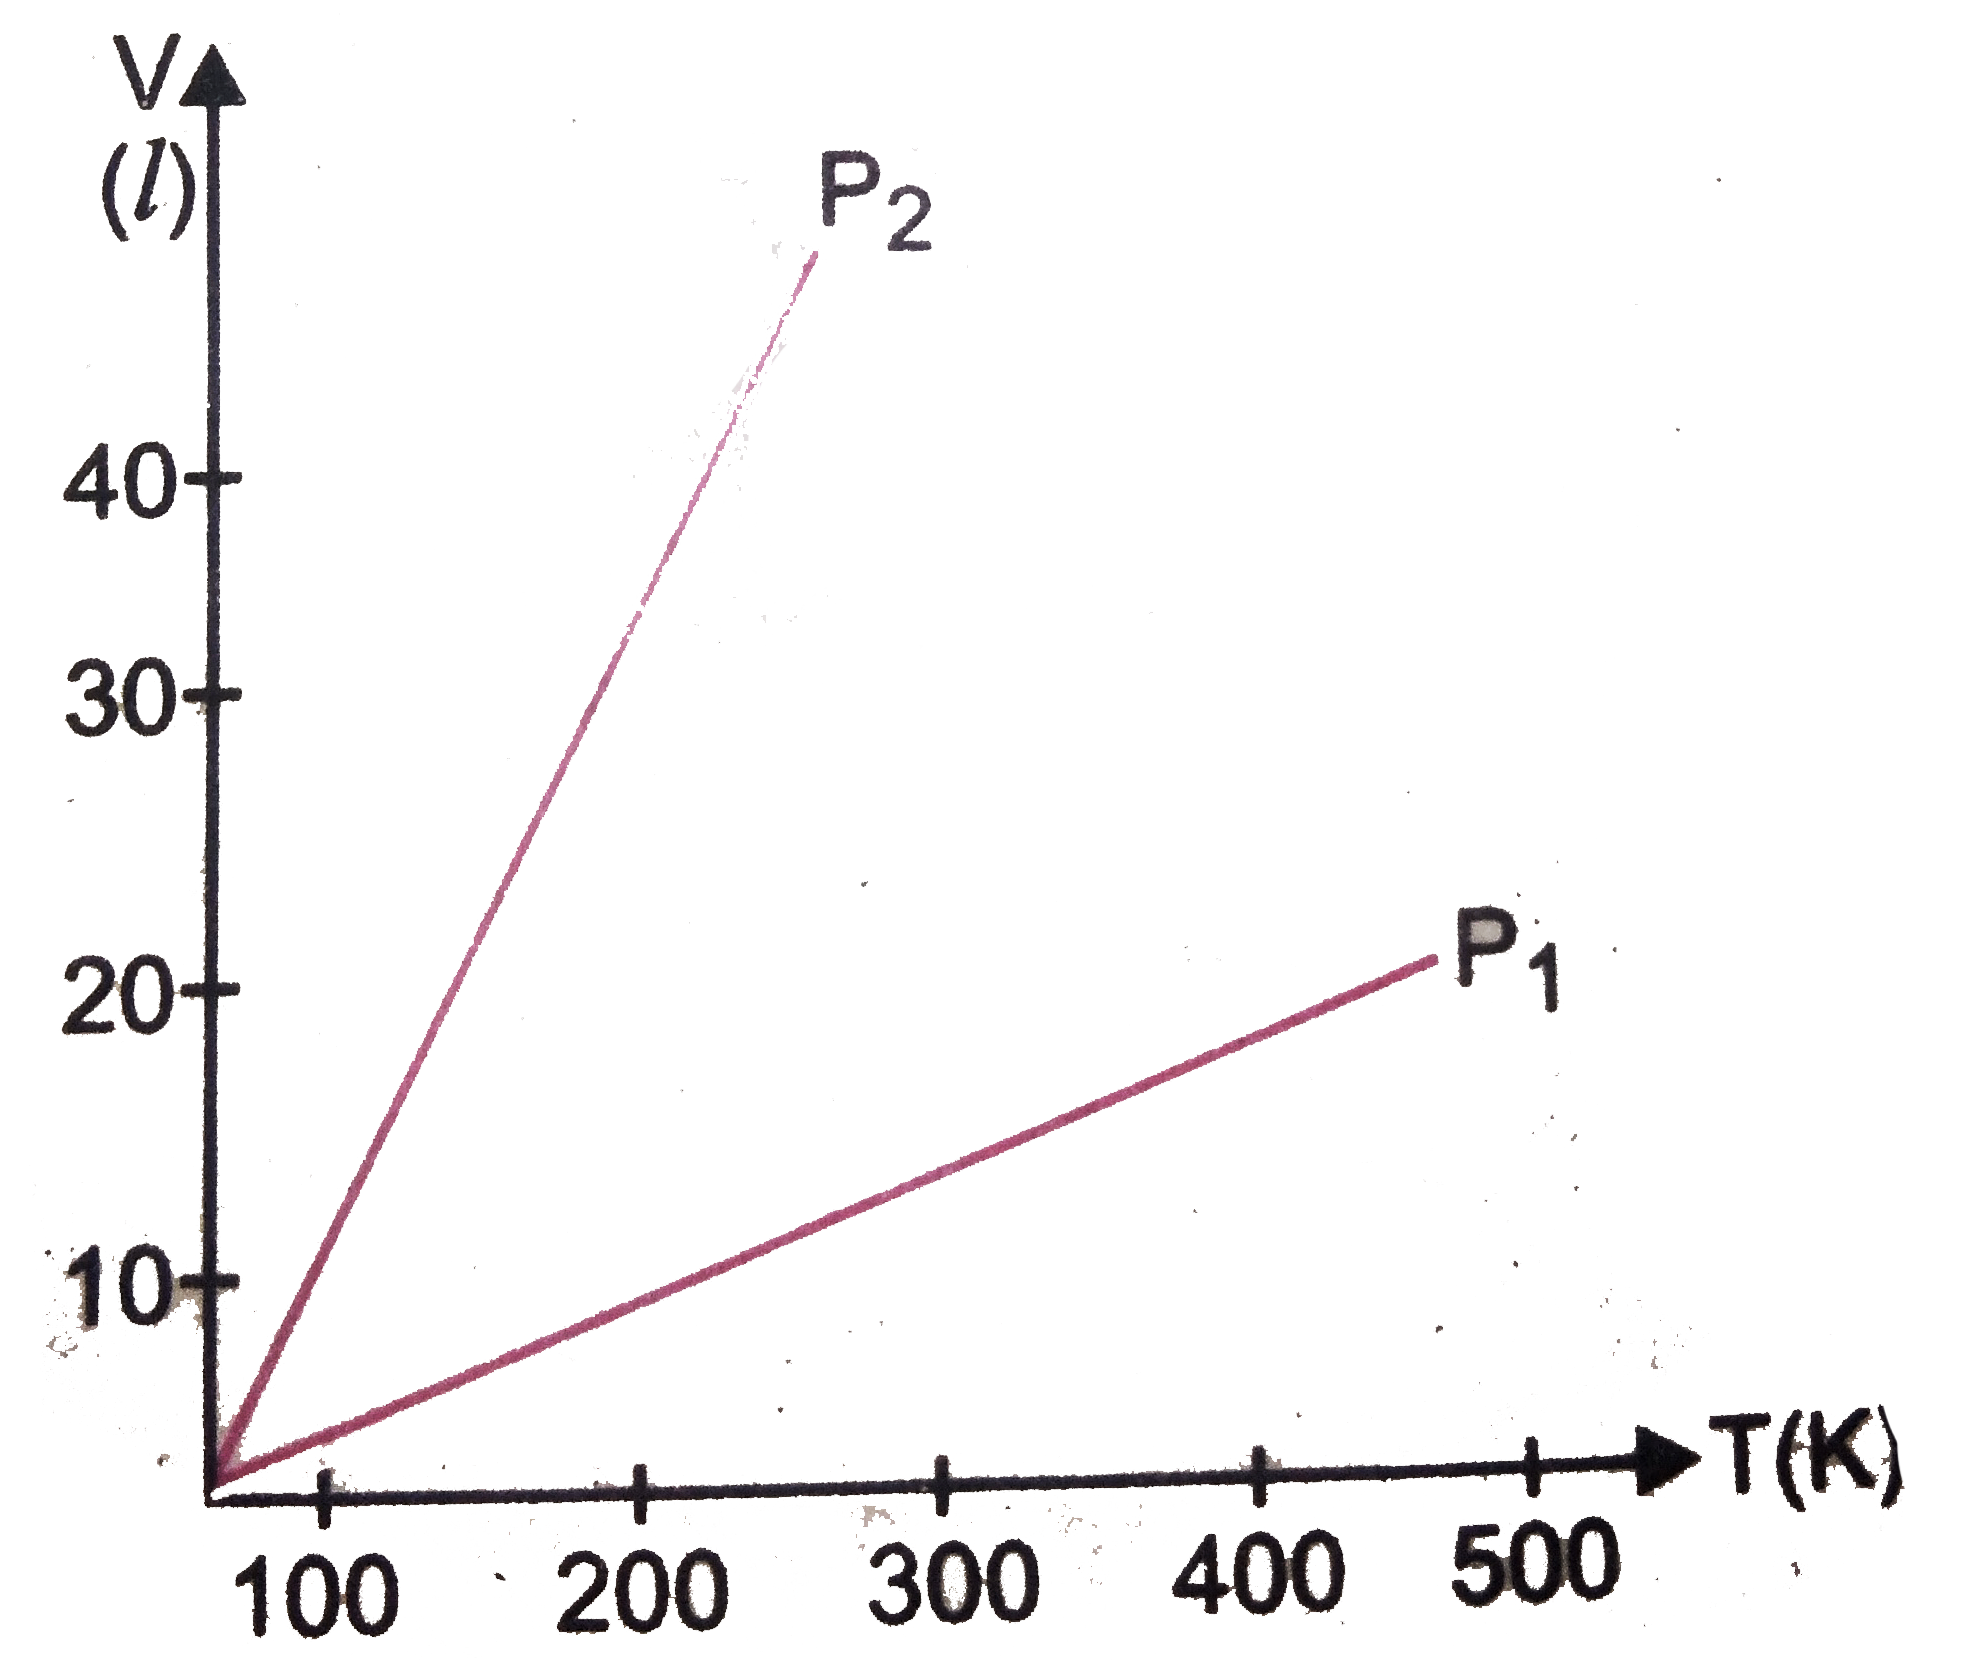
Volume versus temperature graphs for a given mass of an ideal gas are shown in Fig. at two different values of constant pressure. What can be inferred about relation between P1andP2?
 AP1>P2BP1=P2CP1<P2Ddata is insufficient.
V-T graph of a process of monoatomic ideal gas is shown in figure.
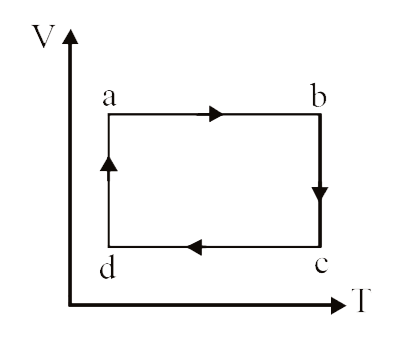
Change in internal energy of the gas is zero in process(s)-View SolutionV-T graph of a process of monoatomic ideal gas is shown in figure.
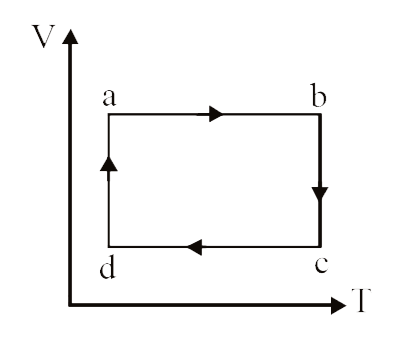
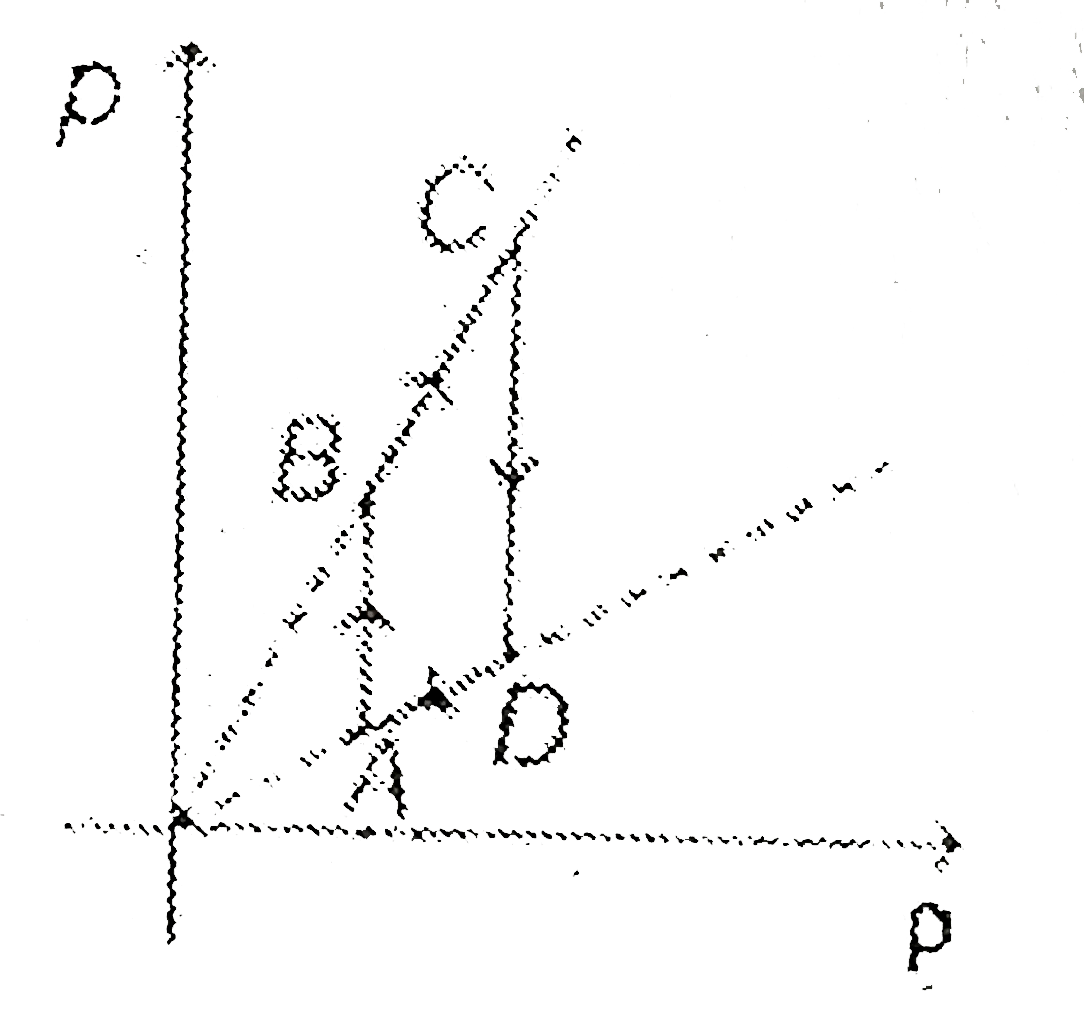
Heat is supplied to the gas in process(s)-View SolutionPressure versus density graph of an ideal gas is shown in figure
 View Solution
V−T diagram for a process of given mass of ideal gas is as shown in fig. During the process pressure of the gas
_E01_072_Q01.png) View Solution
View SolutionThe P-V diagram for an ideal gas is shown in figure.
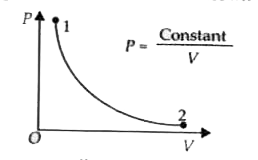
Out of the following diagrams which one represents the T-P diagram ?View Solution
