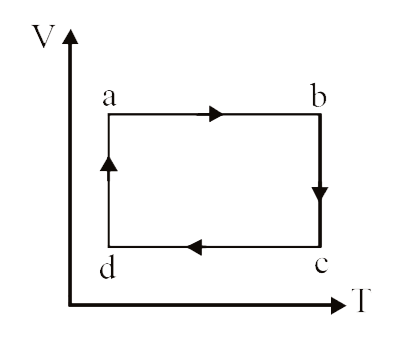
diagram for a process of given mass of ideal gas is as shown in fig. During the process pressure of the gas
_E01_072_Q01.png)
A
First increases then decreases
B
First decreases then increases
C
continously decreases
D
continously increases
Video Solution
Text Solution
The correct Answer is:C
|
Topper's Solved these Questions
- THERMAL PROPERTIES OF MATTERBook:NARAYNAChapter:THERMAL PROPERTIES OF MATTERExercise:LEVEL-I (C.W.)
Explore 23 Videos
- THERMAL PROPERTIES OF MATTERBook:NARAYNAChapter:THERMAL PROPERTIES OF MATTERExercise:LEVEL-II (C.W.)
Explore 27 Videos
- THERMAL PROPERTIES OF MATTERBook:NARAYNAChapter:THERMAL PROPERTIES OF MATTERExercise:Examples
Explore 50 Videos
- SYSTEM OF PARTICLES AND ROTATIONAL MOTION Book:NARAYNAChapter:SYSTEM OF PARTICLES AND ROTATIONAL MOTION Exercise:EXERCISE - IV
Explore 39 Videos
- THERMODYNAMICSBook:NARAYNAChapter:THERMODYNAMICSExercise:Exercise
Explore 187 Videos
Similar Questions
Knowledge Check
Temperature versus pressure graph of an ideal gas is shown in Fig. During the process AB
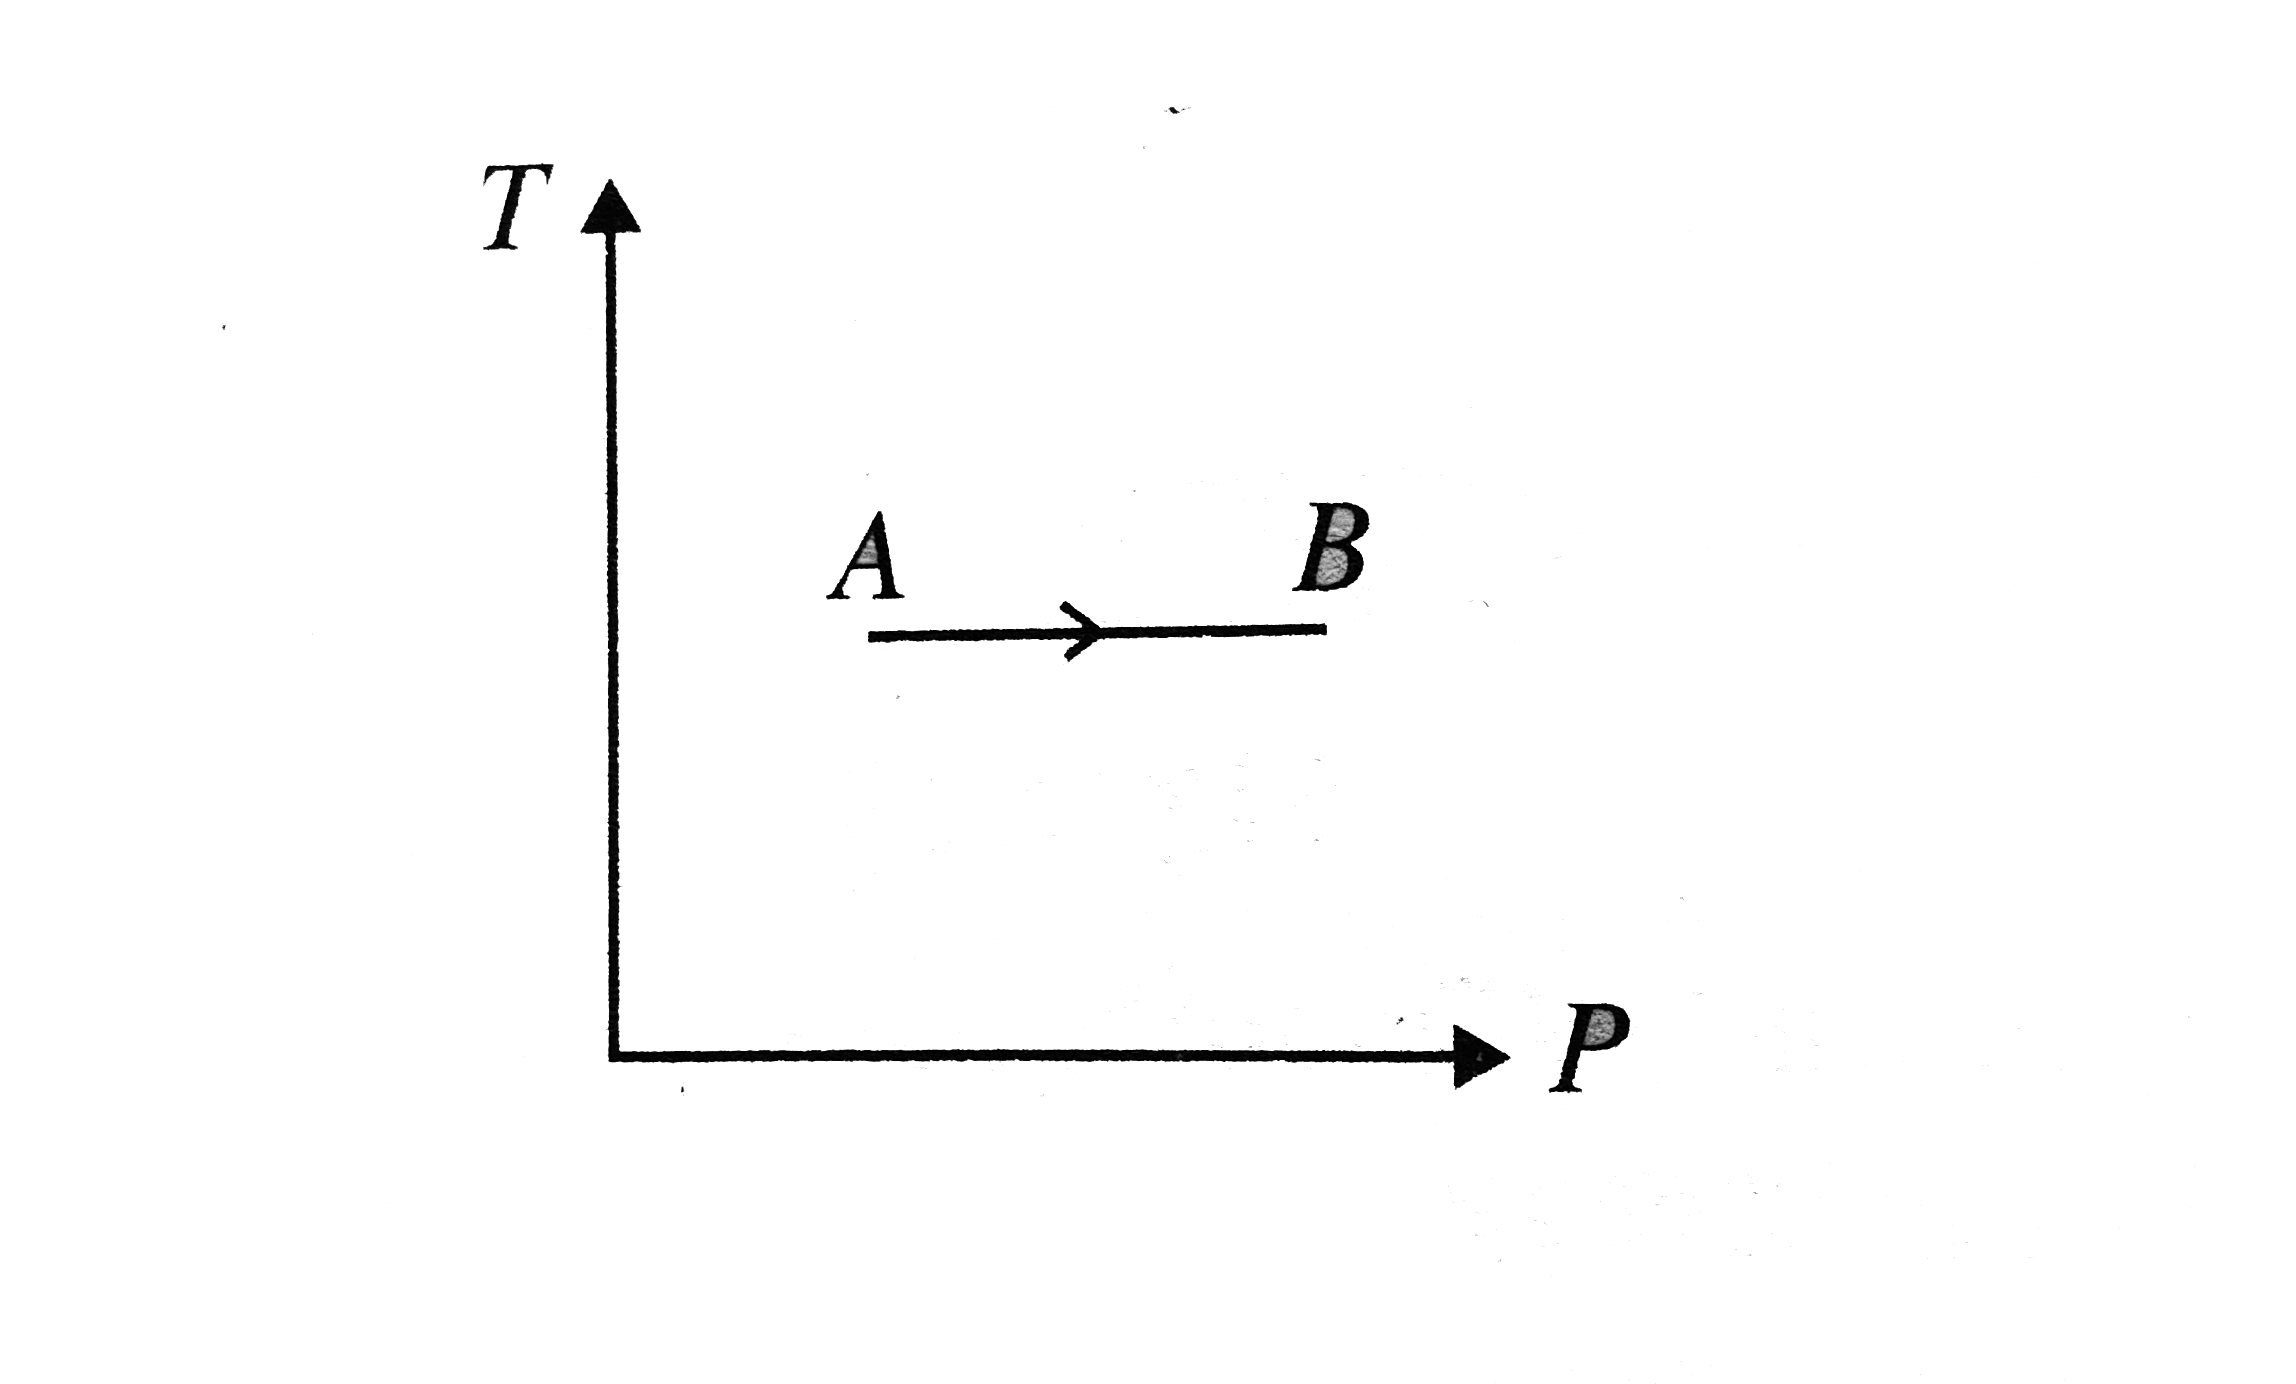 Ainternal energy of the gas remains constantBvolume of the gas is increasedCwork done by the atmosphere on the gas is positiveDpressure is inversely proportional to volume
During the process AB of an ideal gas
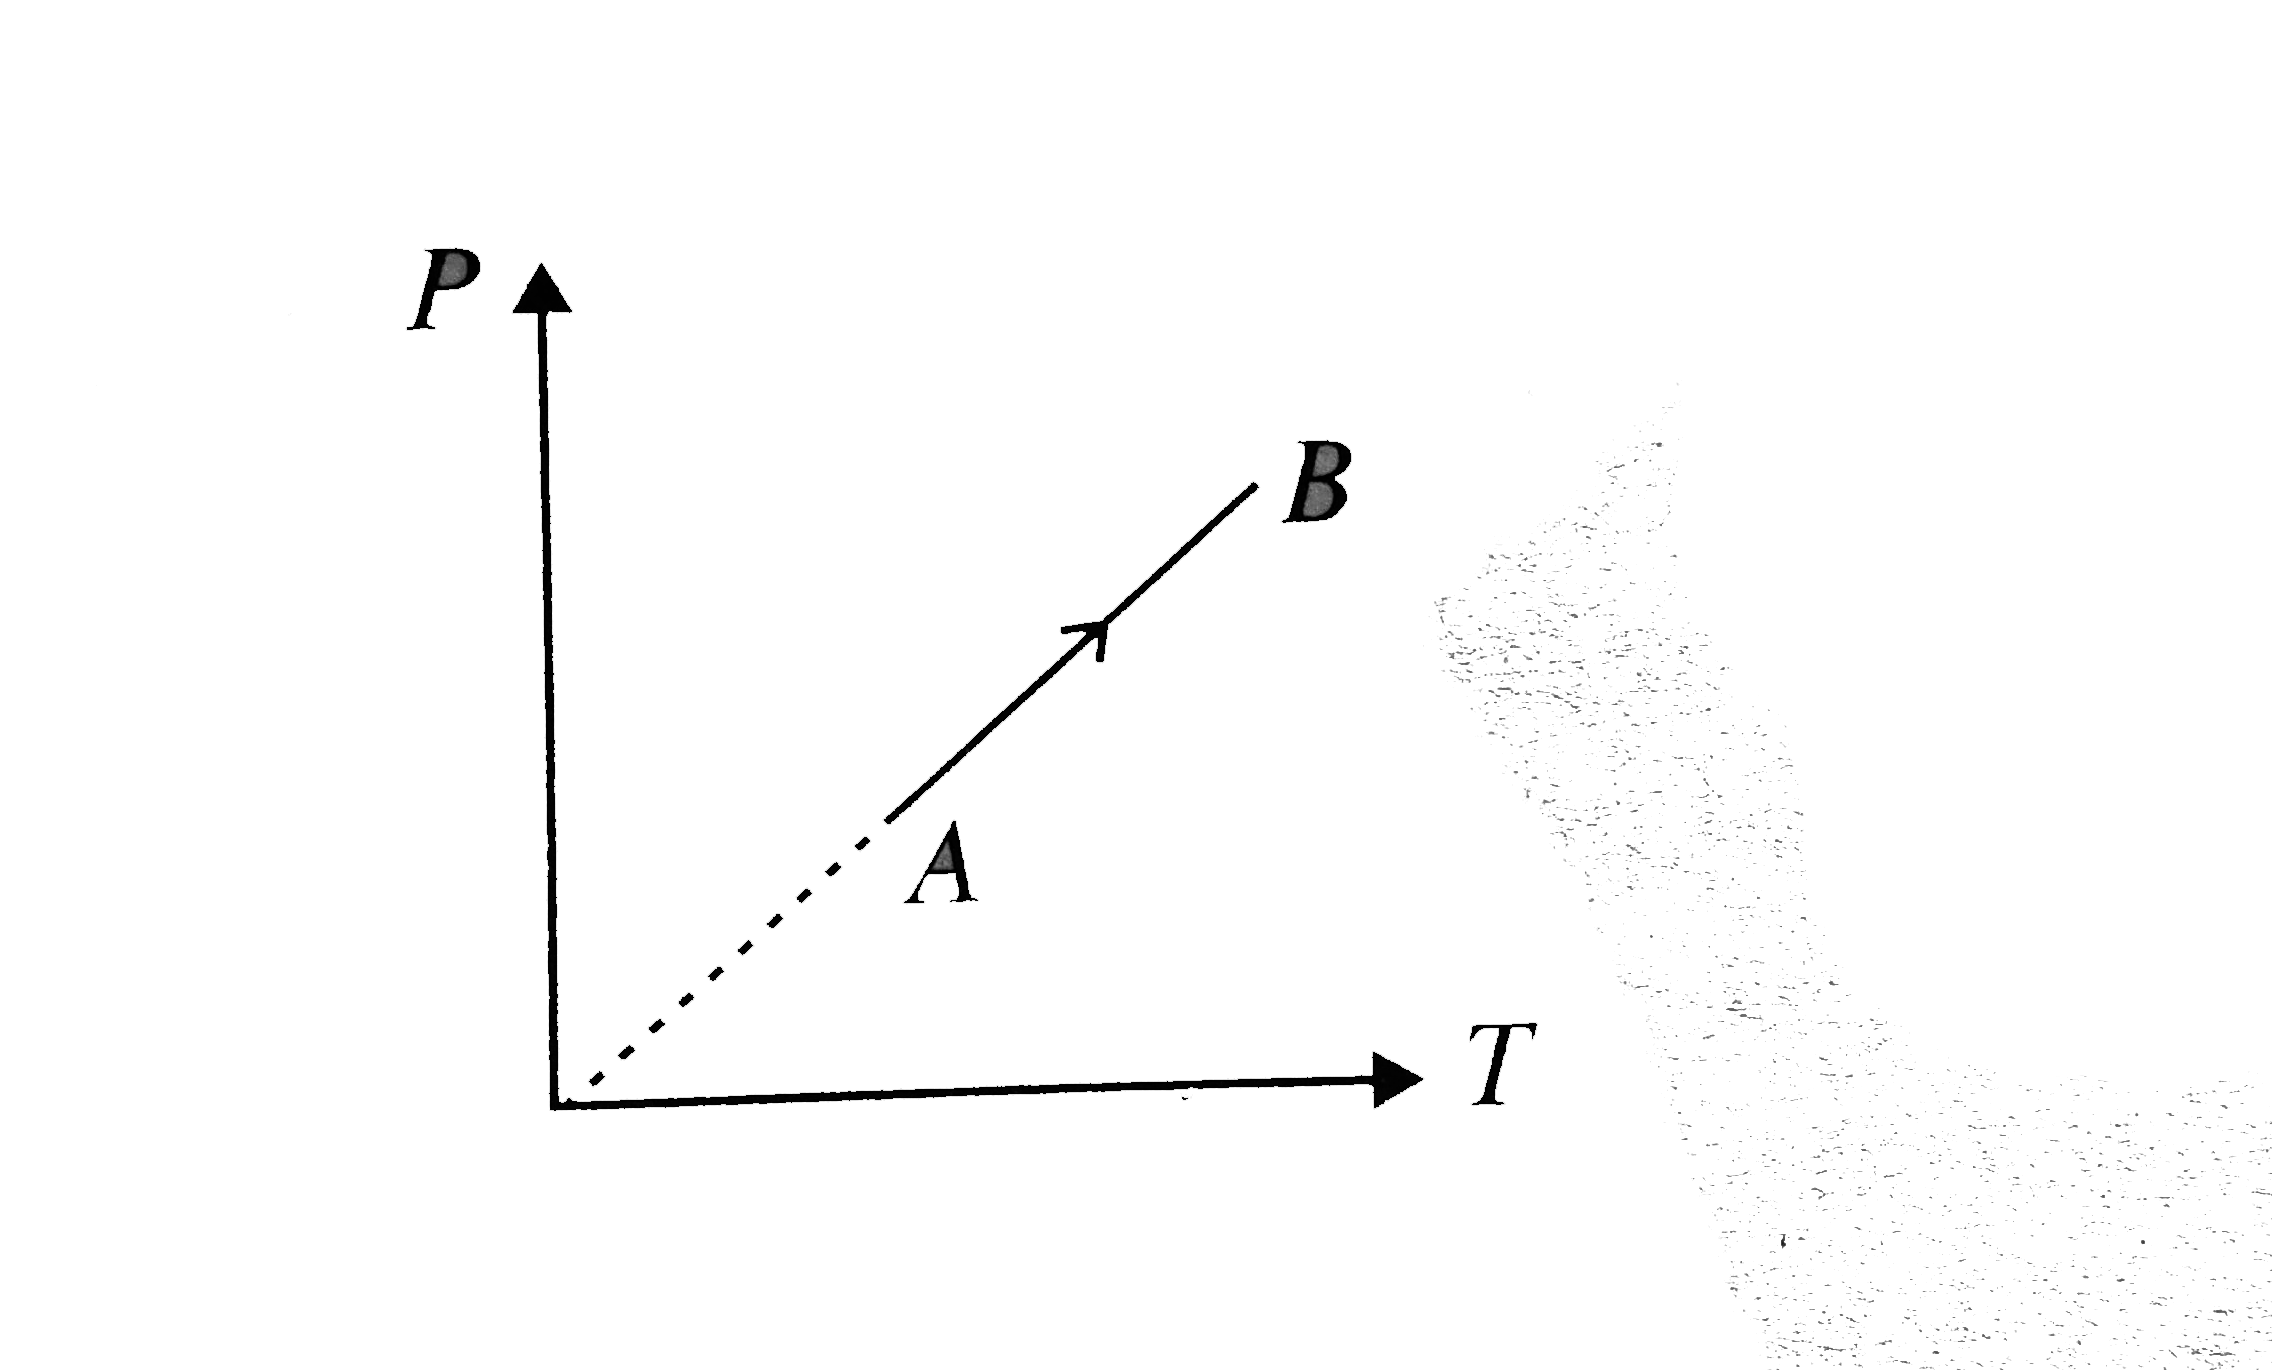 Awork done on the gas is zeroBdensity of the gas is constantCslope of line AB from the T-axis is inversely proportional to the number of moles of the gasDslope of line AB from the T-axis is directly proportional to the number of moles of the gas
The process on an ideal gas, shown in figure,is <br><imga≤ocr_imageload∈g=lazysrc=https://d10lpgp6xz60nq.cloudfront.net/physics_imagesHCV_VOL2_C24_E01_027_Q01.pngwh=80%mx-autosty≤=background:white;>
A(a)isothermalB(b)isobaricC(c)isochoricD(d)none of these.
V-T graph of a process of monoatomic ideal gas is shown in figure.
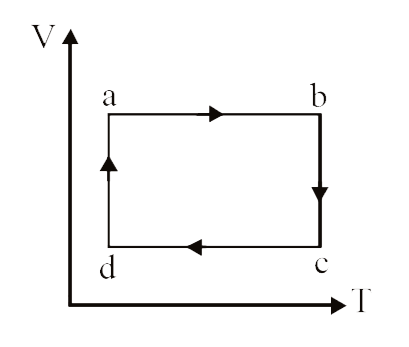
Sum of work done by the gas in process abod is-
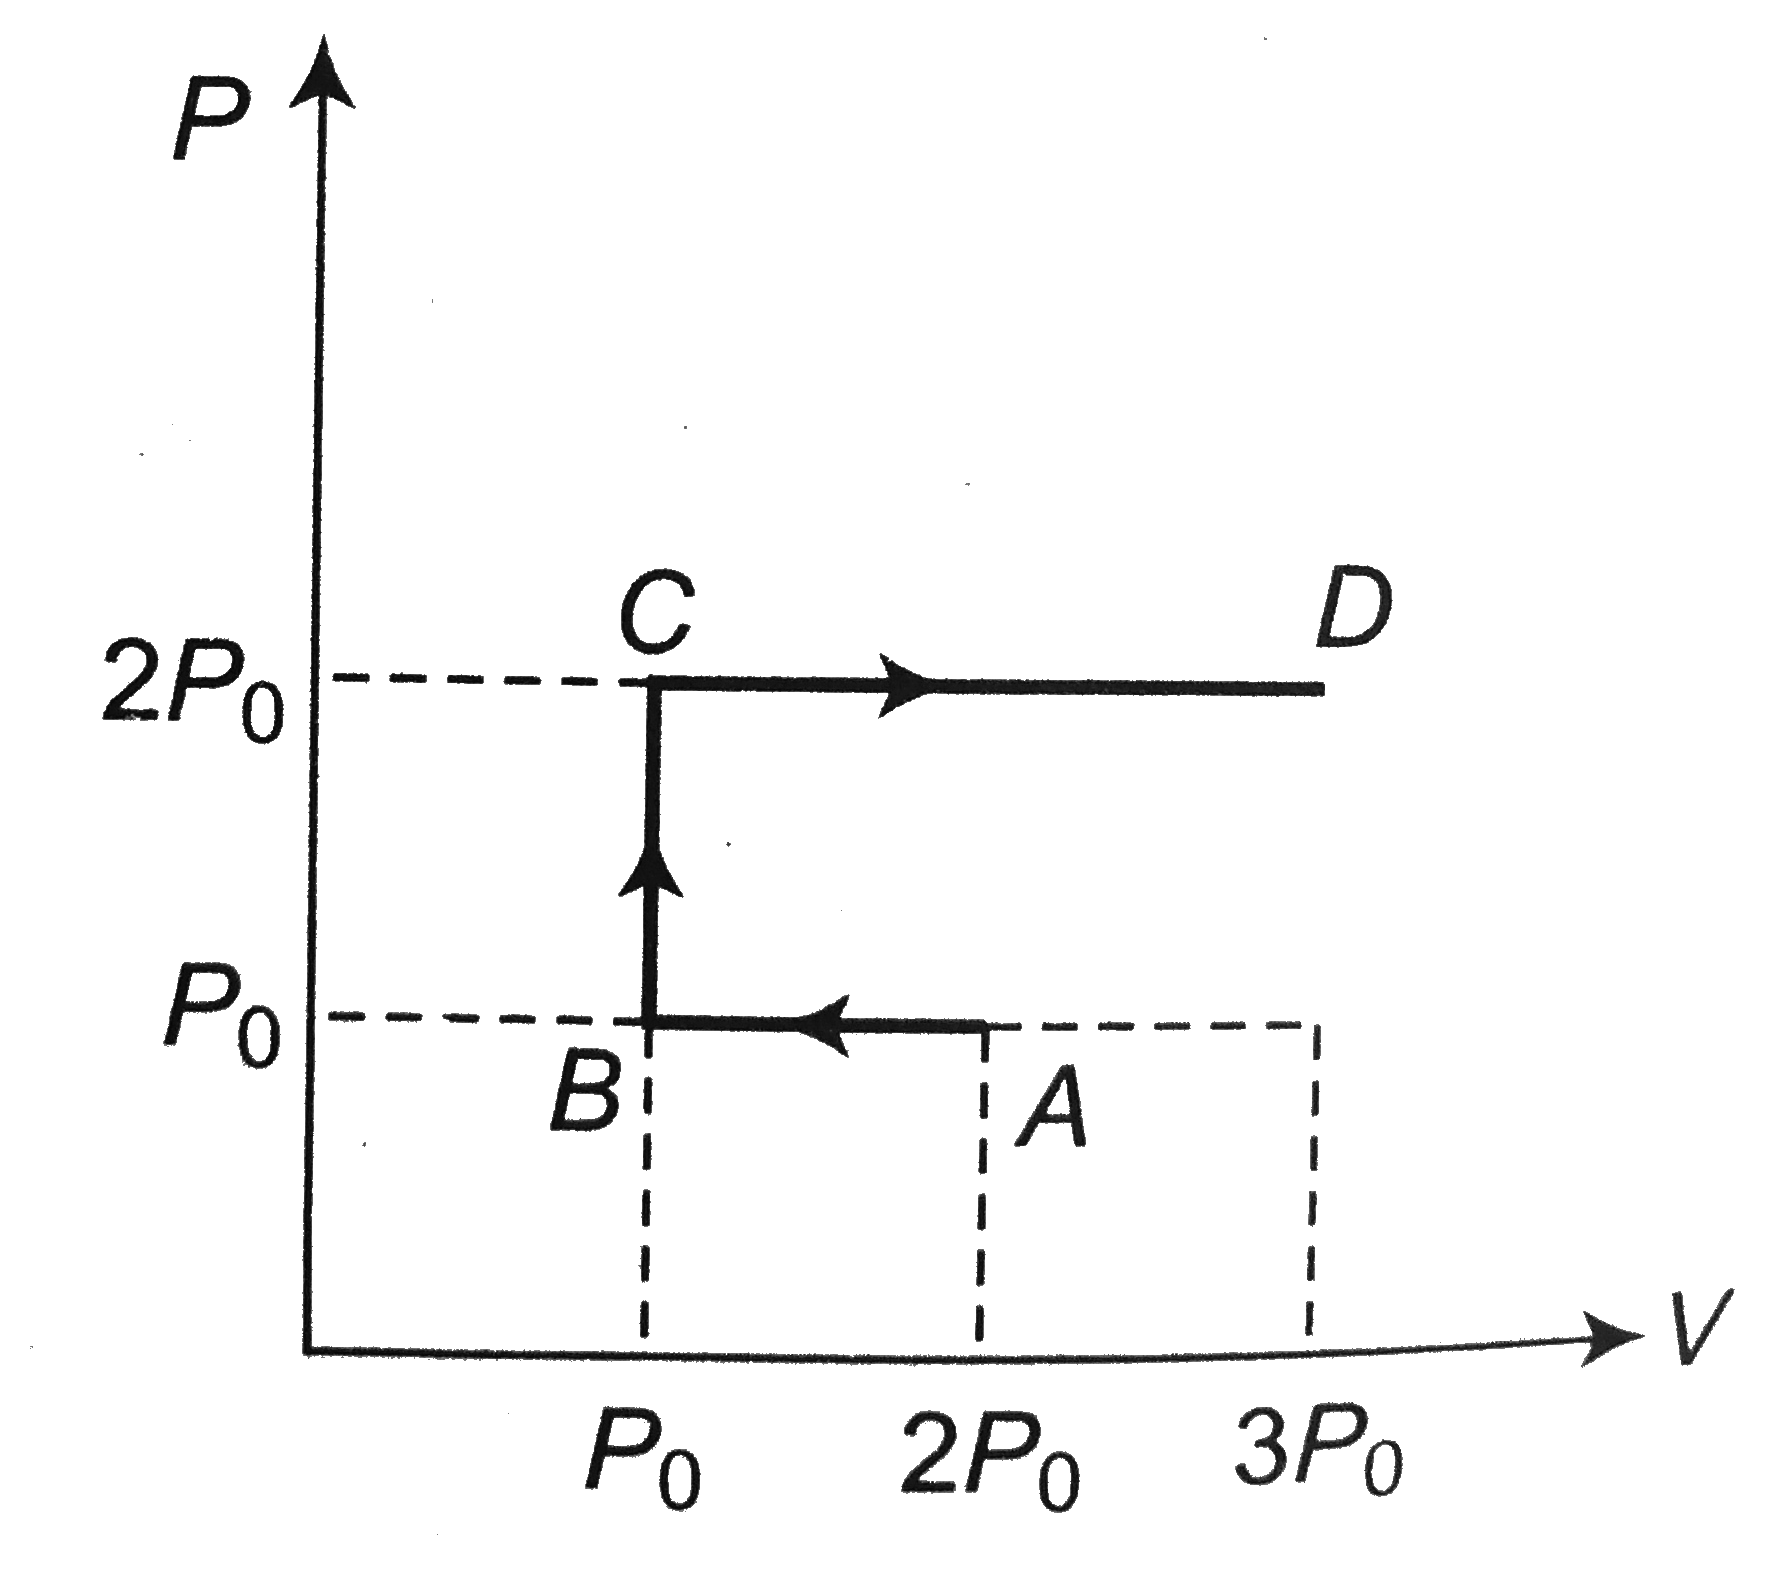
View SolutionP-V diagram of an ideal gas is as shown in figure. Work done by the gas in the process ABCD is
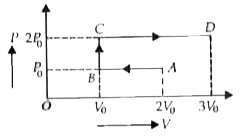
View SolutionP−V diagram of an ideal gas is as shown in figure. Work done by the gas in process ABCD is
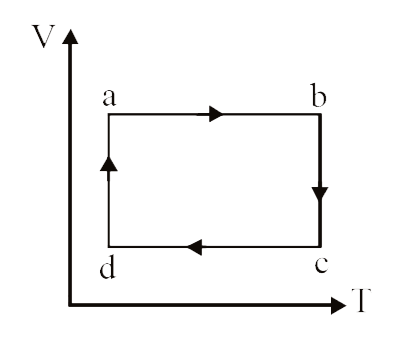
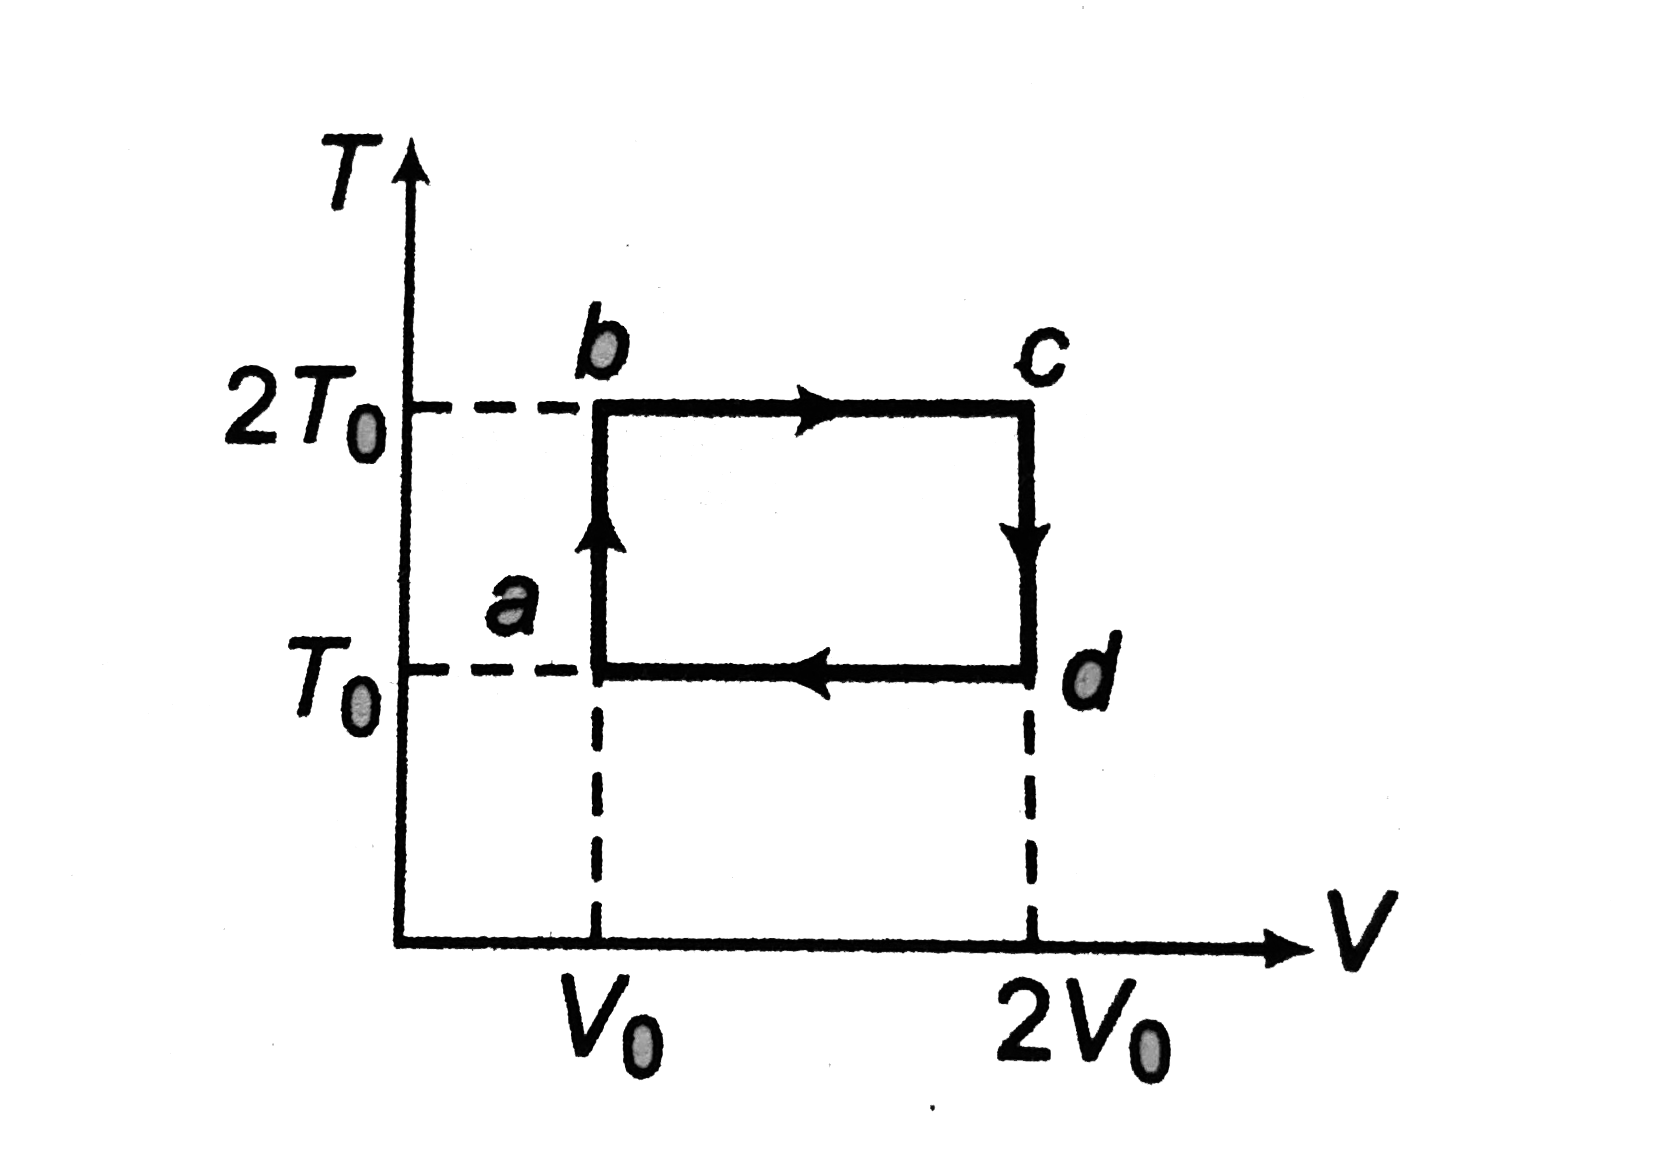
View SolutionT-V diagram of two moles of a monoatomic gas is as shown in figure.
For the process abcda choose the correct options given below
View SolutionIn figure, P−V curve of an ideal gas is given. During the process, the cumulative work done by the gas

View Solution

