Graph of Logarithmic function when 0<base<1
Step by step video & image solution for Graph of Logarithmic function when 0lt base lt1 by Maths experts to help you in doubts & scoring excellent marks in Class 11 exams.
Updated on:21/07/2023Similar Questions
Knowledge Check
Statement -1: 0<x<y⇒logax>logay,where0<a<1
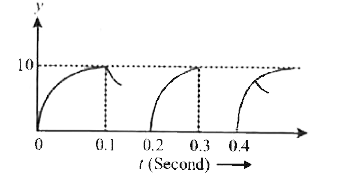
Statement-2: logax is a decreasing function when 0<a<1.AStatement-1 is True, Statement-2 is true, Statement-2 is a correct explanation for Statement-1.BStatement-1 is True, Statement-2 is true, Statement-2 is NOT a correct explanation for Statement-1.CStatement-1 is True, Statement-2 is False.DStatement-1 is False, Statement-2 is True.The rms value of the function shown in figure if it its given that for 0<t<0.1,y=10(1−e−100t and for
0.1<t<0.2,y=10e−50(t−0.1) is
 A6.2B5.3C4.1D6.9
Graph of Exponential function for 0<base<1
View SolutionLogarithmic function and graph ( Case 1- base >1 and Case 2- base < 1)
View SolutionDraw the graphs of the logaritmic functhmic functions.
(i) logax,whena>1 (ii) logax, when 0<a<1
View SolutionDraw the graph of the function and discuss the continuity and differentiability at x = 1 for, f(x)={3x,when−1≤x≤14−x,when1<x<4
View SolutionSolve the inequation : 0<x3<1
View SolutionGiven f(x) is a periodic function with period 2 and it is defined as
f(x)=⎧⎨⎩[cosπx2]+1,0<x<12−x,1≤x<2
Here [⋅] represents the greatest integer ≤x. If f(0)=1, then draw the graph of the function for x∈[−2,2].
View Solution
