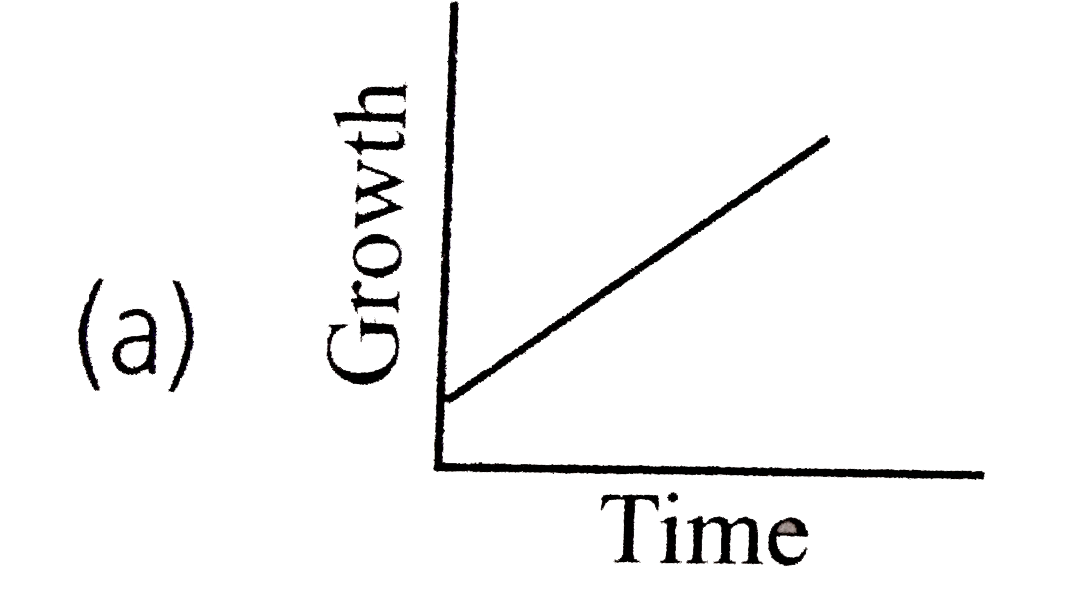
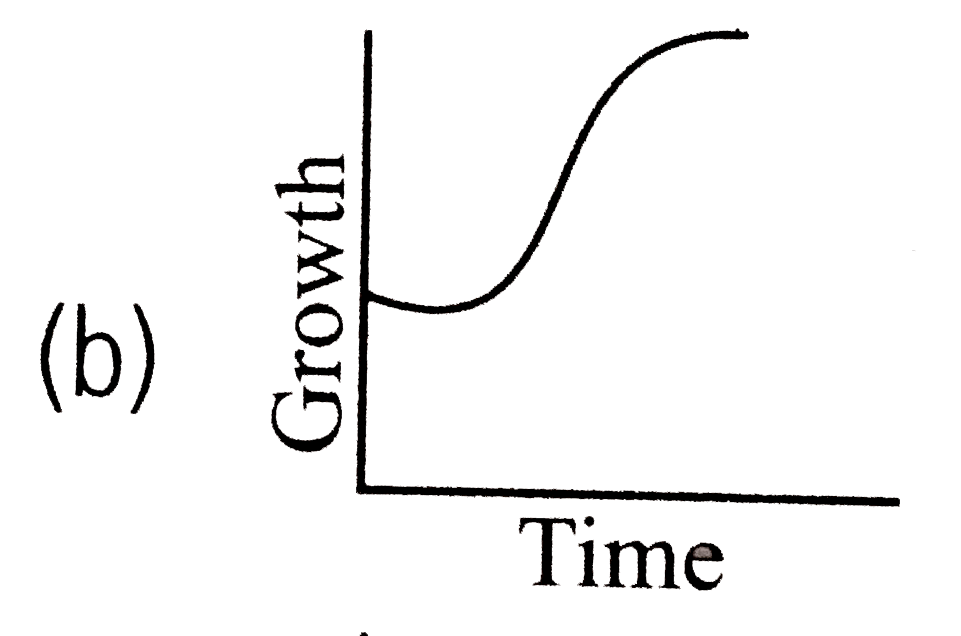
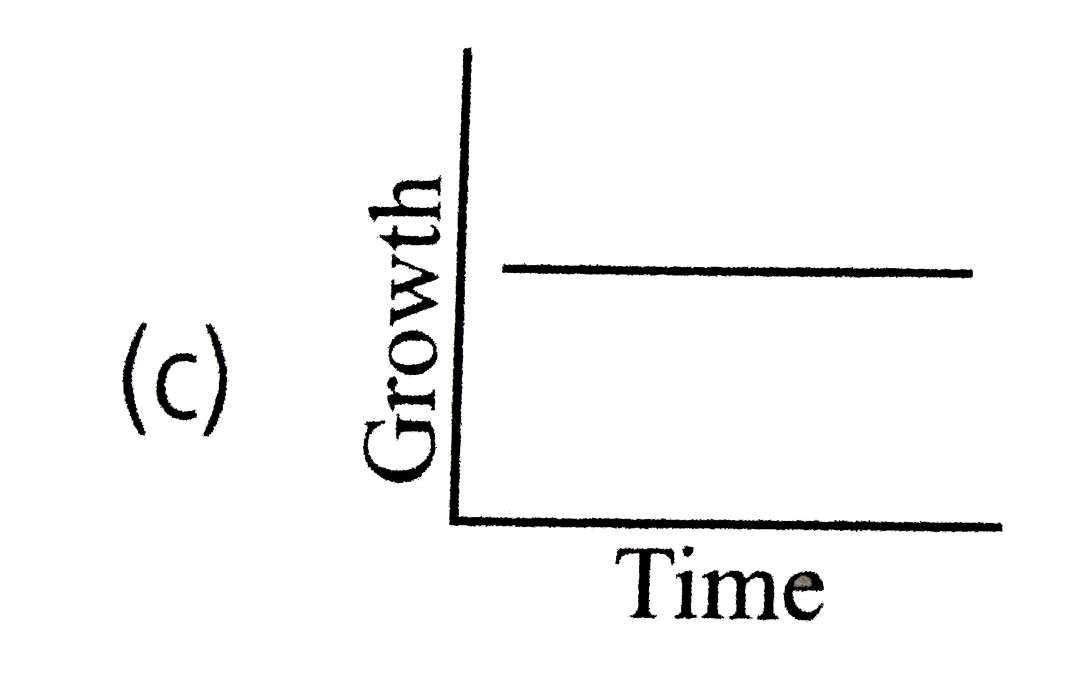
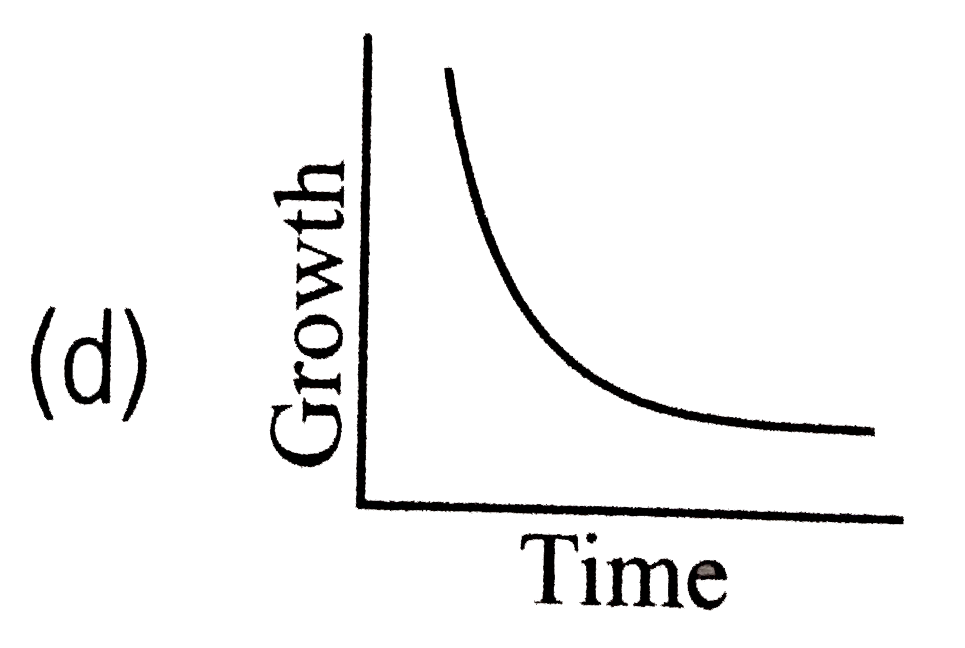
Which one is the correct graph for arithmetic growth?
The correct Answer is:A
To determine the correct graph for arithmetic growth, we can follow these steps:
1. Understand Arithmetic Growth:
- Arithmetic growth refers to a type of growth where a fixed amount is added at regular intervals. In biological terms, this often involves cell division where one cell divides to produce two cells, but only one continues to divide while the other differentiates.
2. Identify Characteristics of Arithmetic Growth:
- In arithmetic growth, the increase is constant over time. This means that if you were to plot this growth on a graph, the increase in size or number of cells would be uniform.
3. Graph Representation:
- The graph of arithmetic growth is represented as a straight line. This is because the growth occurs at a constant rate, leading to a linear increase over time.
4. Analyze Given Options:
- Option A: A linear curve (correct for arithmetic growth).
- Option B: A sigmoid curve (indicative of exponential growth).
- Option C: A constant line (indicating no growth).
- Option D: A decreasing line (indicating negative growth).
5. Select the Correct Option:
- Based on the analysis, the correct graph for arithmetic growth is represented by Option A, which shows a linear increase.
Final Answer:
The correct graph for arithmetic growth is Option A, which is a linear curve.
---
- Arithmetic growth refers to a type of growth where a fixed amount is added at regular intervals. In biological terms, this often involves cell division where one cell divides to produce two cells, but only one continues to divide while the other differentiates.
- In arithmetic growth, the increase is constant over time. This means that if you were to plot this growth on a graph, the increase in size or number of cells would be uniform.
- The graph of arithmetic growth is represented as a straight line. This is because the growth occurs at a constant rate, leading to a linear increase over time.
- Option A: A linear curve (correct for arithmetic growth).
- Option B: A sigmoid curve (indicative of exponential growth).
- Option C: A constant line (indicating no growth).
- Option D: A decreasing line (indicating negative growth).
- Based on the analysis, the correct graph for arithmetic growth is represented by Option A, which shows a linear increase.
The correct graph for arithmetic growth is Option A, which is a linear curve.
Topper's Solved these Questions
Similar Questions
Knowledge Check
- Question 1 - Select One or More
Which one is the correct graph (fig.) for the corresponding acid base titration?
A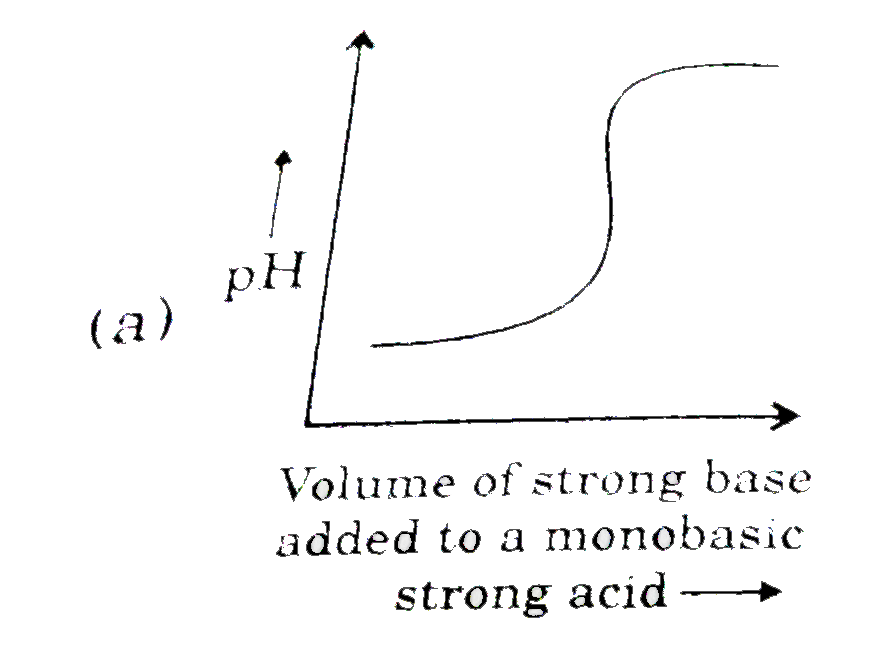 B
B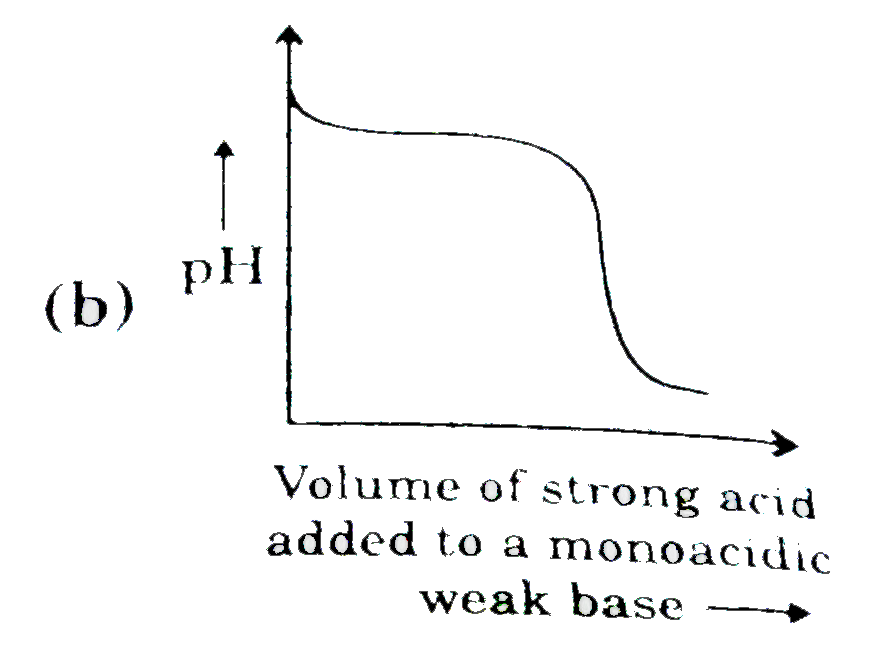 C
C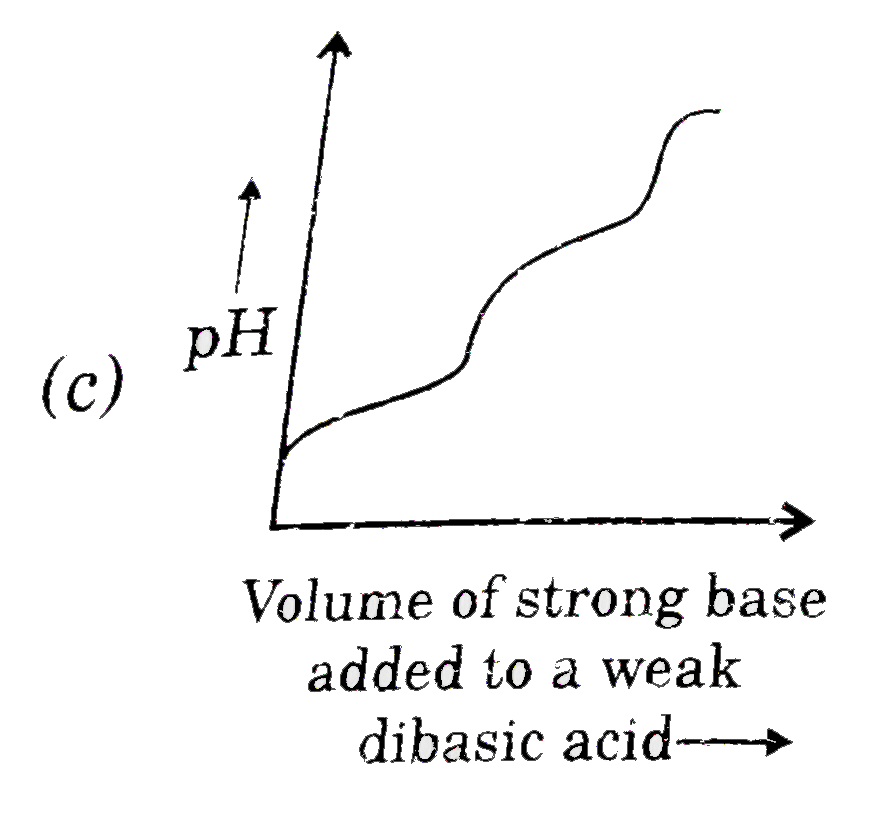 D
D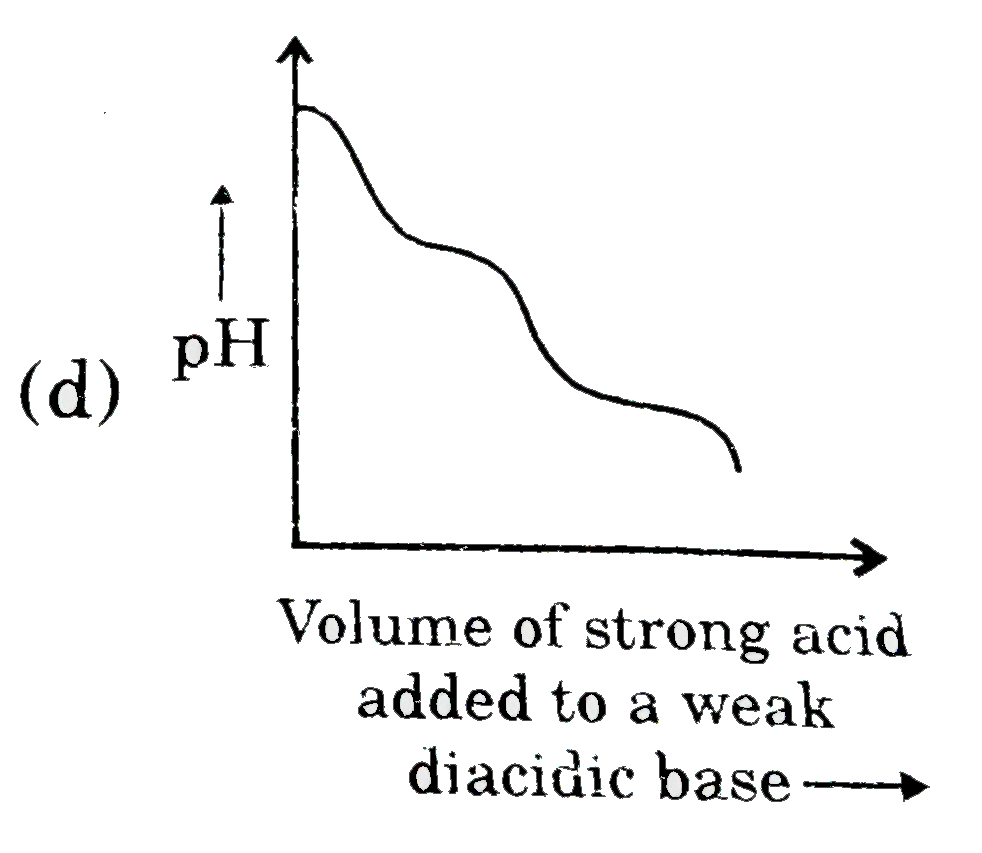
- Question 2 - Select One
Which is correct graph :
A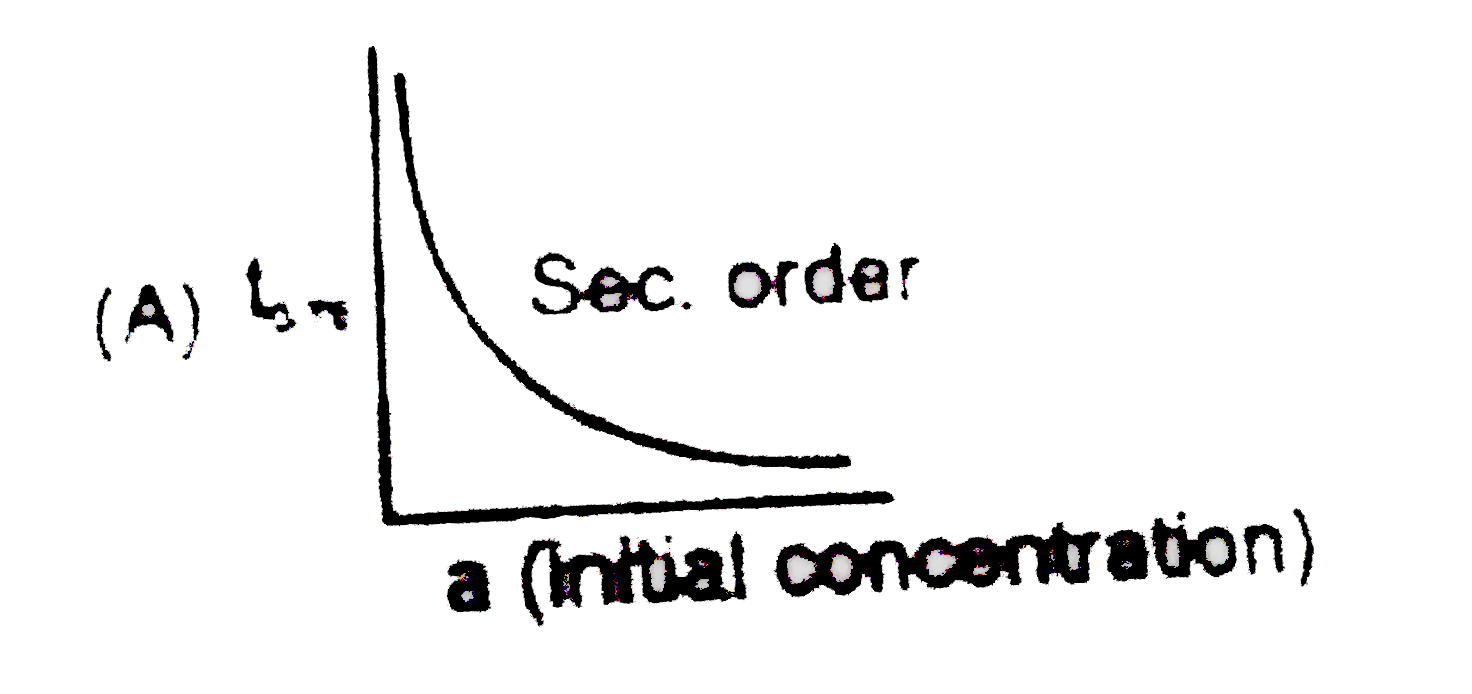 B
B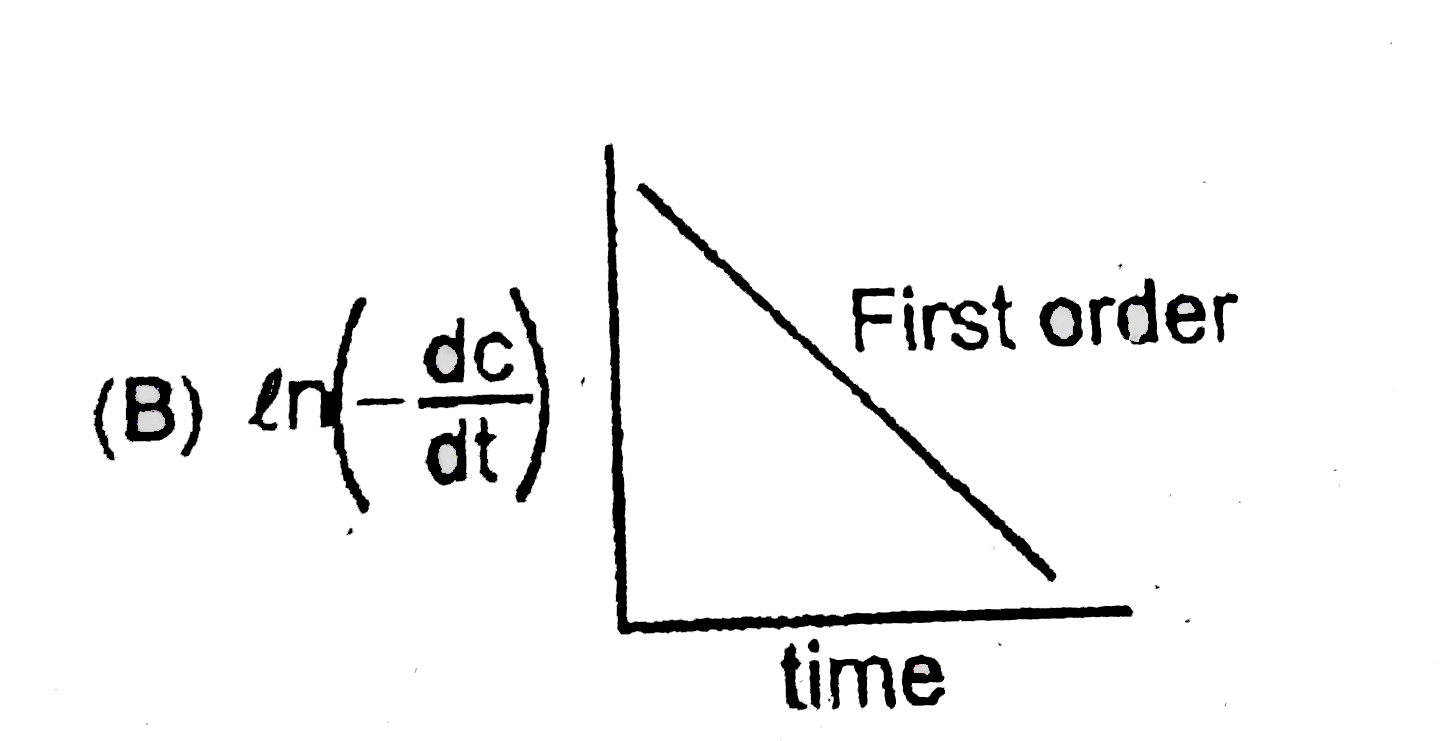 C
C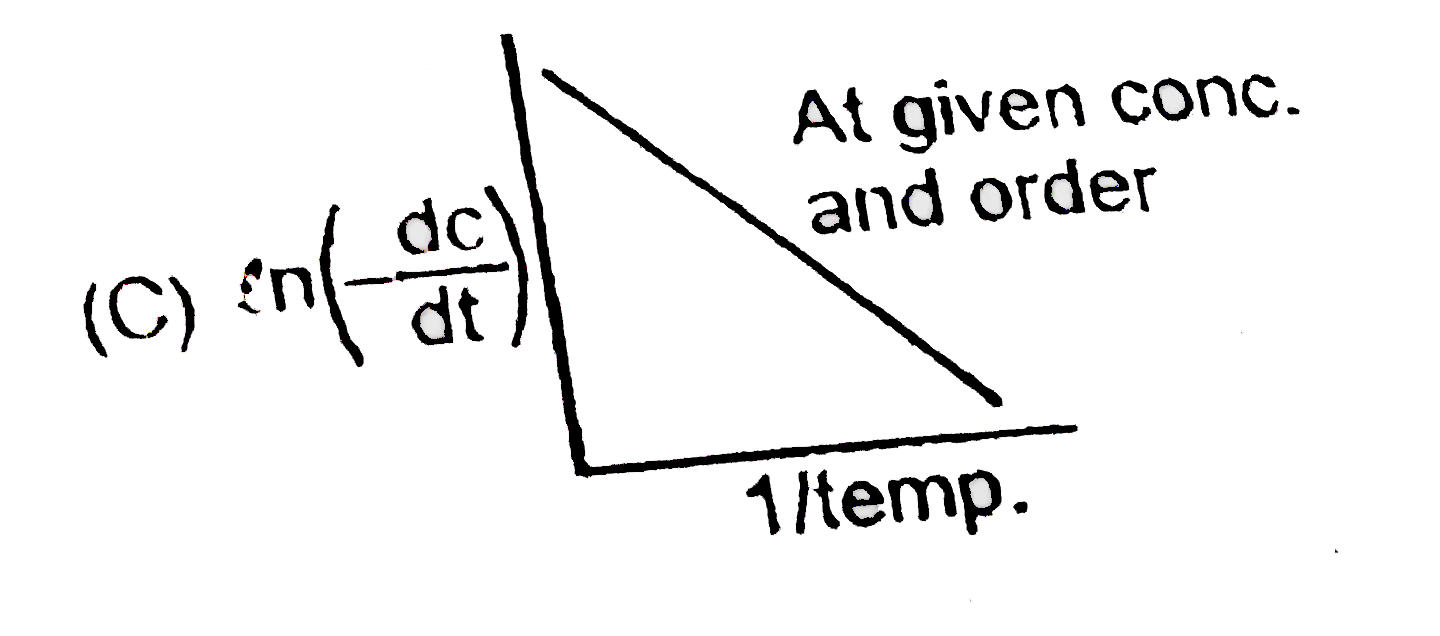 D
D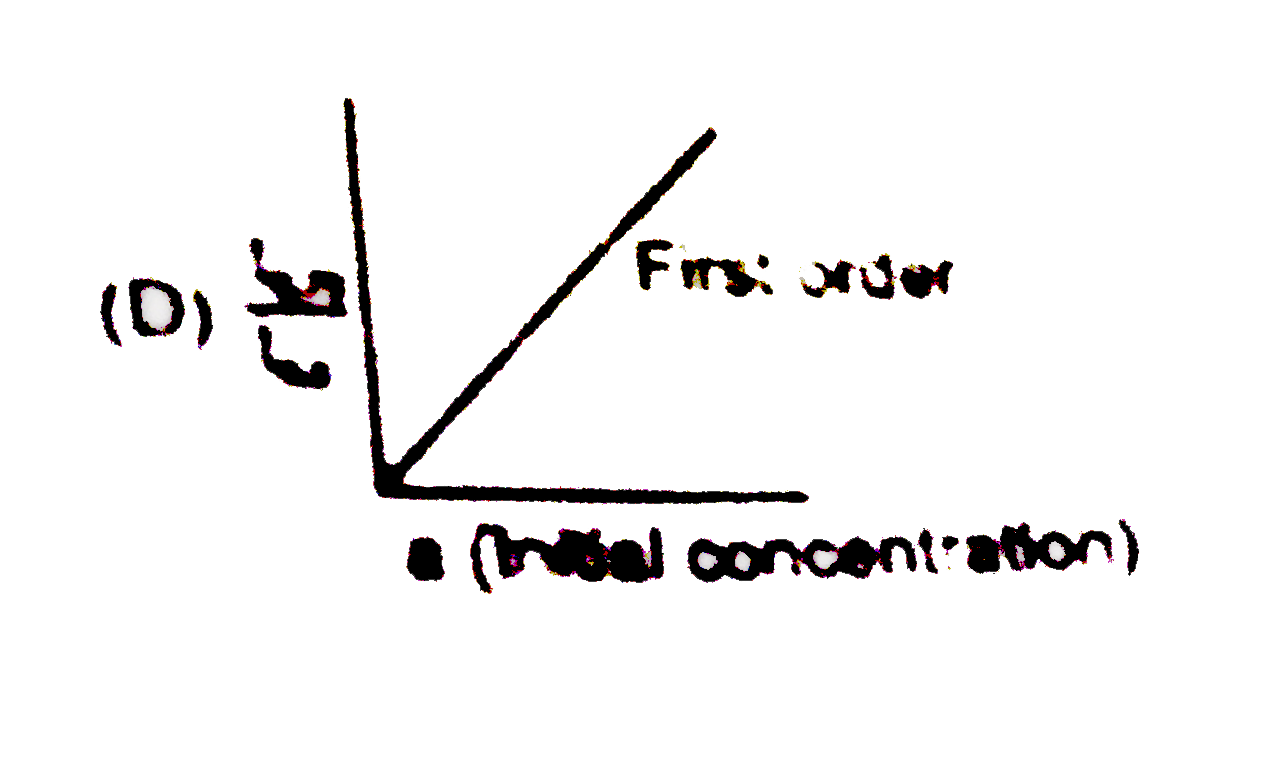
- Question 3 - Select One
Arithmetic growth means
Aout of two cells formed in each mitotic division only one cell continues to divide.Bout of two cells formed from one cell, two cells show continuous division.Cnone of the cells divide and add new cells.Dout of two cells formed both lose dividing ability.
The displacement-time graph of a particle executing simple harmonic motion is shown in the figure
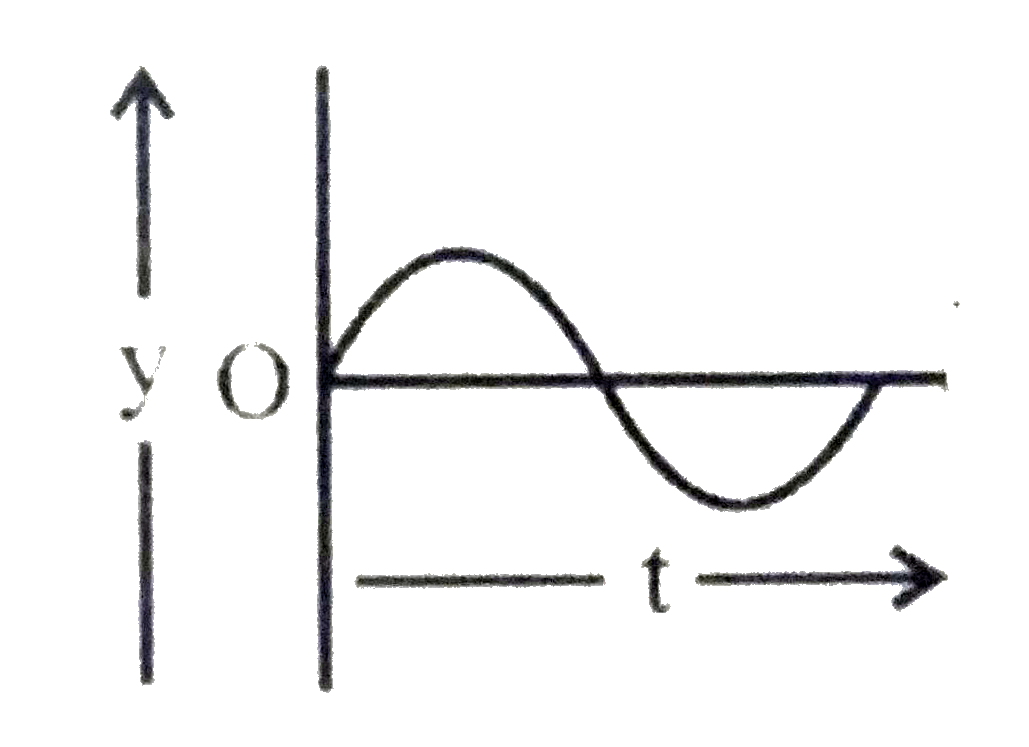
Which one of the following graphs is the correct forcetime graph for the motion of the particle ?View SolutionWhich one is the correct graph which gives the variation of magnetic susceptibility (x) with tempperature for a diamagnetic substacne?
View SolutionMark the correct statement/s about arithmetic growth.
View SolutionWhich is correct graph for photoelectric effect.
View SolutionWhich of the following is correct graph for the reaction?
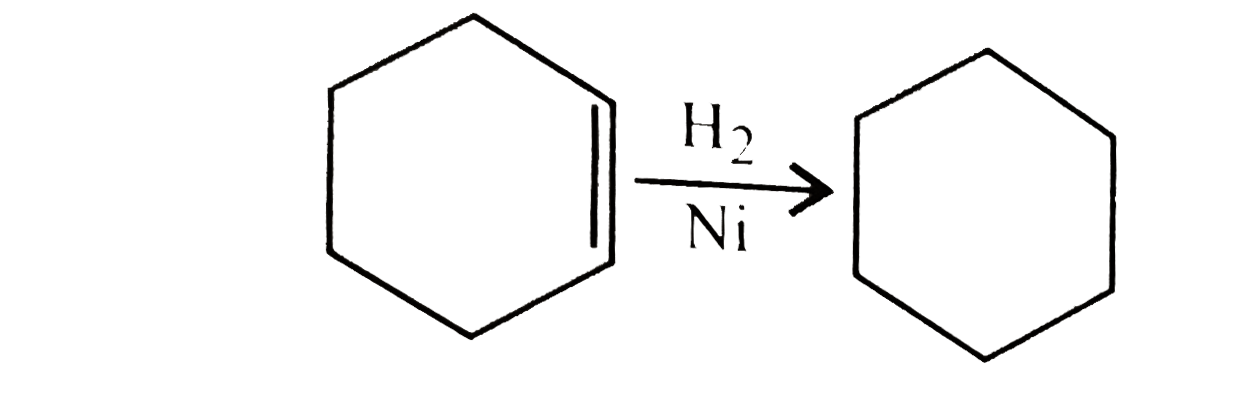 View Solution

