Which is correct graph for photoelectric effect.


The correct Answer is:B, C
To determine the correct graph for the photoelectric effect, we need to analyze the relationship between the kinetic energy of photoelectrons and the frequency of incident light, as well as the intensity of light.
1. Understanding the Photoelectric Effect:
The photoelectric effect describes how electrons are emitted from a material when it is exposed to light of sufficient frequency. The energy of the incoming photons is given by the equation:
E=hν
where E is the energy of the photon, h is Planck's constant, and ν is the frequency of the light.
2. Kinetic Energy Equation:
The kinetic energy (KEmax) of the emitted photoelectrons can be expressed as:
KEmax=hν−ϕ
where ϕ is the work function of the material. Rearranging gives:
KEmax=hν−ϕ
3. Graphing the Relationship:
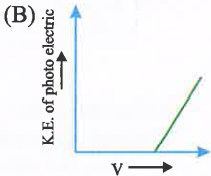
If we plot the kinetic energy of the photoelectrons (KEmax) on the y-axis and the frequency (ν) on the x-axis, the equation resembles the linear equation of a straight line:
y=mx−c
Here, m (the slope) is equal to h and c (the y-intercept) is equal to −ϕ.
4. Analyzing Graph Options:
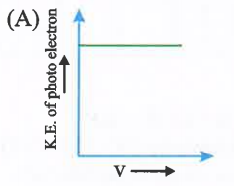
- First Graph: This graph shows kinetic energy remaining constant regardless of frequency. This is incorrect because kinetic energy should increase with frequency.
- Second Graph: This graph shows a straight line with a positive slope and a negative y-intercept. This is correct as it represents the relationship KEmax=hν−ϕ.
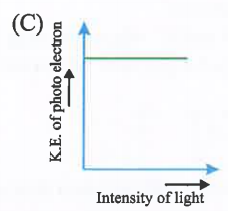
- Third Graph: This graph shows kinetic energy plotted against light intensity. Since intensity affects the number of emitted electrons but not their kinetic energy, this graph is also correct in the context of showing that kinetic energy remains constant regardless of intensity.
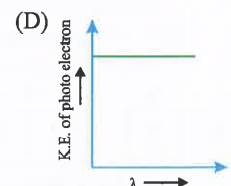
- Fourth Graph: This graph shows kinetic energy plotted against wavelength (λ). Since E is inversely proportional to λ, as λ increases, KEmax should decrease. This graph incorrectly shows kinetic energy as constant with increasing wavelength, which is incorrect.
5. Conclusion:
The correct graphs for the photoelectric effect are:
- Option 2: Kinetic energy vs. frequency (linear relationship).
- Option 3: Kinetic energy vs. intensity (constant kinetic energy).
The photoelectric effect describes how electrons are emitted from a material when it is exposed to light of sufficient frequency. The energy of the incoming photons is given by the equation:
E=hν
where E is the energy of the photon, h is Planck's constant, and ν is the frequency of the light.
The kinetic energy (KEmax) of the emitted photoelectrons can be expressed as:
KEmax=hν−ϕ
where ϕ is the work function of the material. Rearranging gives:
KEmax=hν−ϕ
If we plot the kinetic energy of the photoelectrons (KEmax) on the y-axis and the frequency (ν) on the x-axis, the equation resembles the linear equation of a straight line:
y=mx−c
Here, m (the slope) is equal to h and c (the y-intercept) is equal to −ϕ.
- First Graph: This graph shows kinetic energy remaining constant regardless of frequency. This is incorrect because kinetic energy should increase with frequency.
- Second Graph: This graph shows a straight line with a positive slope and a negative y-intercept. This is correct as it represents the relationship KEmax=hν−ϕ.
- Third Graph: This graph shows kinetic energy plotted against light intensity. Since intensity affects the number of emitted electrons but not their kinetic energy, this graph is also correct in the context of showing that kinetic energy remains constant regardless of intensity.
- Fourth Graph: This graph shows kinetic energy plotted against wavelength (λ). Since E is inversely proportional to λ, as λ increases, KEmax should decrease. This graph incorrectly shows kinetic energy as constant with increasing wavelength, which is incorrect.
The correct graphs for the photoelectric effect are:
- Option 2: Kinetic energy vs. frequency (linear relationship).
- Option 3: Kinetic energy vs. intensity (constant kinetic energy).
Topper's Solved these Questions
Similar Questions
Knowledge Check
In photoelectric effect
Alight energy is converted into the heat energyBlight is converted into electric energyClight energy is converted into the sound energyDelectric energy is converted into light energyIn photoelectric effect
Aphotons come out of a metal when it is hit by a beam of electronsBphotons come out of the nucleus of an atom under the action of an electric fieldCelectrons come out of a metal with a constant velocity which depends on the frequency and intensity of incident radiationDelectrons come out of a metal with different velocities nor greater than a certain value which depends only on the frequency of the incident light and not on its intensityIn photoelectric effect,
AIn photoelectric current is directly proportional to the intensity of incident light.BK.E.max of ejected electrons is dependent on intensity of radiations.Cthere is no time lag between the incidence of photons and ejection of electronsDAll of these are correct.
In photoelectric effect,
View SolutionWhich of the following statement is/are correct for photoelectric effect
View SolutionSelect correct statement(s) about photoelectric effect.
View SolutionWhich of the following statements is/are true in the correct of photoelectric effect?
View SolutionWhich is the graph with respect to photoelectric effect?
View Solution
