The I-V curve for a photocell is best represented by the figure.


The correct Answer is:C
Topper's Solved these Questions
- ELECTRONS AND PHOTONSBOOK - TARGET PUBLICATIONCHAPTER - ELECTRONS AND PHOTONSEXERCISE - Competitive Thinking
78 Videos
- ELECTRONS AND PHOTONSBOOK - TARGET PUBLICATIONCHAPTER - ELECTRONS AND PHOTONSEXERCISE - Evaluation Test
19 Videos
- ELECTRONS AND PHOTONSBOOK - TARGET PUBLICATIONCHAPTER - ELECTRONS AND PHOTONSEXERCISE - Evaluation Test
19 Videos
- COMMUNICATION SYSTEMSBOOK - TARGET PUBLICATIONCHAPTER - COMMUNICATION SYSTEMSEXERCISE - Evaluation Test
15 Videos
- FORCE BOOK - TARGET PUBLICATIONCHAPTER - FORCE EXERCISE - Evaluation Test
16 Videos
Similar Questions
The curves A and B in the figure shown P-V graphs for an isothermal and an adiabatic process for an idea gas. The isothermal process is represented by the curve A.
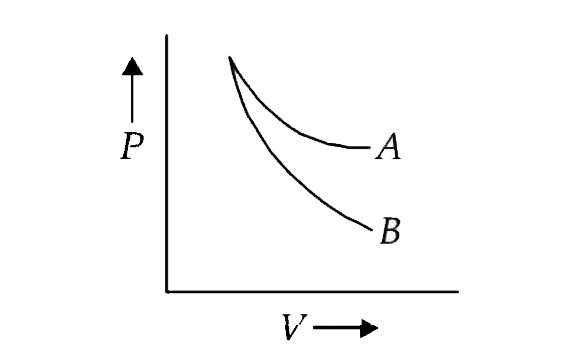
View SolutionThe curves A and B in the figure shown P-V graphs for an isothermal and an adiabatic process for an idea gas. The isothermal process is represented by the curve A.

View Solution
Knowledge Check
The dependence of the short wavelength limit λmin on the accelerating potential V is represented by the curve of figure
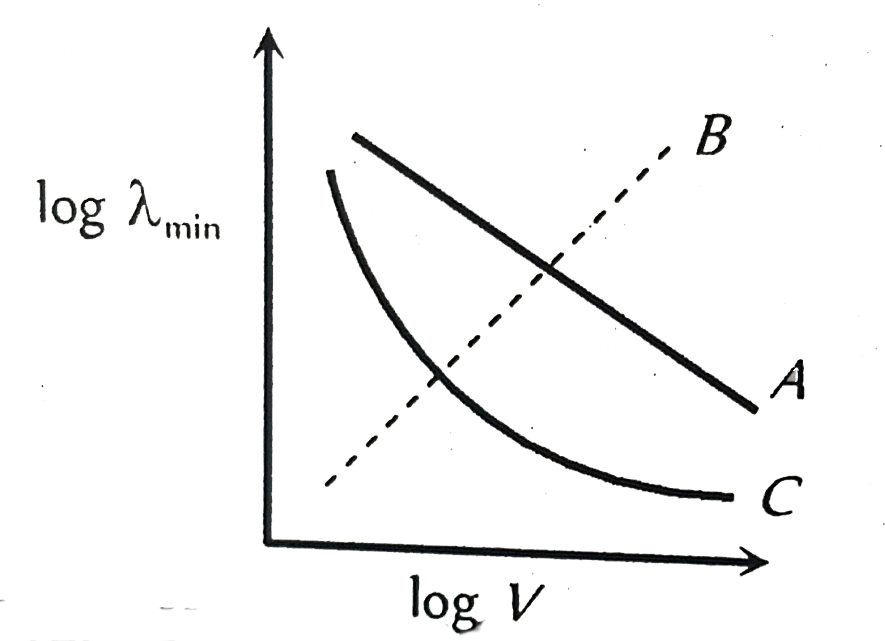 AABBCCDNone of these
The given figure best represents
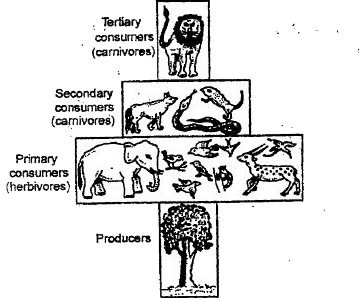 APyramid of number in parasitic food chainBPyramid of biomass in forest ecosystemCPyramid of number in grassland ecosystemDPyramid of number in forest ecosystem
Draw and explain the current -voltage (I-V) characteristic curves of a junction diode in forward and reverse bias.
A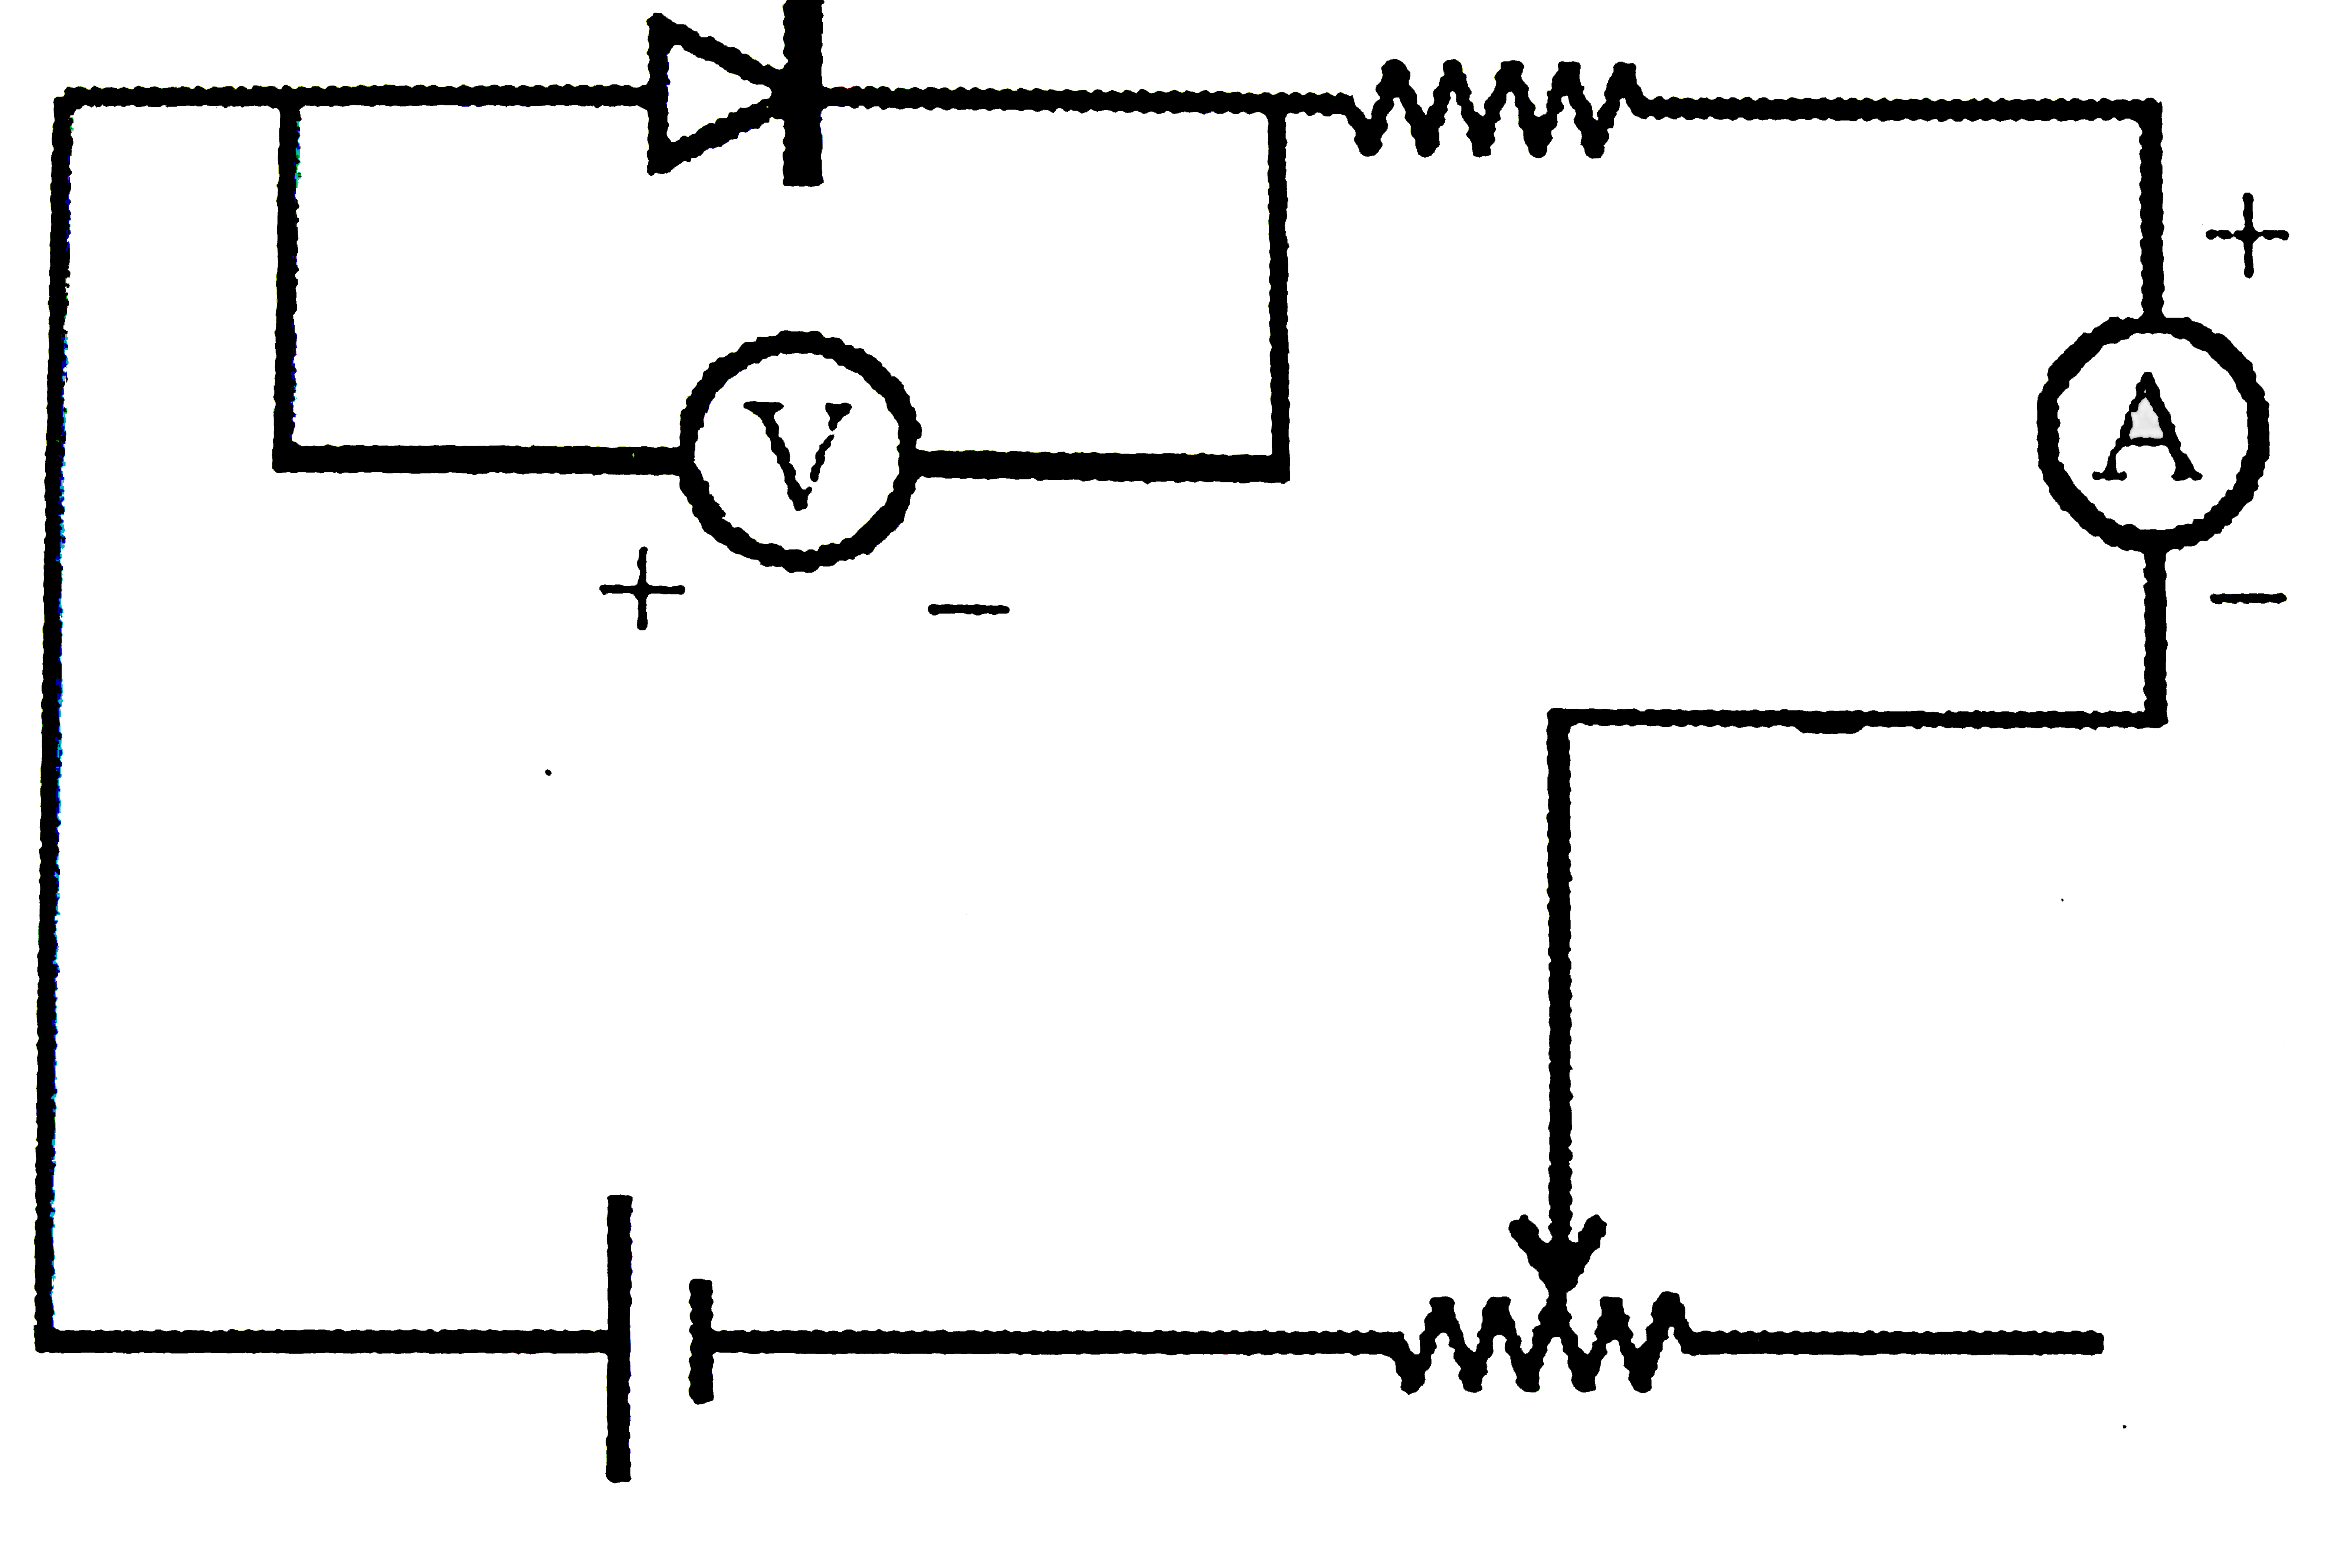 B
B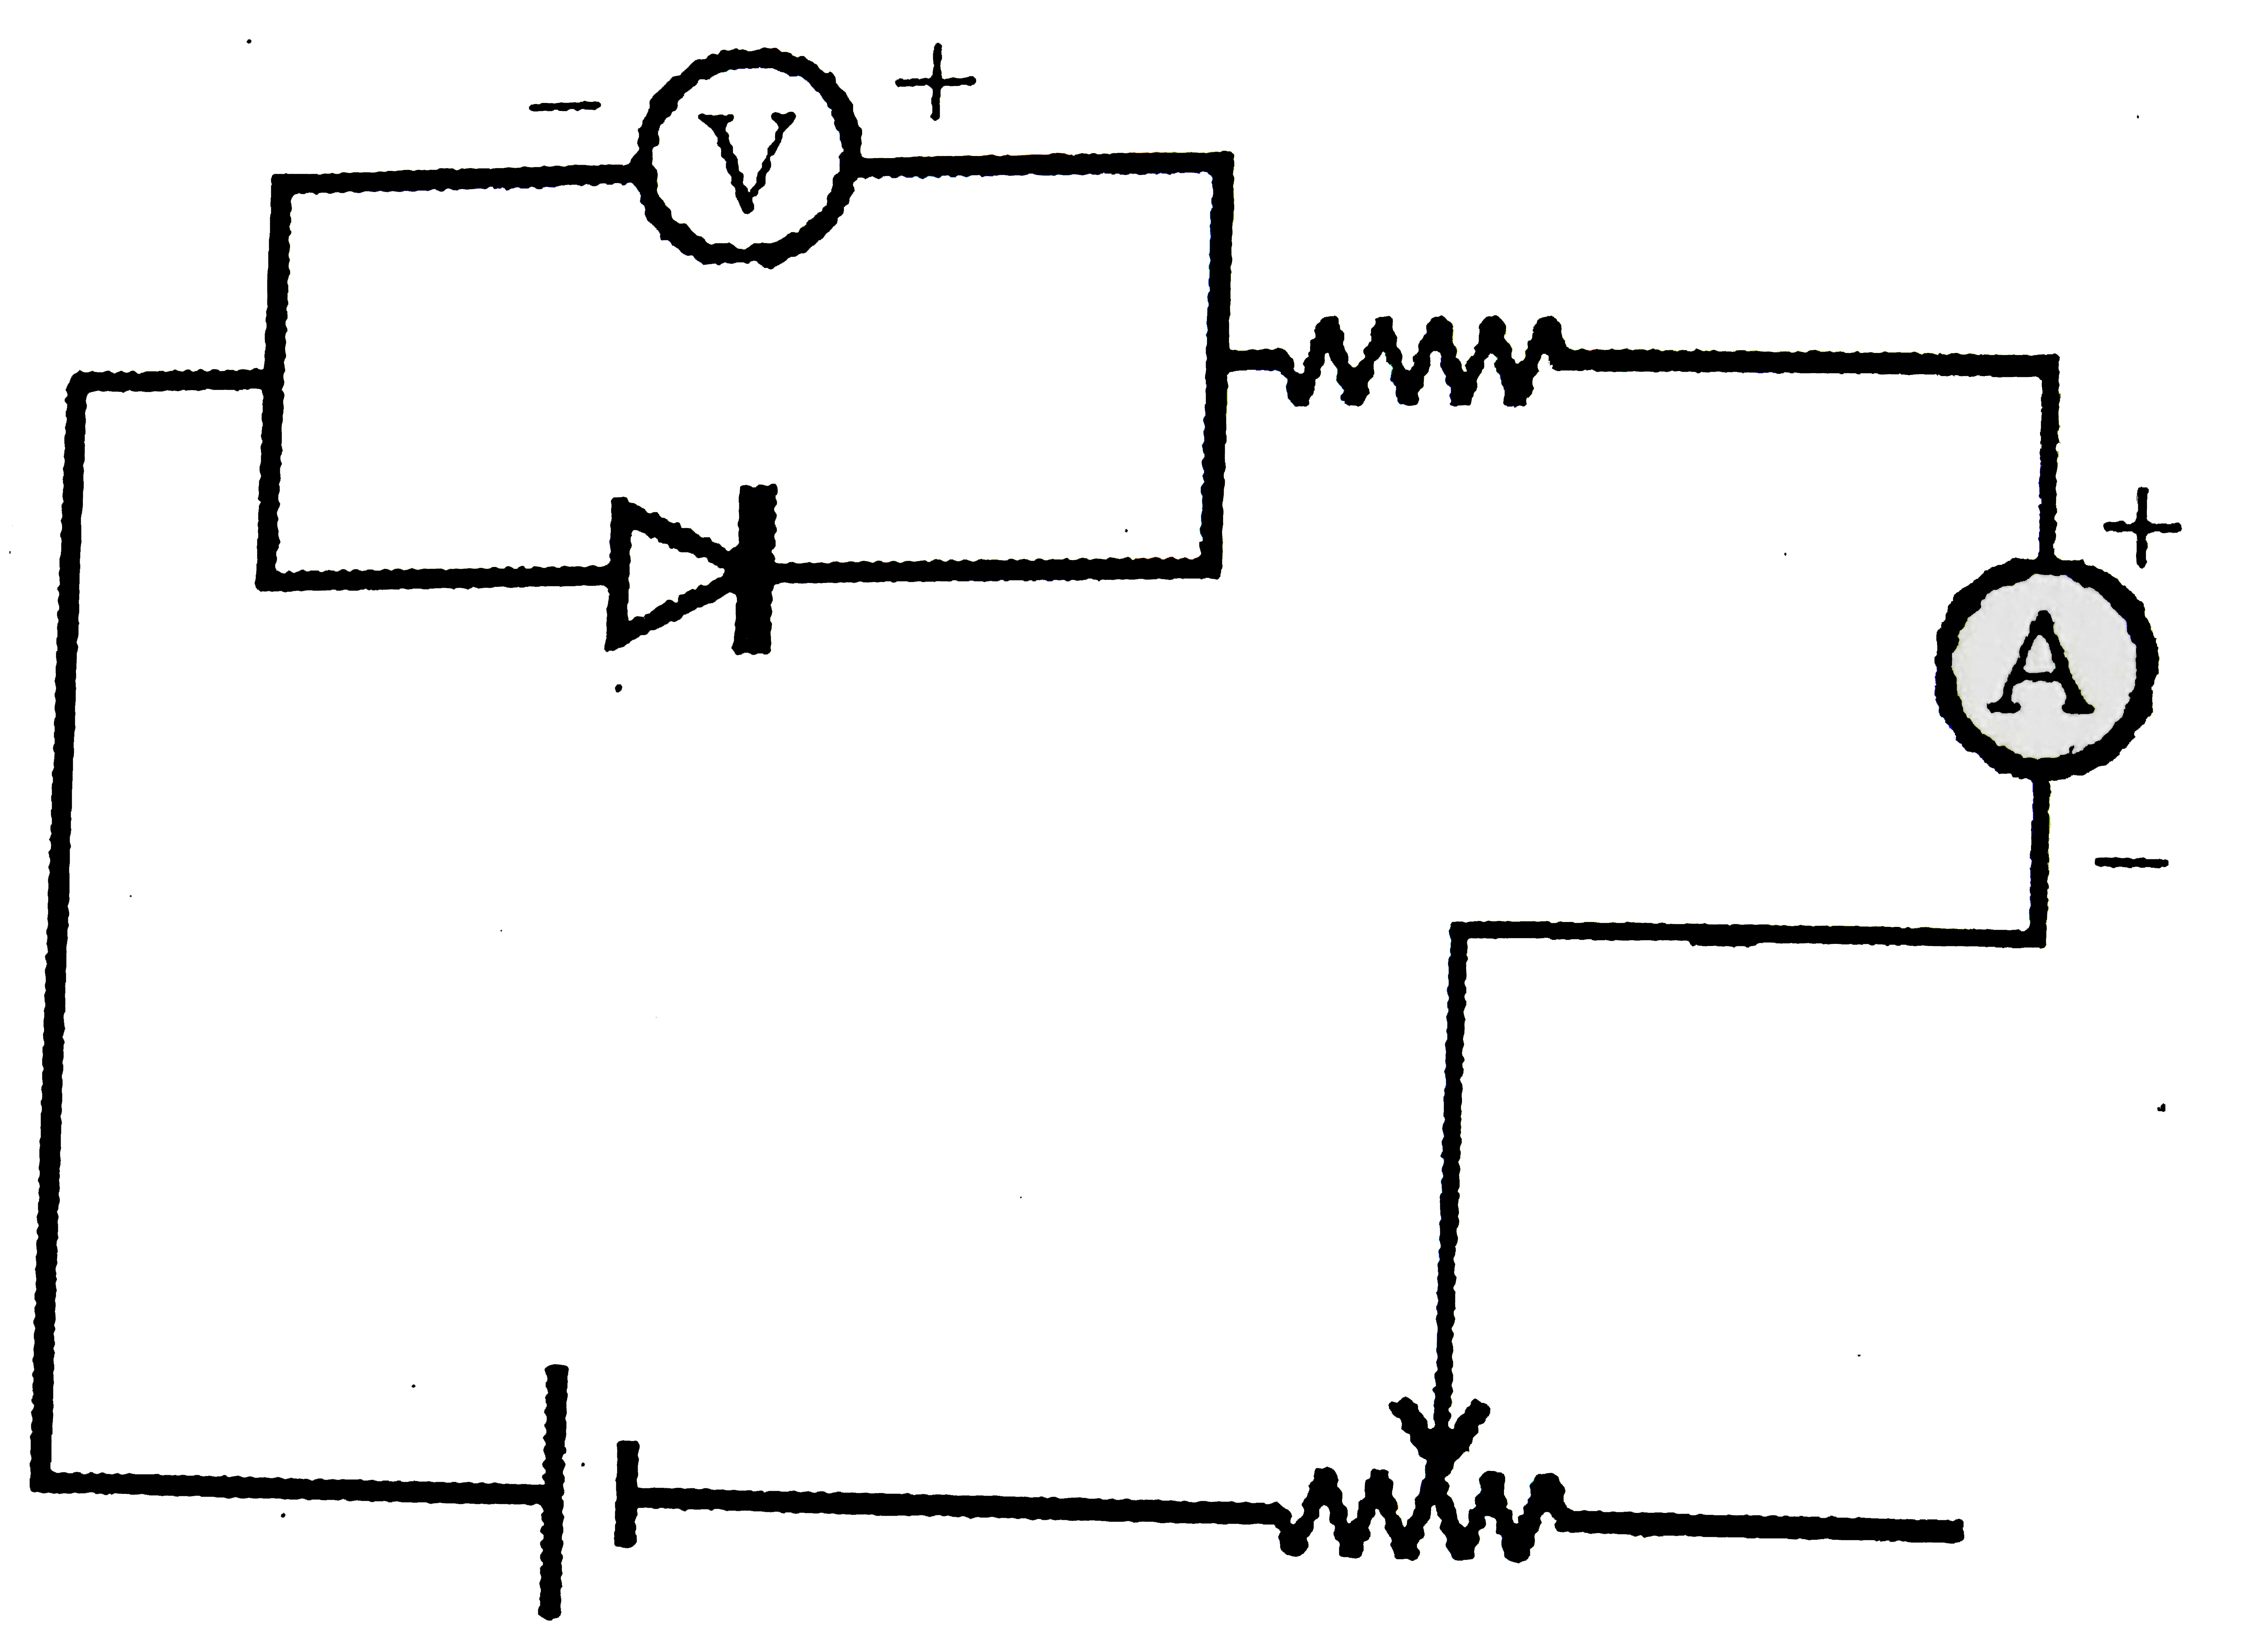 C
C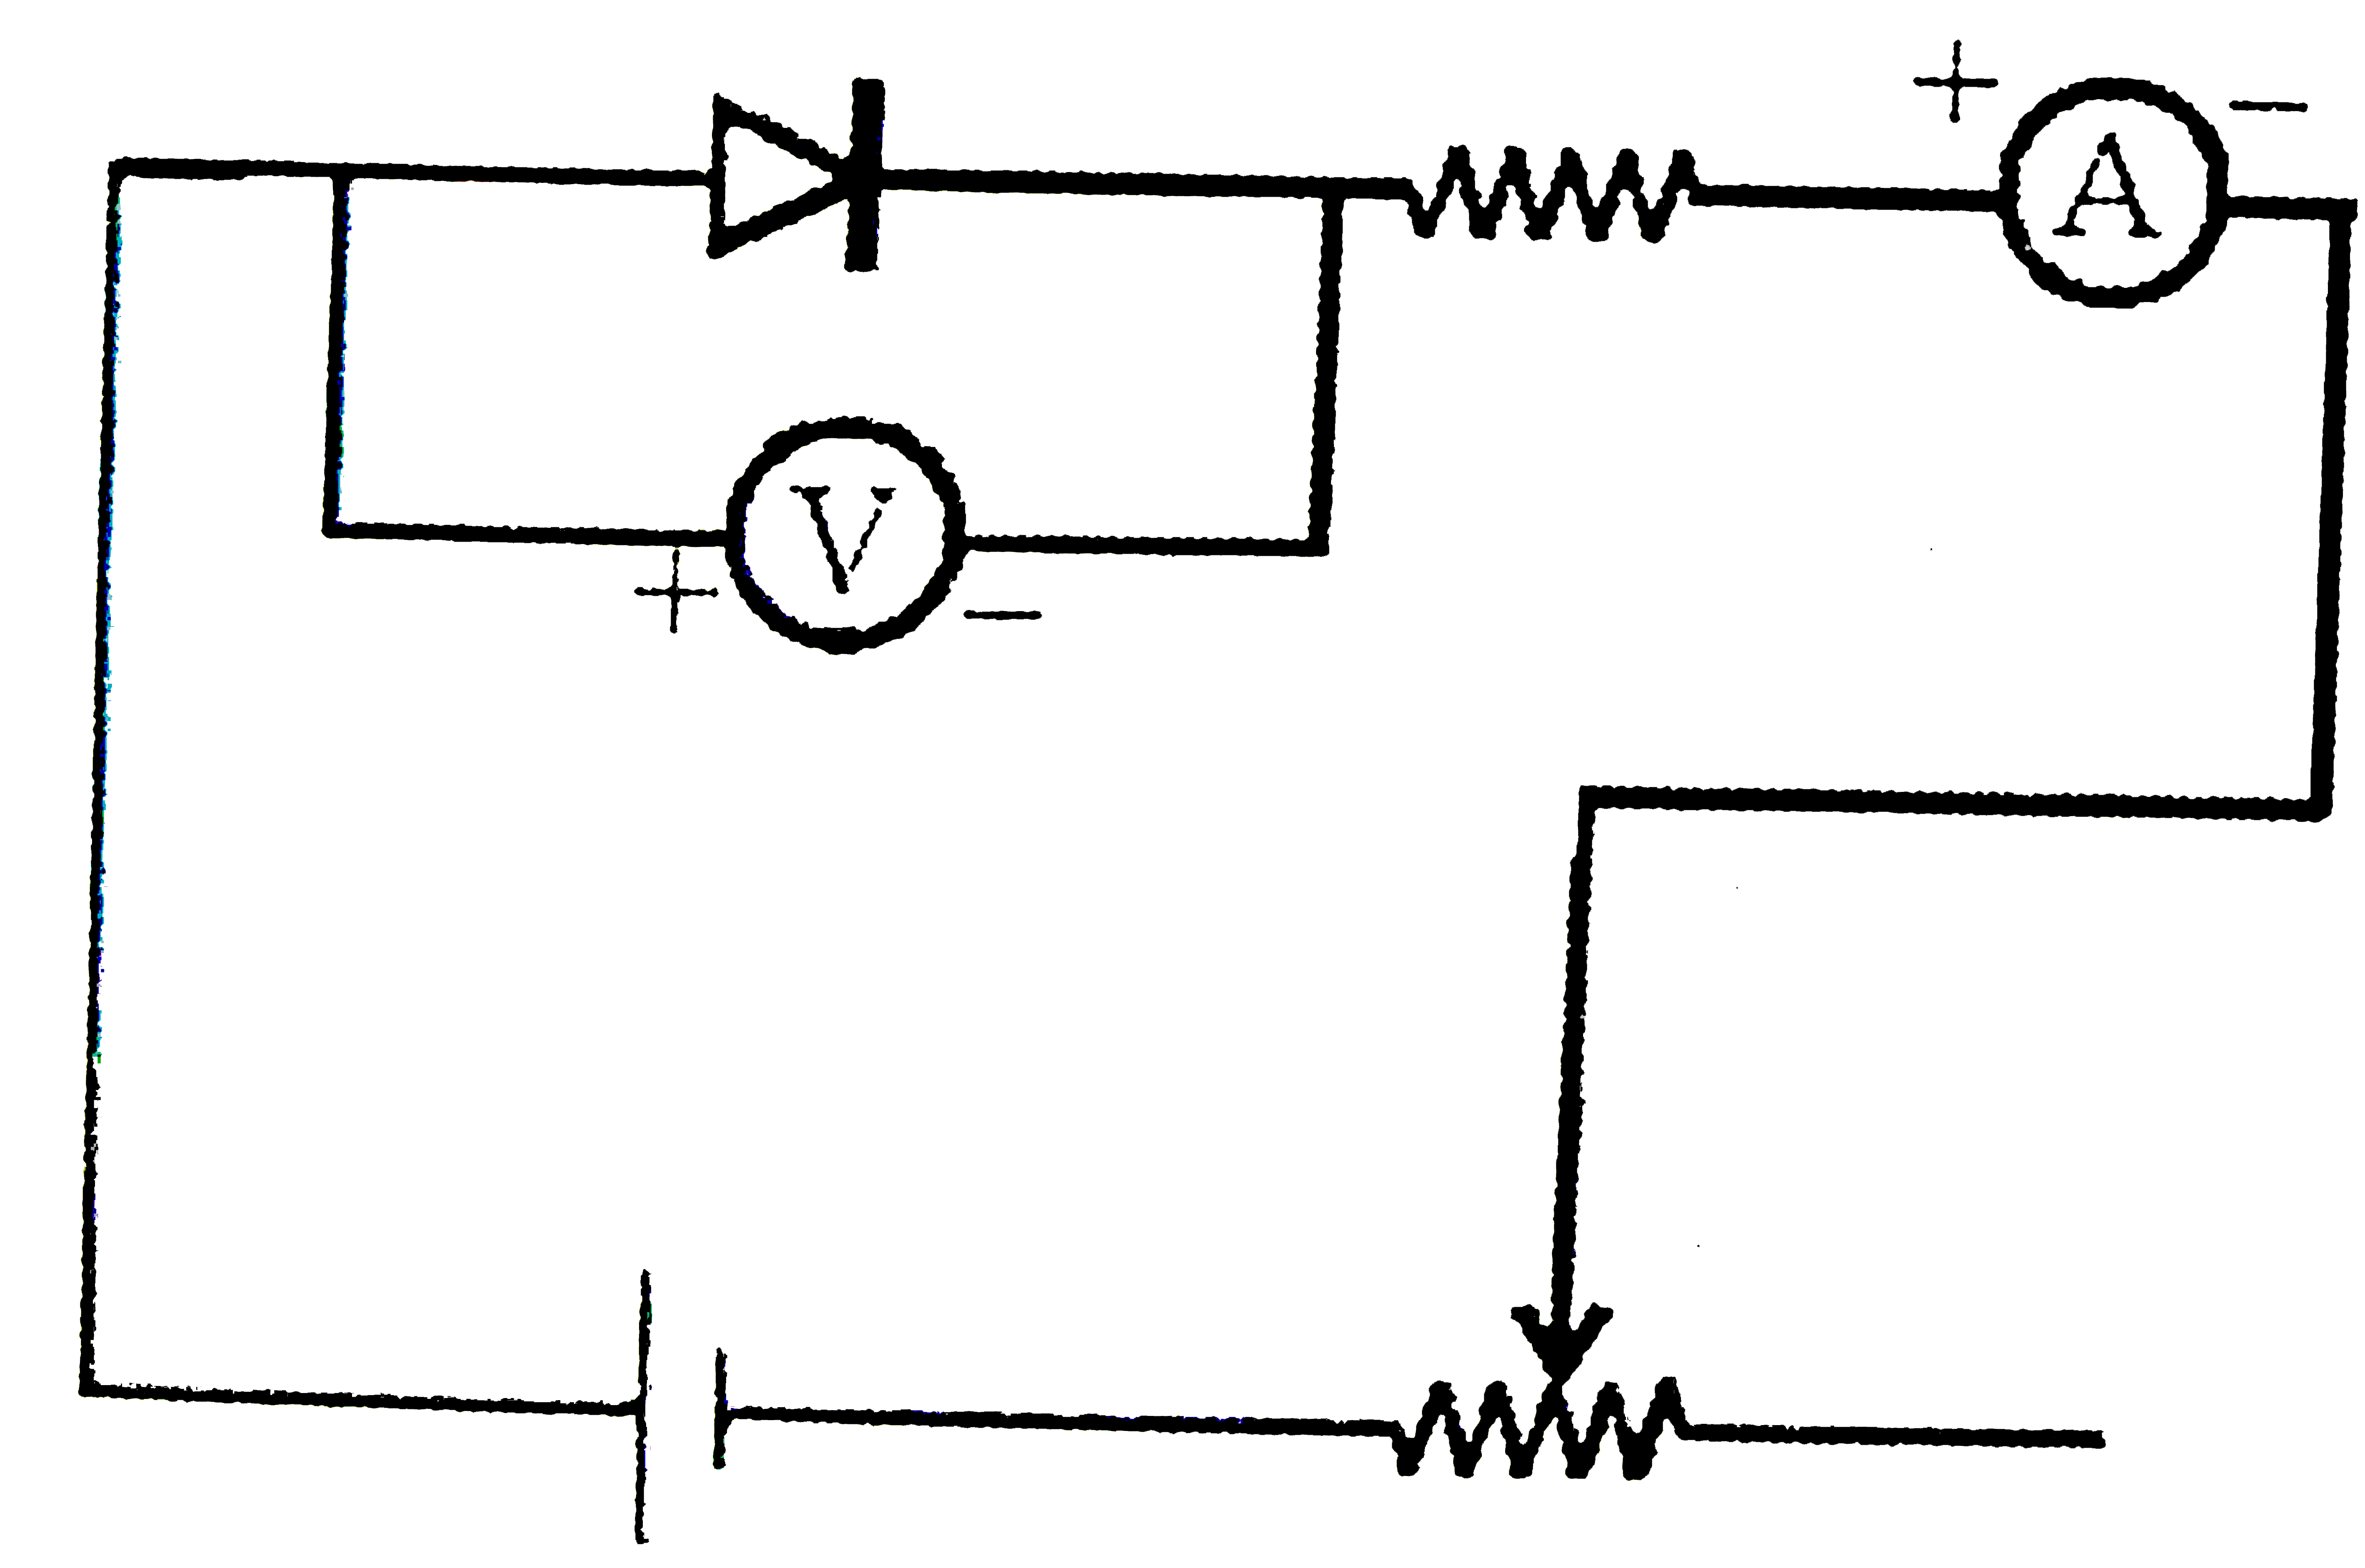 DNone of these
The curves A and B in the figure shown P-V graphs for an isothermal and an adiabatic process for an idea gas. The isothermal process is represented by the curve A.

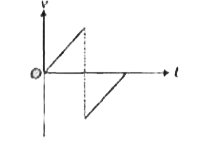
View SolutionThe velocity (v) - time (t) graph for a particle moving along x - axis is shown in the figure. The corresponding position (x) - time (t) is best represented by
View SolutionIf velocity v varies with time(t) as v=2t−3, then the plot between v and t is best represented by :
View SolutionThe velocity (v) - time (t) graph for a particle moving along x - axis is shown in the figure. The corresponding position (x) - time (t) is best represented by

View SolutionIf velocity v varies with time(t) as v=2t−3, then the plot between v and t is best represented by :
View Solution
