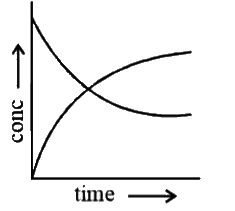
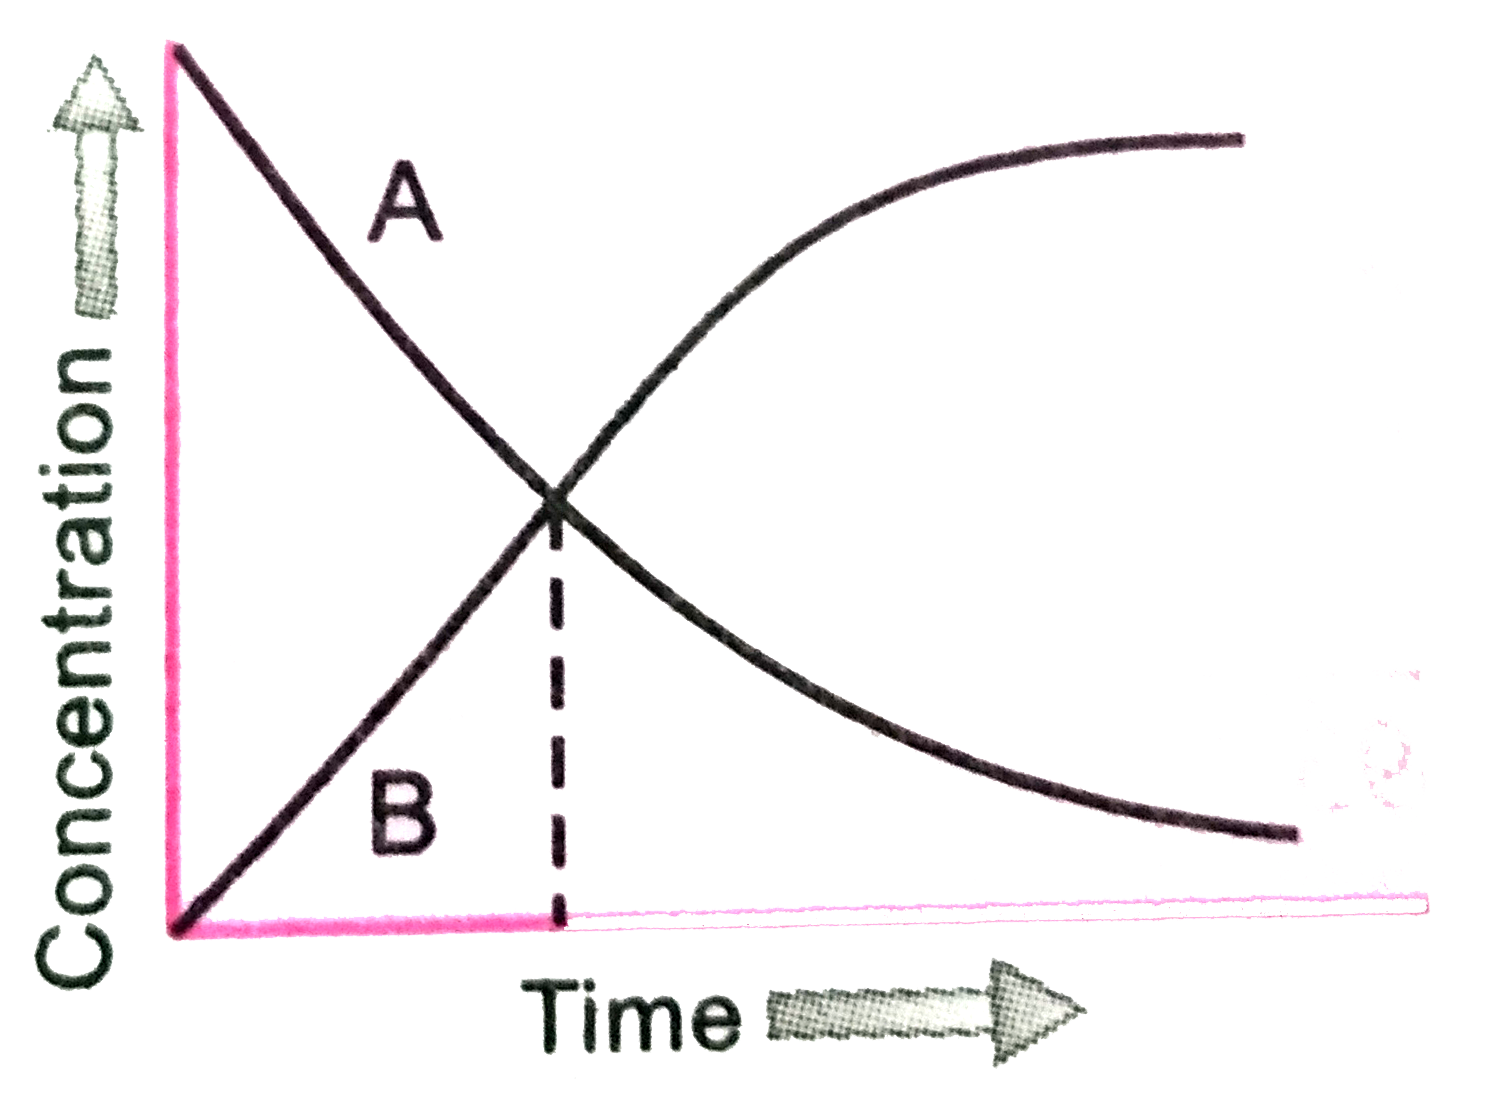
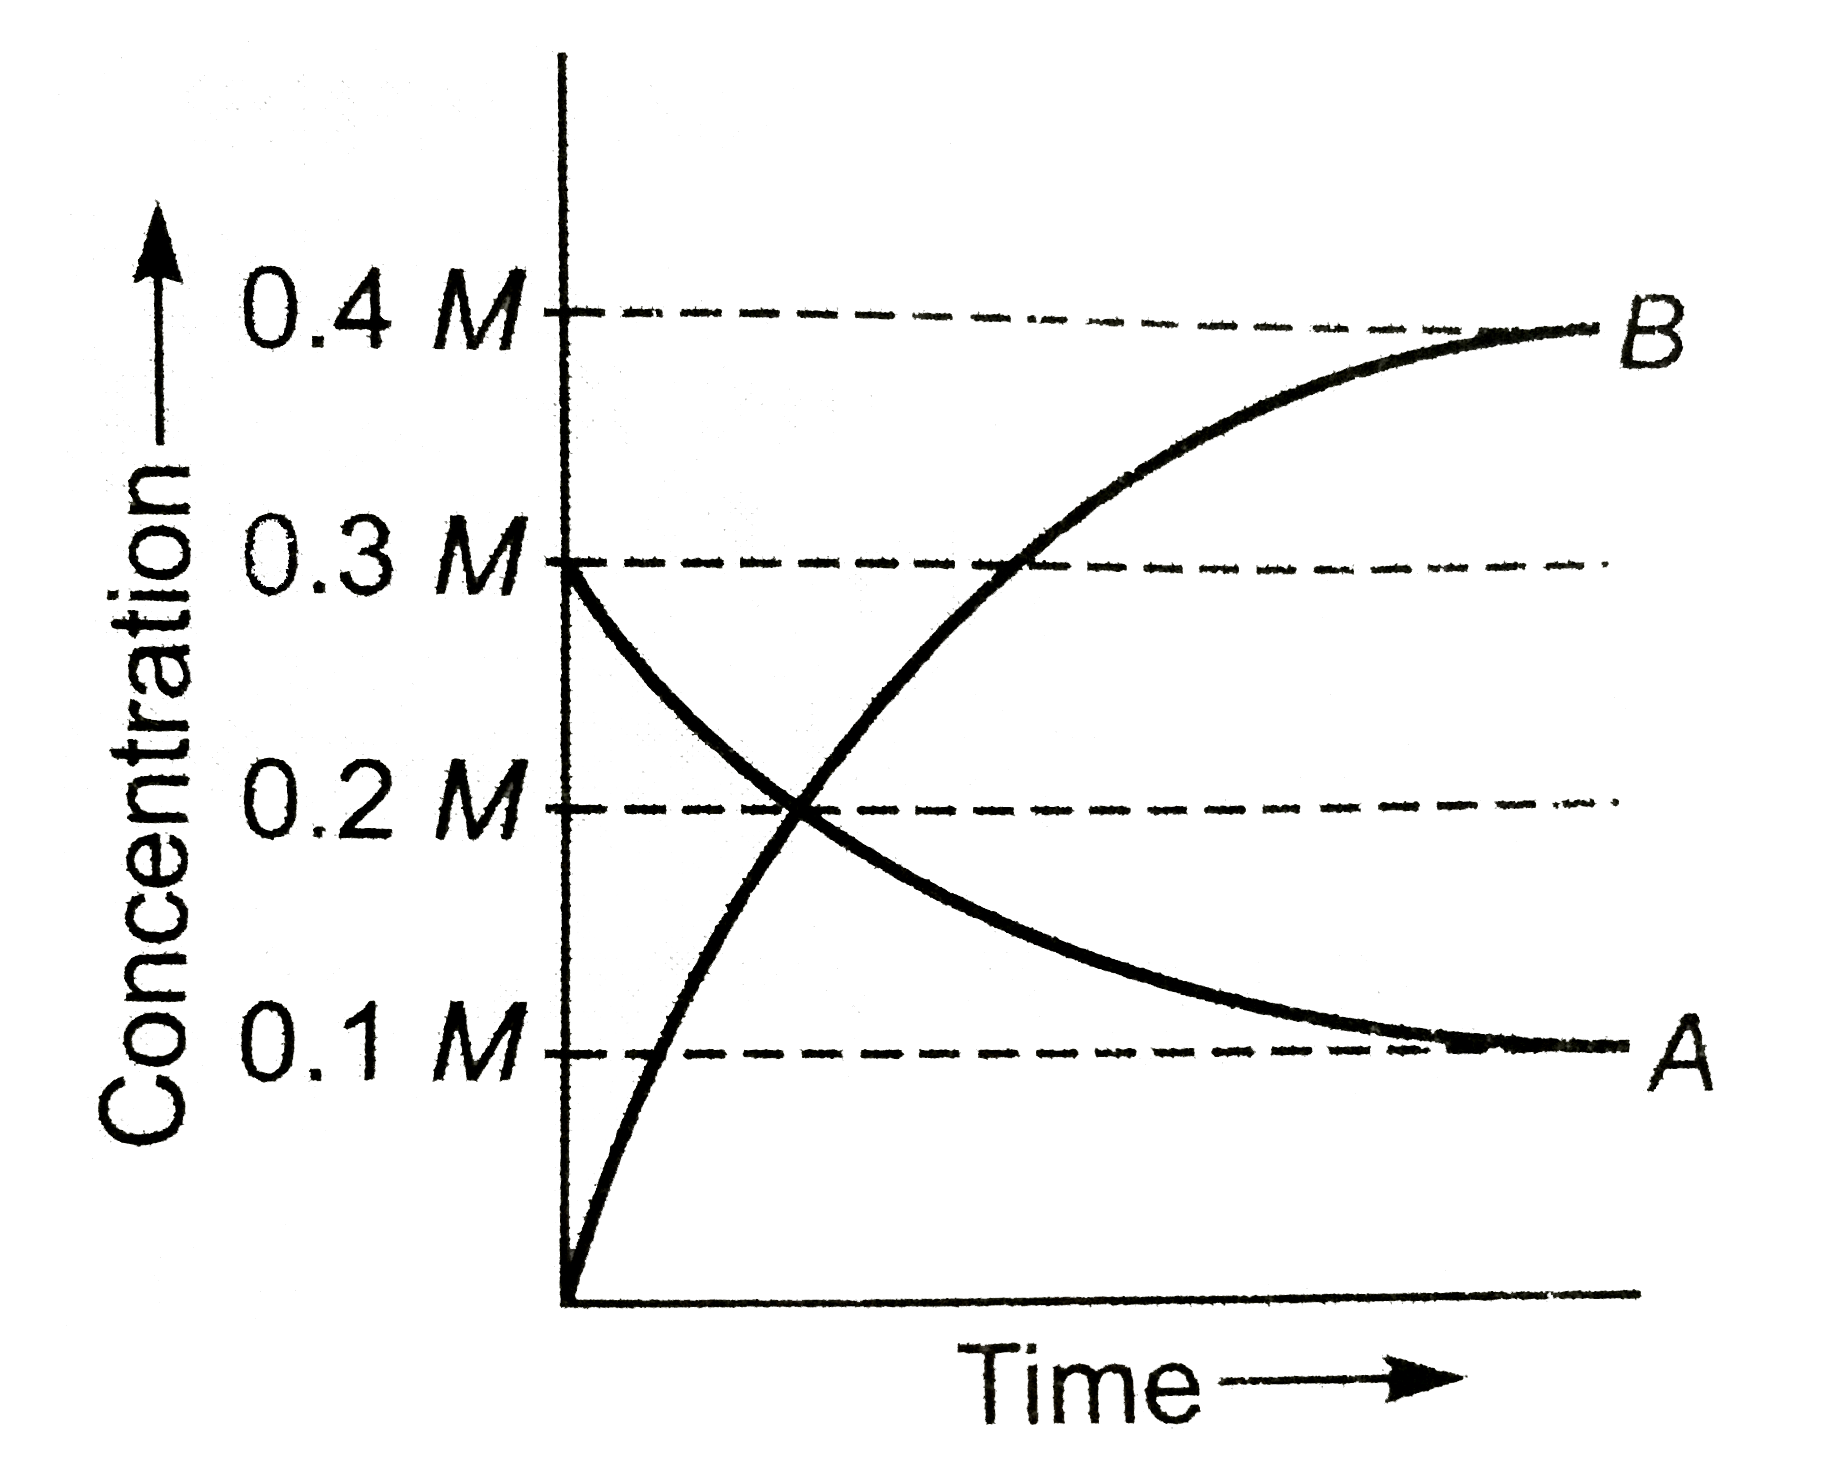
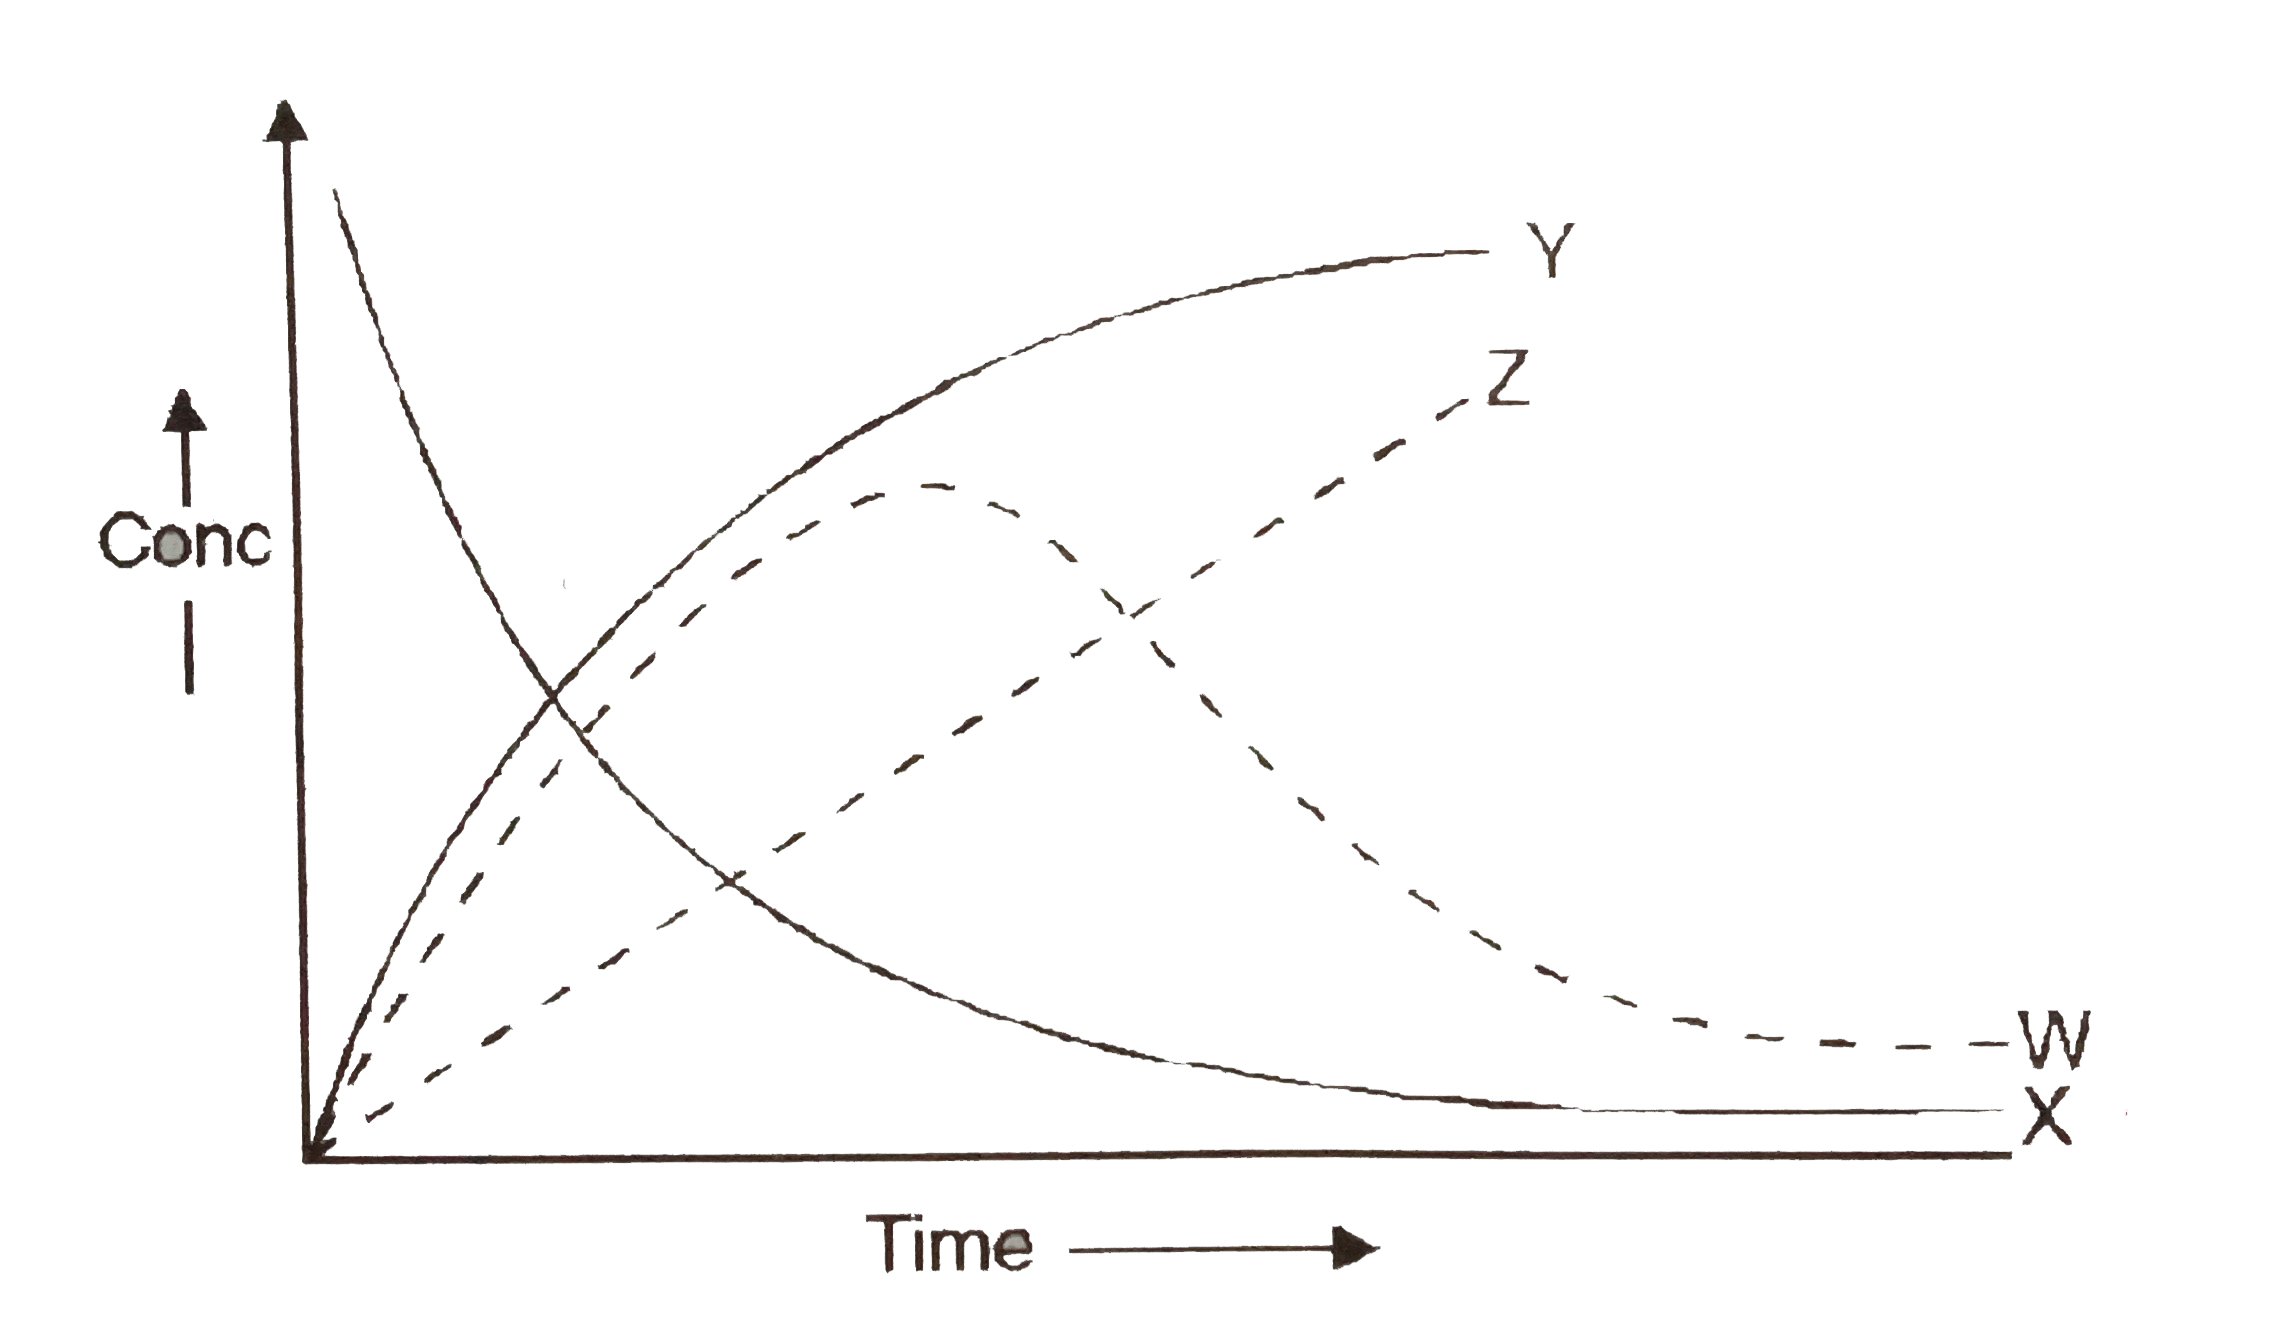
The figure below depicts the change in the concentration of the species A and B for the reaction A→B, as a function of time. The point of intersection of the two curves represents
t1/4
t1/3
t1/2
The method cannot be used to predict fractional life time
The correct Answer is:C
At the point of intersection, [A] = [B], i.e., half of the reactant has reacted. Hence, it represents t1/2
Topper's Solved these Questions
- BOOK - PRADEEPCHAPTER - CHEMICAL KINETICSEXERCISE - COMPETITION FOCUS (JEE(Main and Advanced)/Medical Entrance) (II. Multiple Choice Questions)1videos
CHEMICAL KINETICS
- BOOK - PRADEEPCHAPTER - CHEMICAL KINETICSEXERCISE - COMPETITION FOCUS (JEE(Main and Advanced)/Medical Entrance) (I. Multiple Choice Questions) With one or more than one correct answers7videos
CHEMICAL KINETICS
- BOOK - PRADEEPCHAPTER - CHEMICAL KINETICSEXERCISE - VALUE BASED QUESTIONS (WITH ANSWERS)2videos
CHEMICAL KINETICS
- BOOK - PRADEEPCHAPTER - BIOMOLECULES EXERCISE - IMPORTANT QUESTIONS (FOR BOARD EXAMINATION)25videos
BIOMOLECULES
- BOOK - PRADEEPCHAPTER - CHEMISTRY IN EVERYDAY LIFE EXERCISE - IMPORTANT QUESTION FOR BOARD EXAMINATION30videos
CHEMISTRY IN EVERYDAY LIFE
Similar Questions
Knowledge Check
- Question 1 - Select One
The accompanying figure depicts a change in concentration of species A and B for the reaction A→B, as a function of time. The point of inter section of the two curves represents
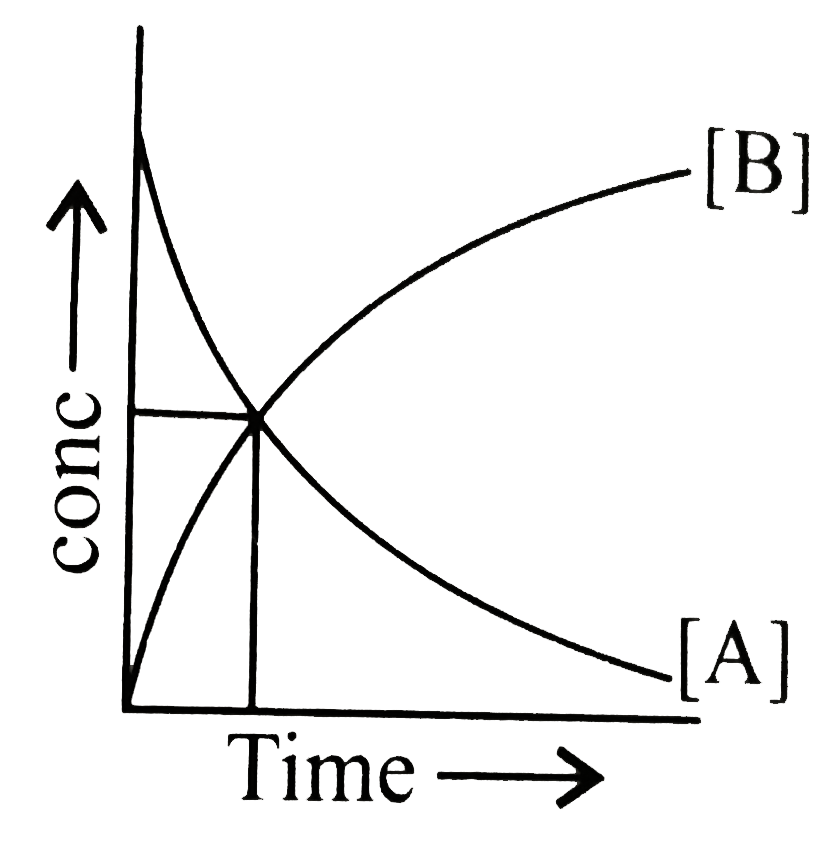 At1/2Bt3/4Ct2/3DData insufficient to predict
 - Question 2 - Select One
The accompanying figure depicts a change in concentration of species A and B for the reaction A→B, as a function of time. The point of inter section of the two curves represents
 At1/2Bt3/4Ct2/3DData insufficient to predict
 - Question 3 - Select One
The accompanying figure depicts a change in concentration of species A and B for the reaction A→B, as a function of time. The point of inter section of the two curves represents
 At1/2Bt3/4Ct2/3DData insufficient to predict
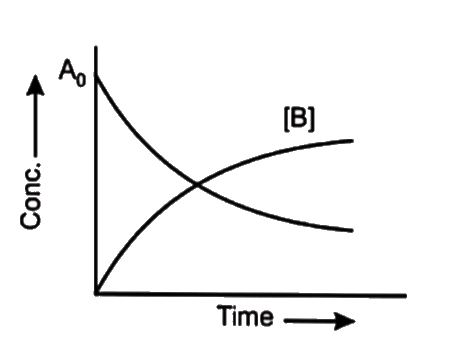
At the point of intersection of the two curves shown the concentration of B is given by _______for the first reaction A→nB.
 View Solution
The concentrations of the reactant A in the reaction A →B at different times are given below:
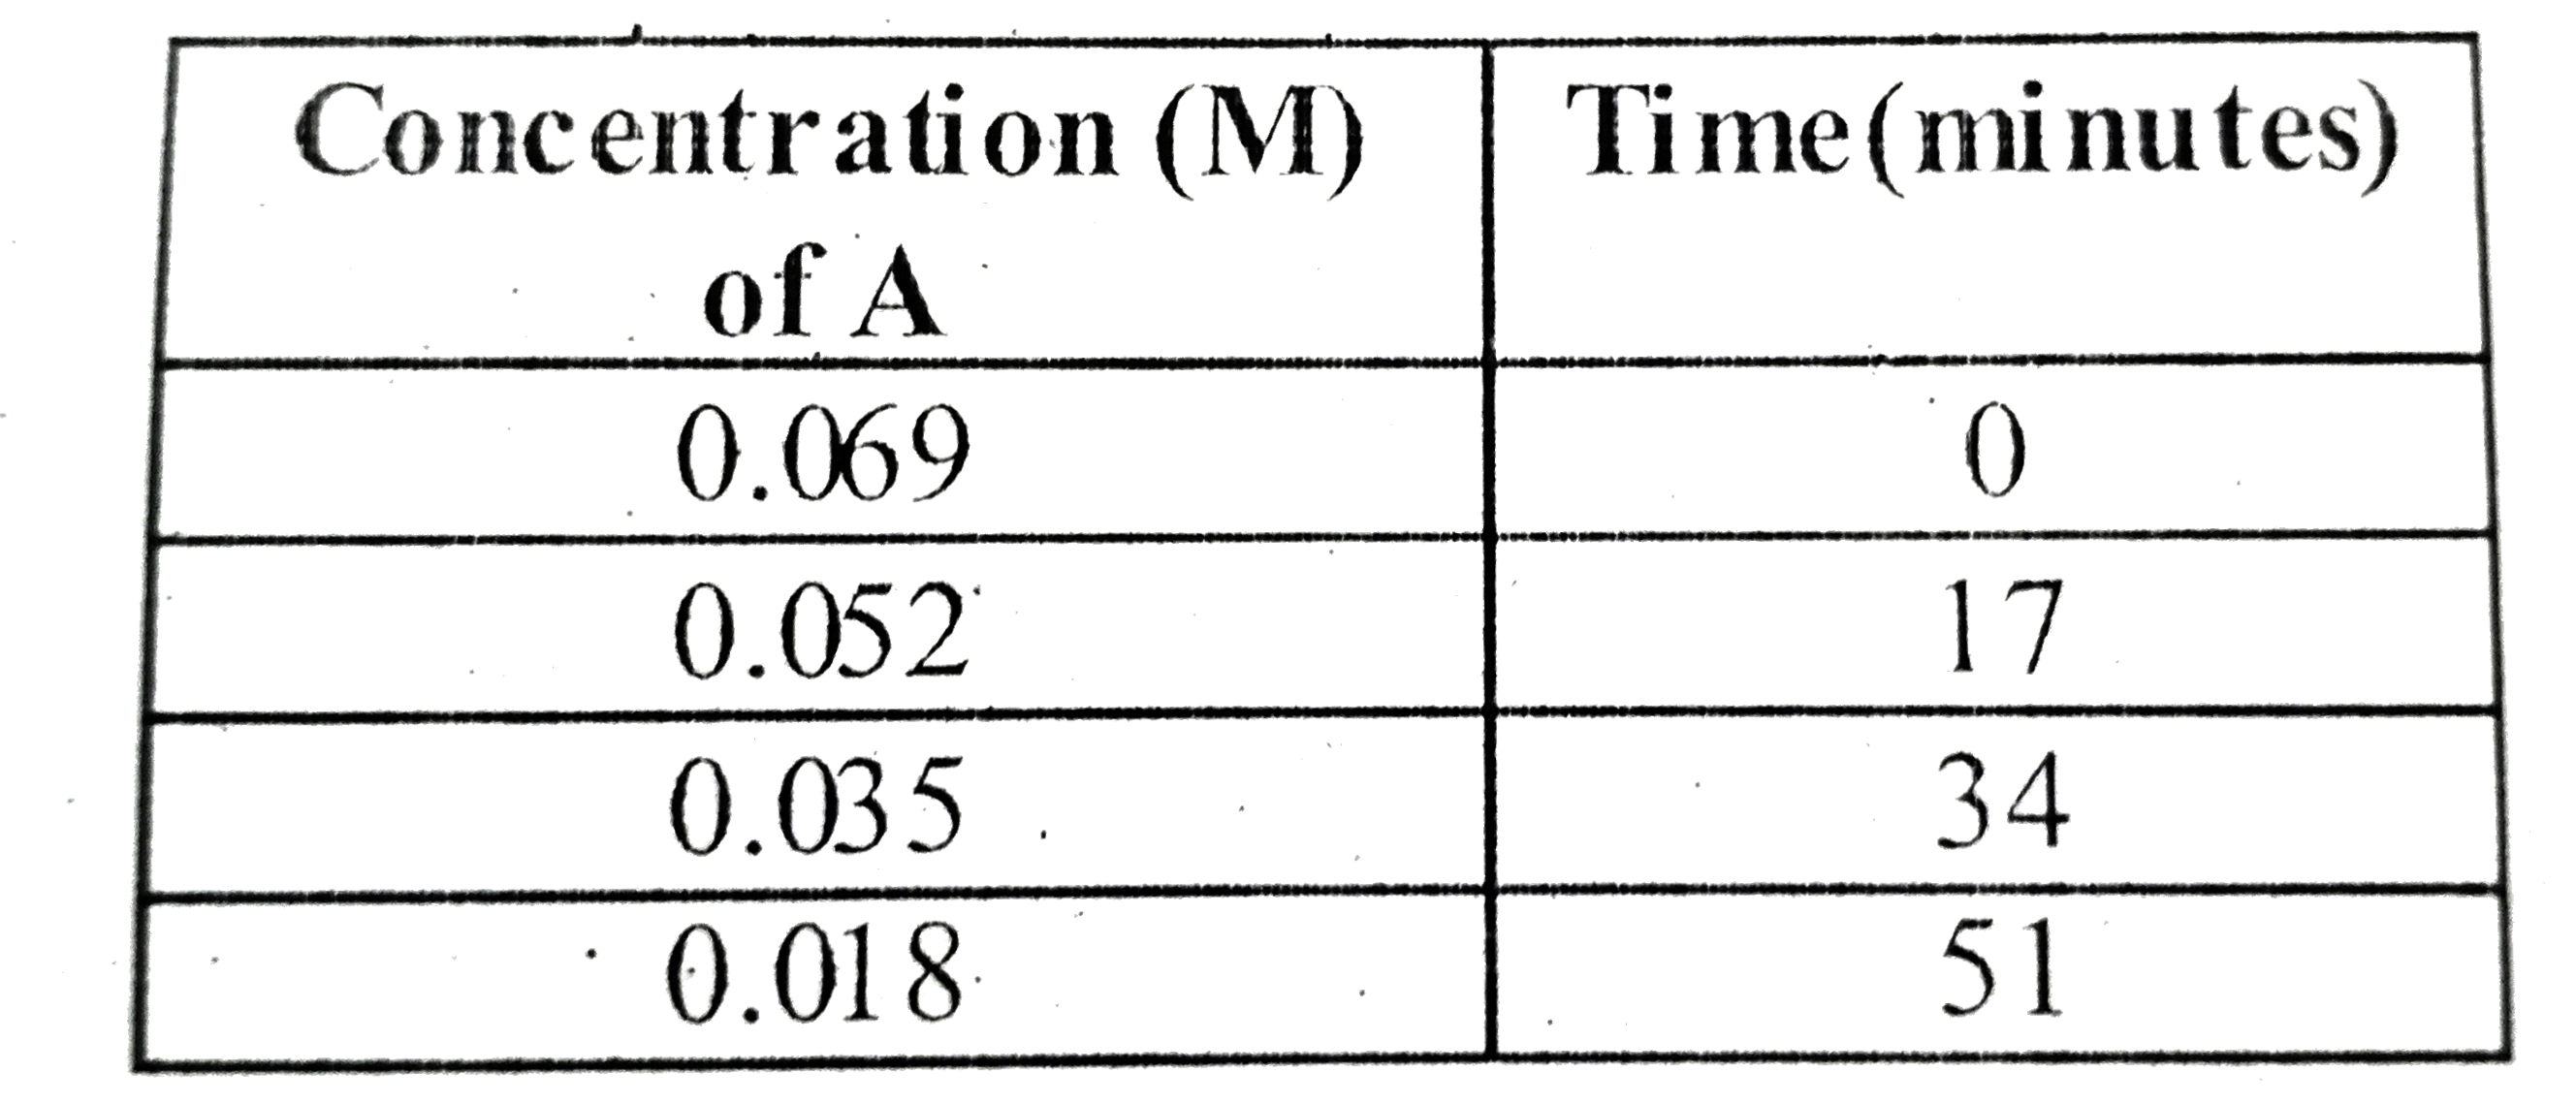
The rate constant of the reaction according to the correct order of reaction is :View SolutionThe figure shows the change in concentration of species A and B as a function of time.
The equilibrium constant Kcfor the reactionA(g)⇔2B(g) is :
 View Solution
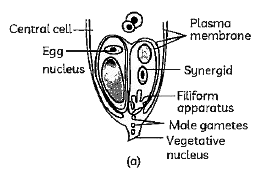
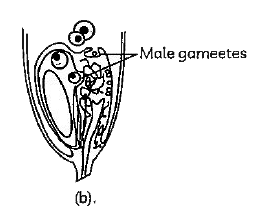
The figure (a) and (b) are depicting:View SolutionFor the reaction A+B→C+D The variation of the concentration of the products is given by the curve
 View Solution


