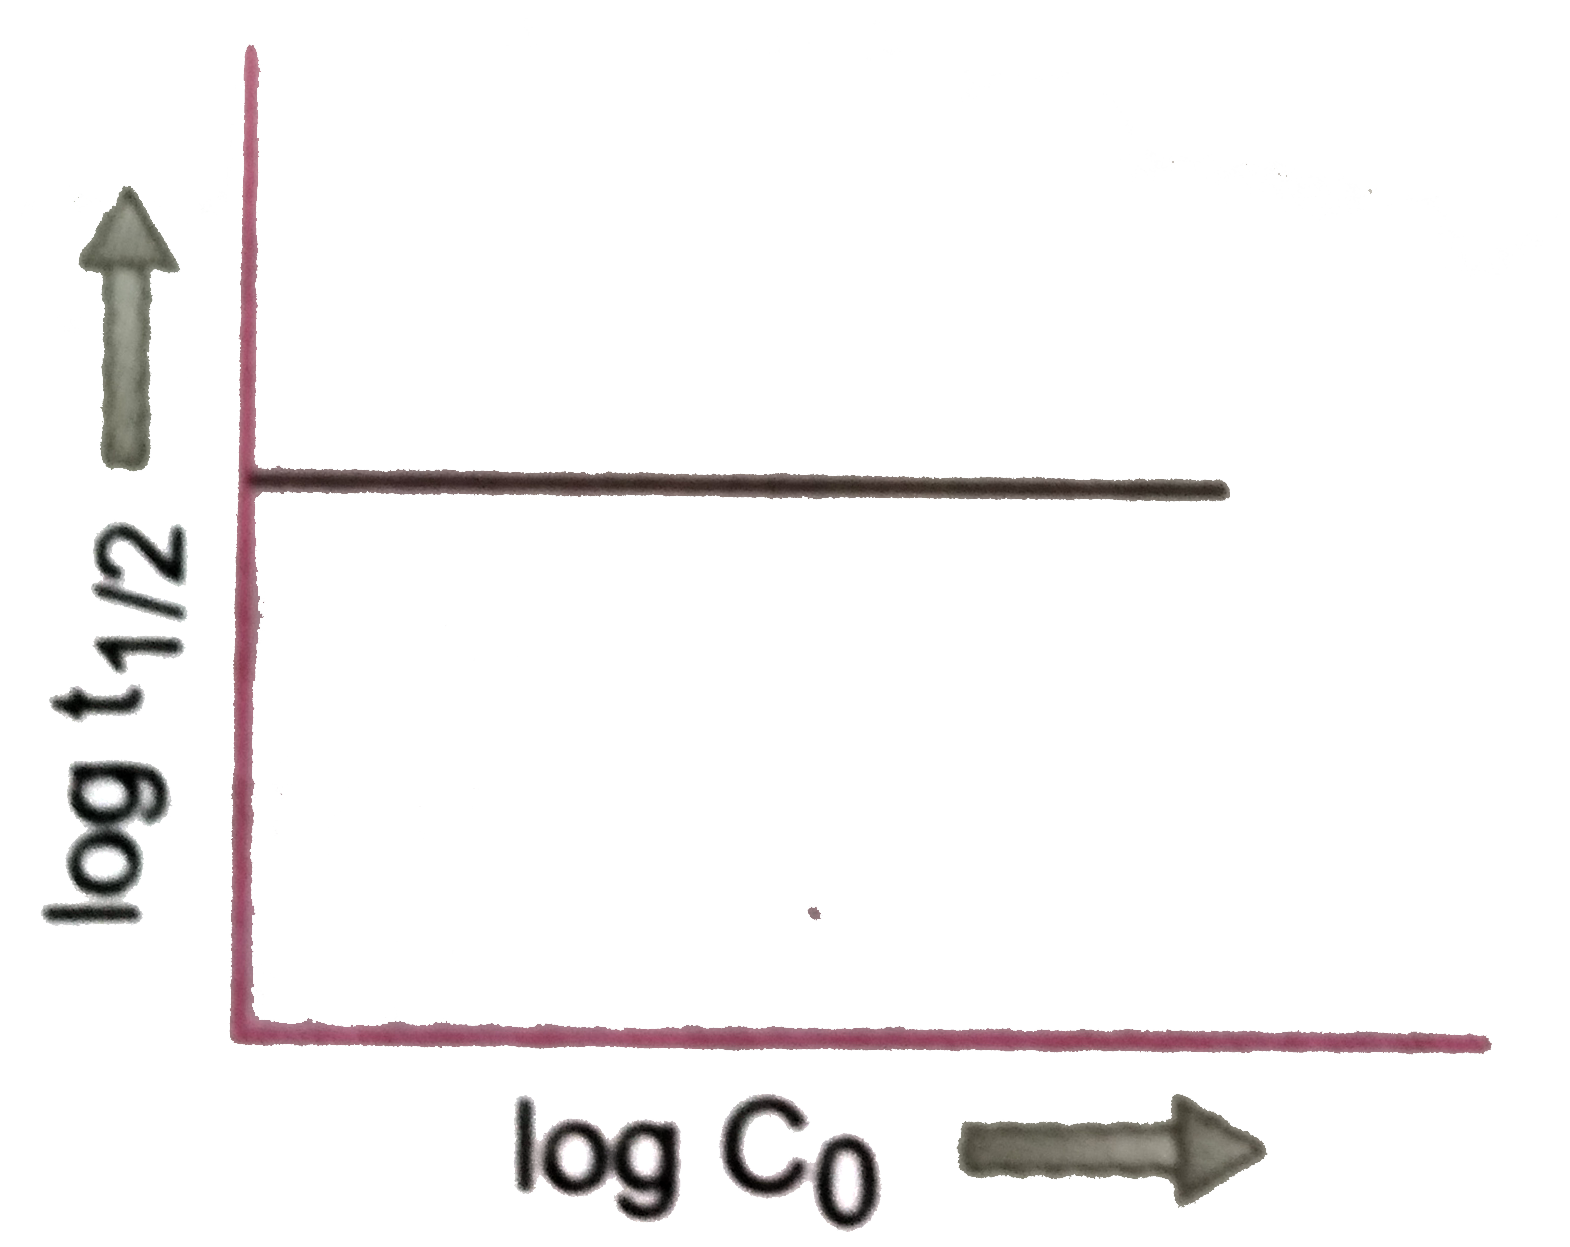
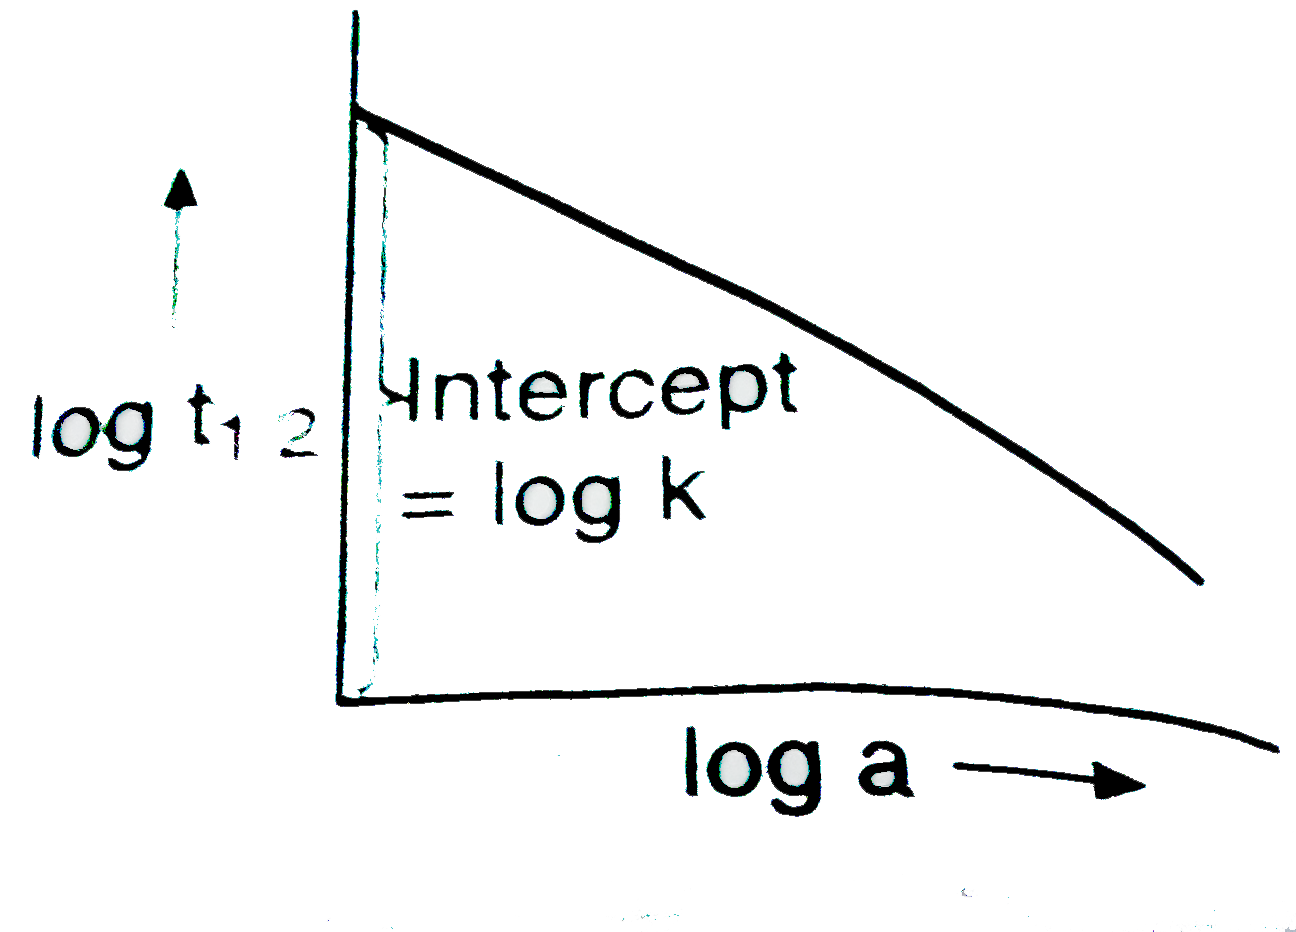
A plot of log versus log is given in the adjoining fig. The conclusion that can be drawn from this graph is
Order
Order
Order
Order
The correct Answer is:B
(K = constant)
Thus, Plot of log will be linear with slope = 1 - n. But as is parallel to log axis, slope = 0, i.e., 1 - n = 0 or n = 1. Hence, it is a reaction of 1st order and for 1st order reactions,
.
Topper's Solved these Questions
- BOOK - PRADEEPCHAPTER - CHEMICAL KINETICSEXERCISE - COMPETITION FOCUS (JEE(Main and Advanced)/Medical Entrance) (II. Multiple Choice Questions)1videos
CHEMICAL KINETICS
- BOOK - PRADEEPCHAPTER - CHEMICAL KINETICSEXERCISE - COMPETITION FOCUS (JEE(Main and Advanced)/Medical Entrance) (I. Multiple Choice Questions) With one or more than one correct answers7videos
CHEMICAL KINETICS
- BOOK - PRADEEPCHAPTER - CHEMICAL KINETICSEXERCISE - VALUE BASED QUESTIONS (WITH ANSWERS)2videos
CHEMICAL KINETICS
- BOOK - PRADEEPCHAPTER - BIOMOLECULES EXERCISE - IMPORTANT QUESTIONS (FOR BOARD EXAMINATION)25videos
BIOMOLECULES
- BOOK - PRADEEPCHAPTER - CHEMISTRY IN EVERYDAY LIFE EXERCISE - IMPORTANT QUESTION FOR BOARD EXAMINATION30videos
CHEMISTRY IN EVERYDAY LIFE
Similar Questions
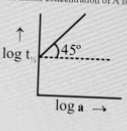
For a reaction A→ Products, a plot of logt12 ,versus log a is shown in figure. If the initial concentration of A is represented by a ,the order of the reaction is:-
 View Solution
A graph plotted between logt50 vs log concentration is a straight line. What conclusion can you draw the given graph?

[Given : n = order of reaction]View Solution
Knowledge Check
- Question 1 - Select One
A graph plotted between logt50% vs log concentration in a straight line. What conclusion can you draw from this graph?
 An= 1, t1/2=tx×aBn=2,t1/2=1aCn=1,t1/2=0.693kDnone of these
 - Question 2 - Select One
A graph plotted between log t50% vs log concentration is a straight line. What conclusion can you draw from this graph?
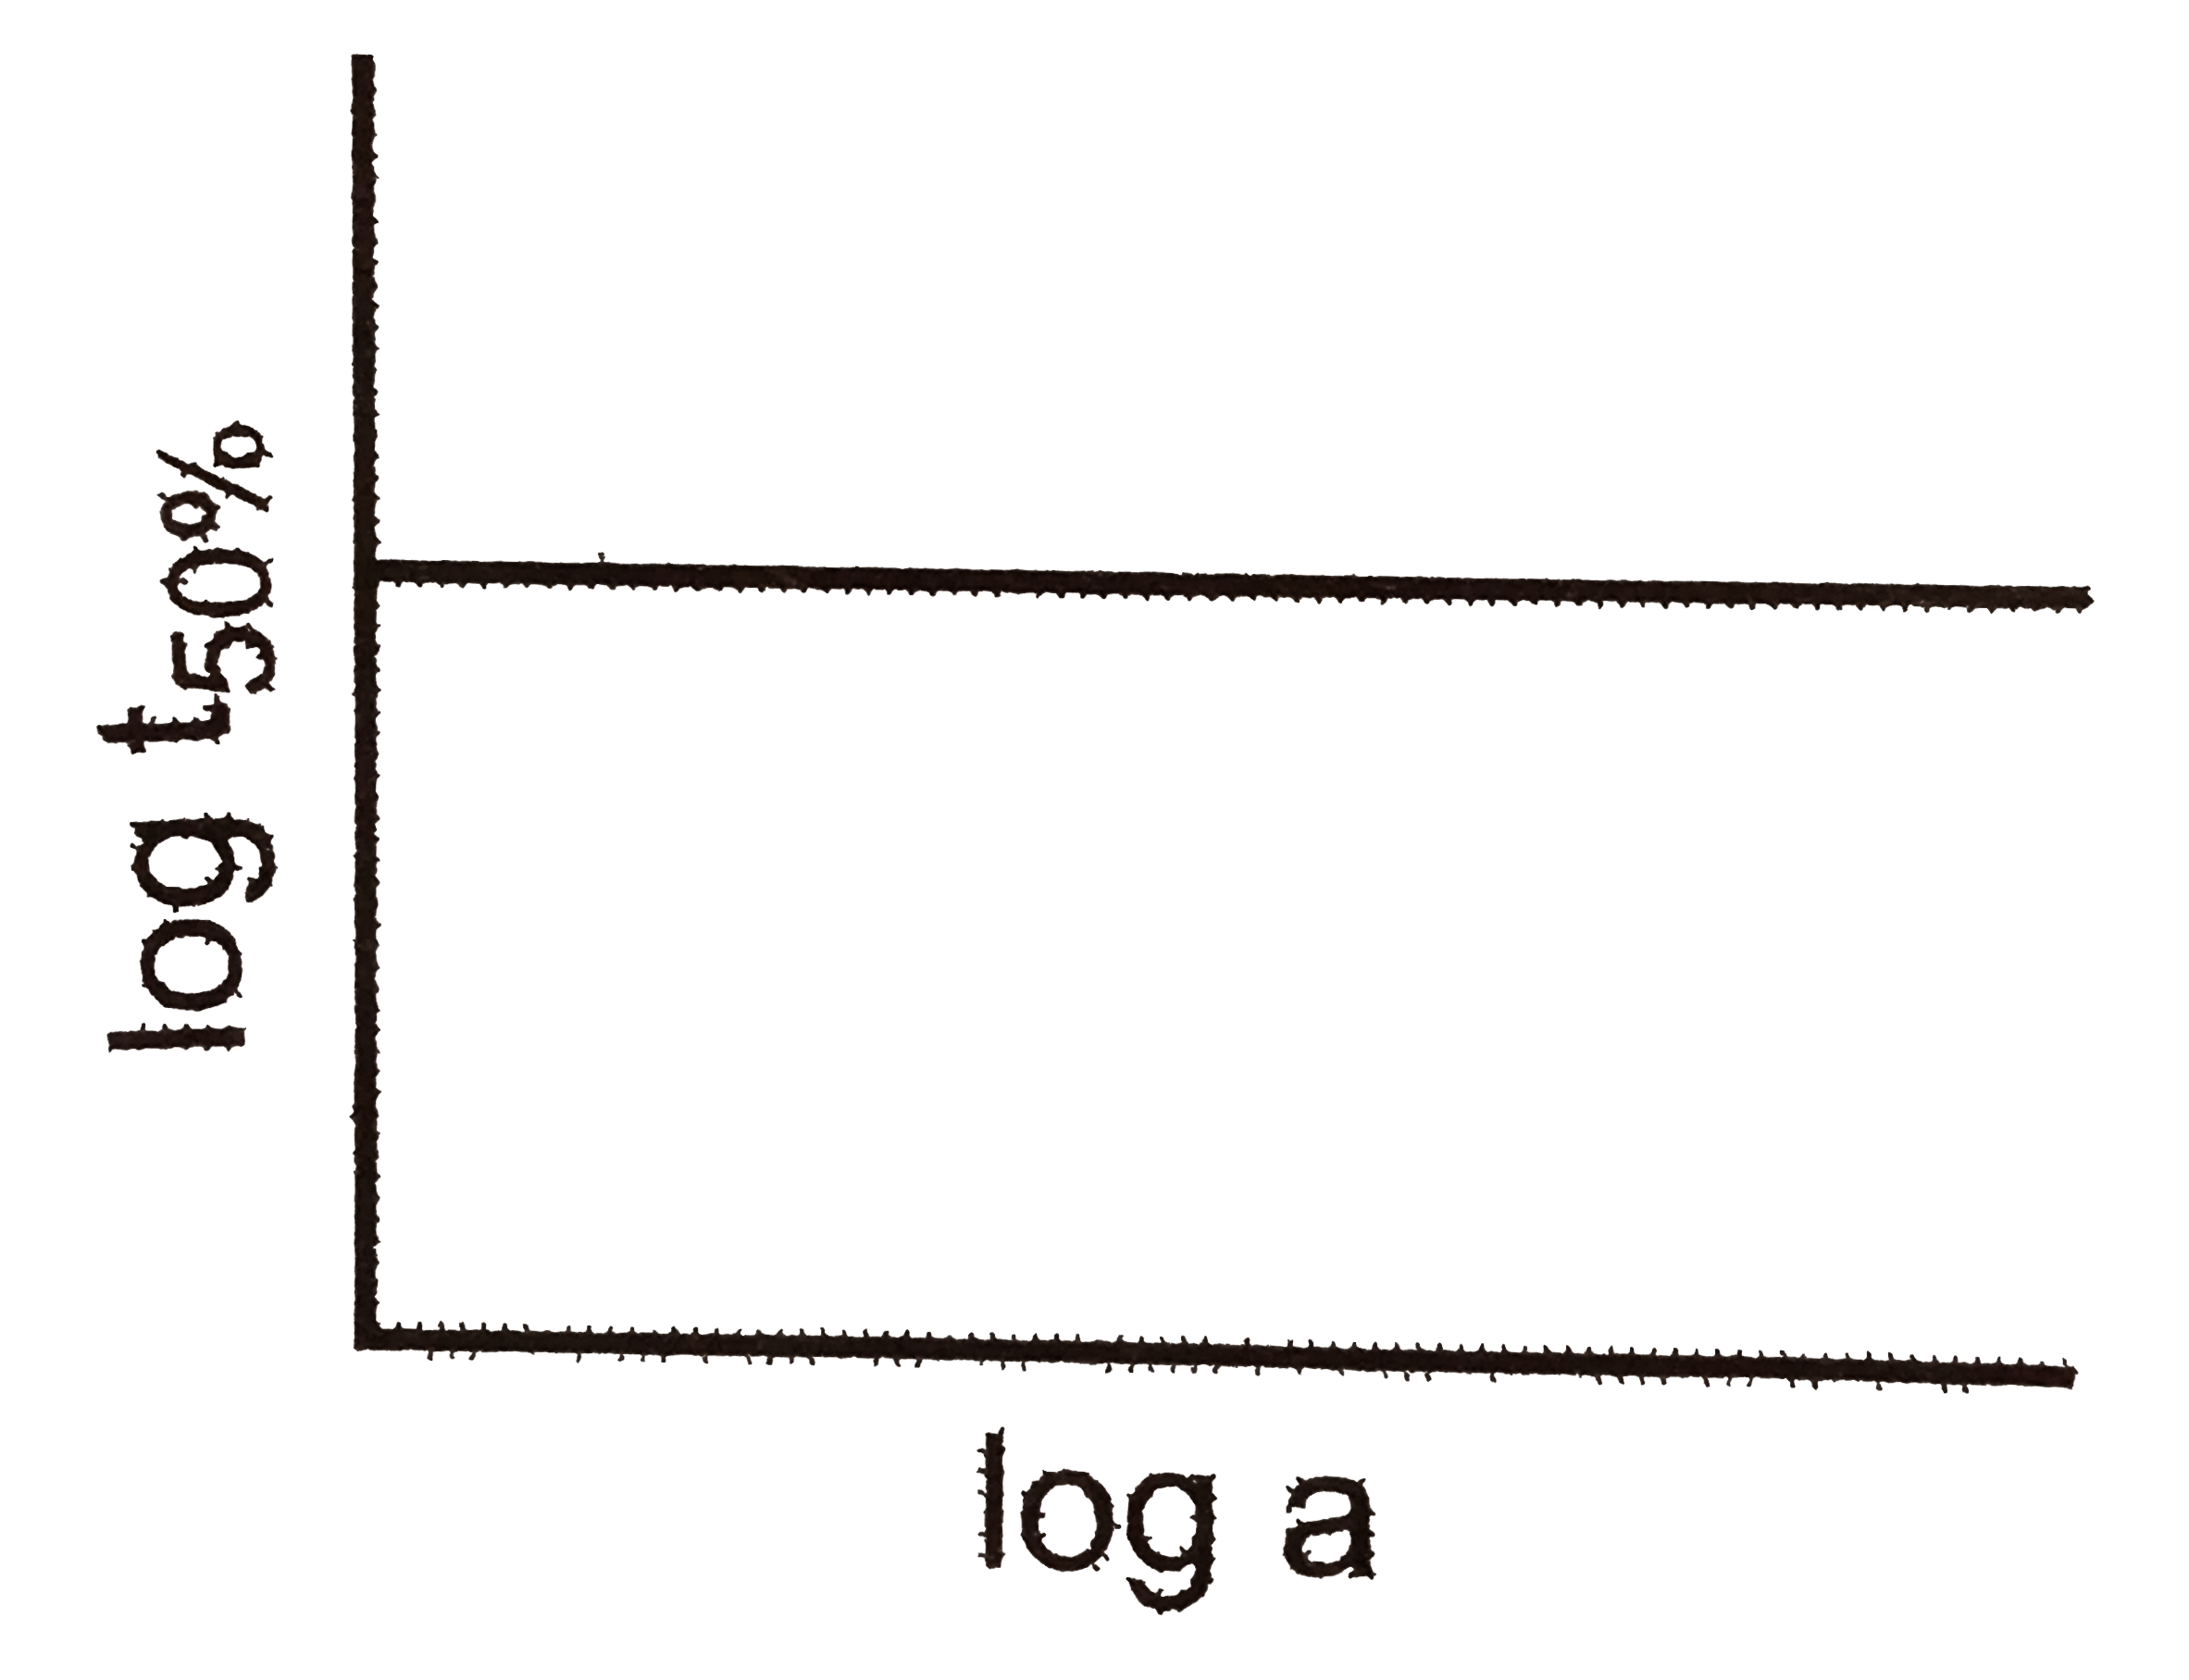 An=1:t1/2=1x×aBn=2:t1/2=1aCn=1:t1/2=0.693kDNone of these
 - Question 3 - Select One
A graph plotted between log t50% vs log concentration is a straight line. What conclusion can you draw from this graph?
 Aa=1:t1/2∝aBa=2,t1/2∝1/aCa=1:t1/2=(0.693/k)DNone of these
A graph plotted between log t50% vs log concentration is a straight line. What conclusion can you draw from this graph?
 View Solution
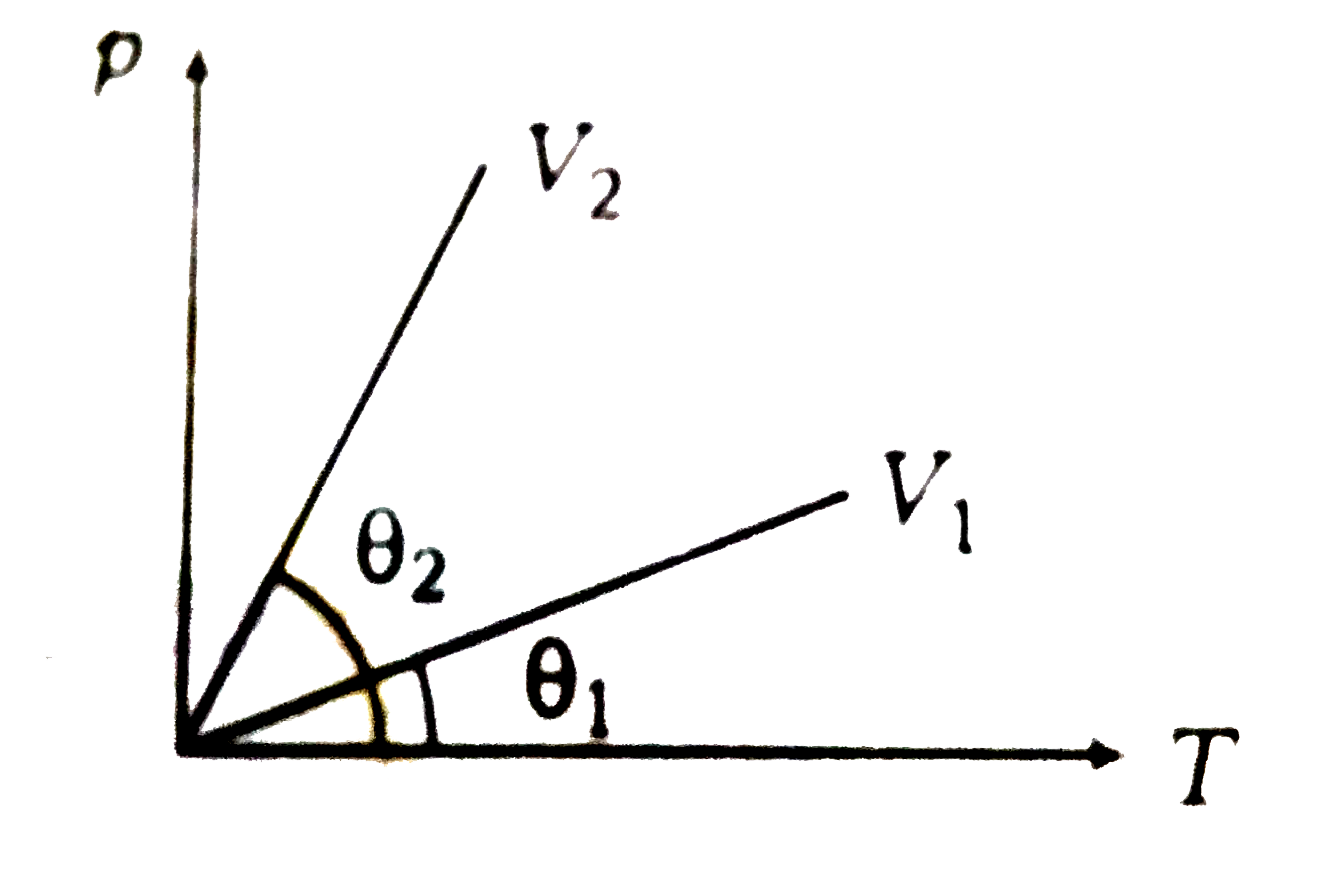
From the p-T graph want conclusion can be drawn?
 View Solution
A graph plotted between log t50% vs log concentration is a straight line. What conclusion can you draw from this graph?
 View Solution
For a second order reaction, 2A→ Products, a plot of log t1/2 vs log a (where a is initial concentration) will give an intercept equal to which one of the following?
 View Solution
Assertion: the plots of logt1/2 vs. log[A]0 gives a straight line with slope (1−n).
Reason: t1/2∝[A]1−n0View Solution
