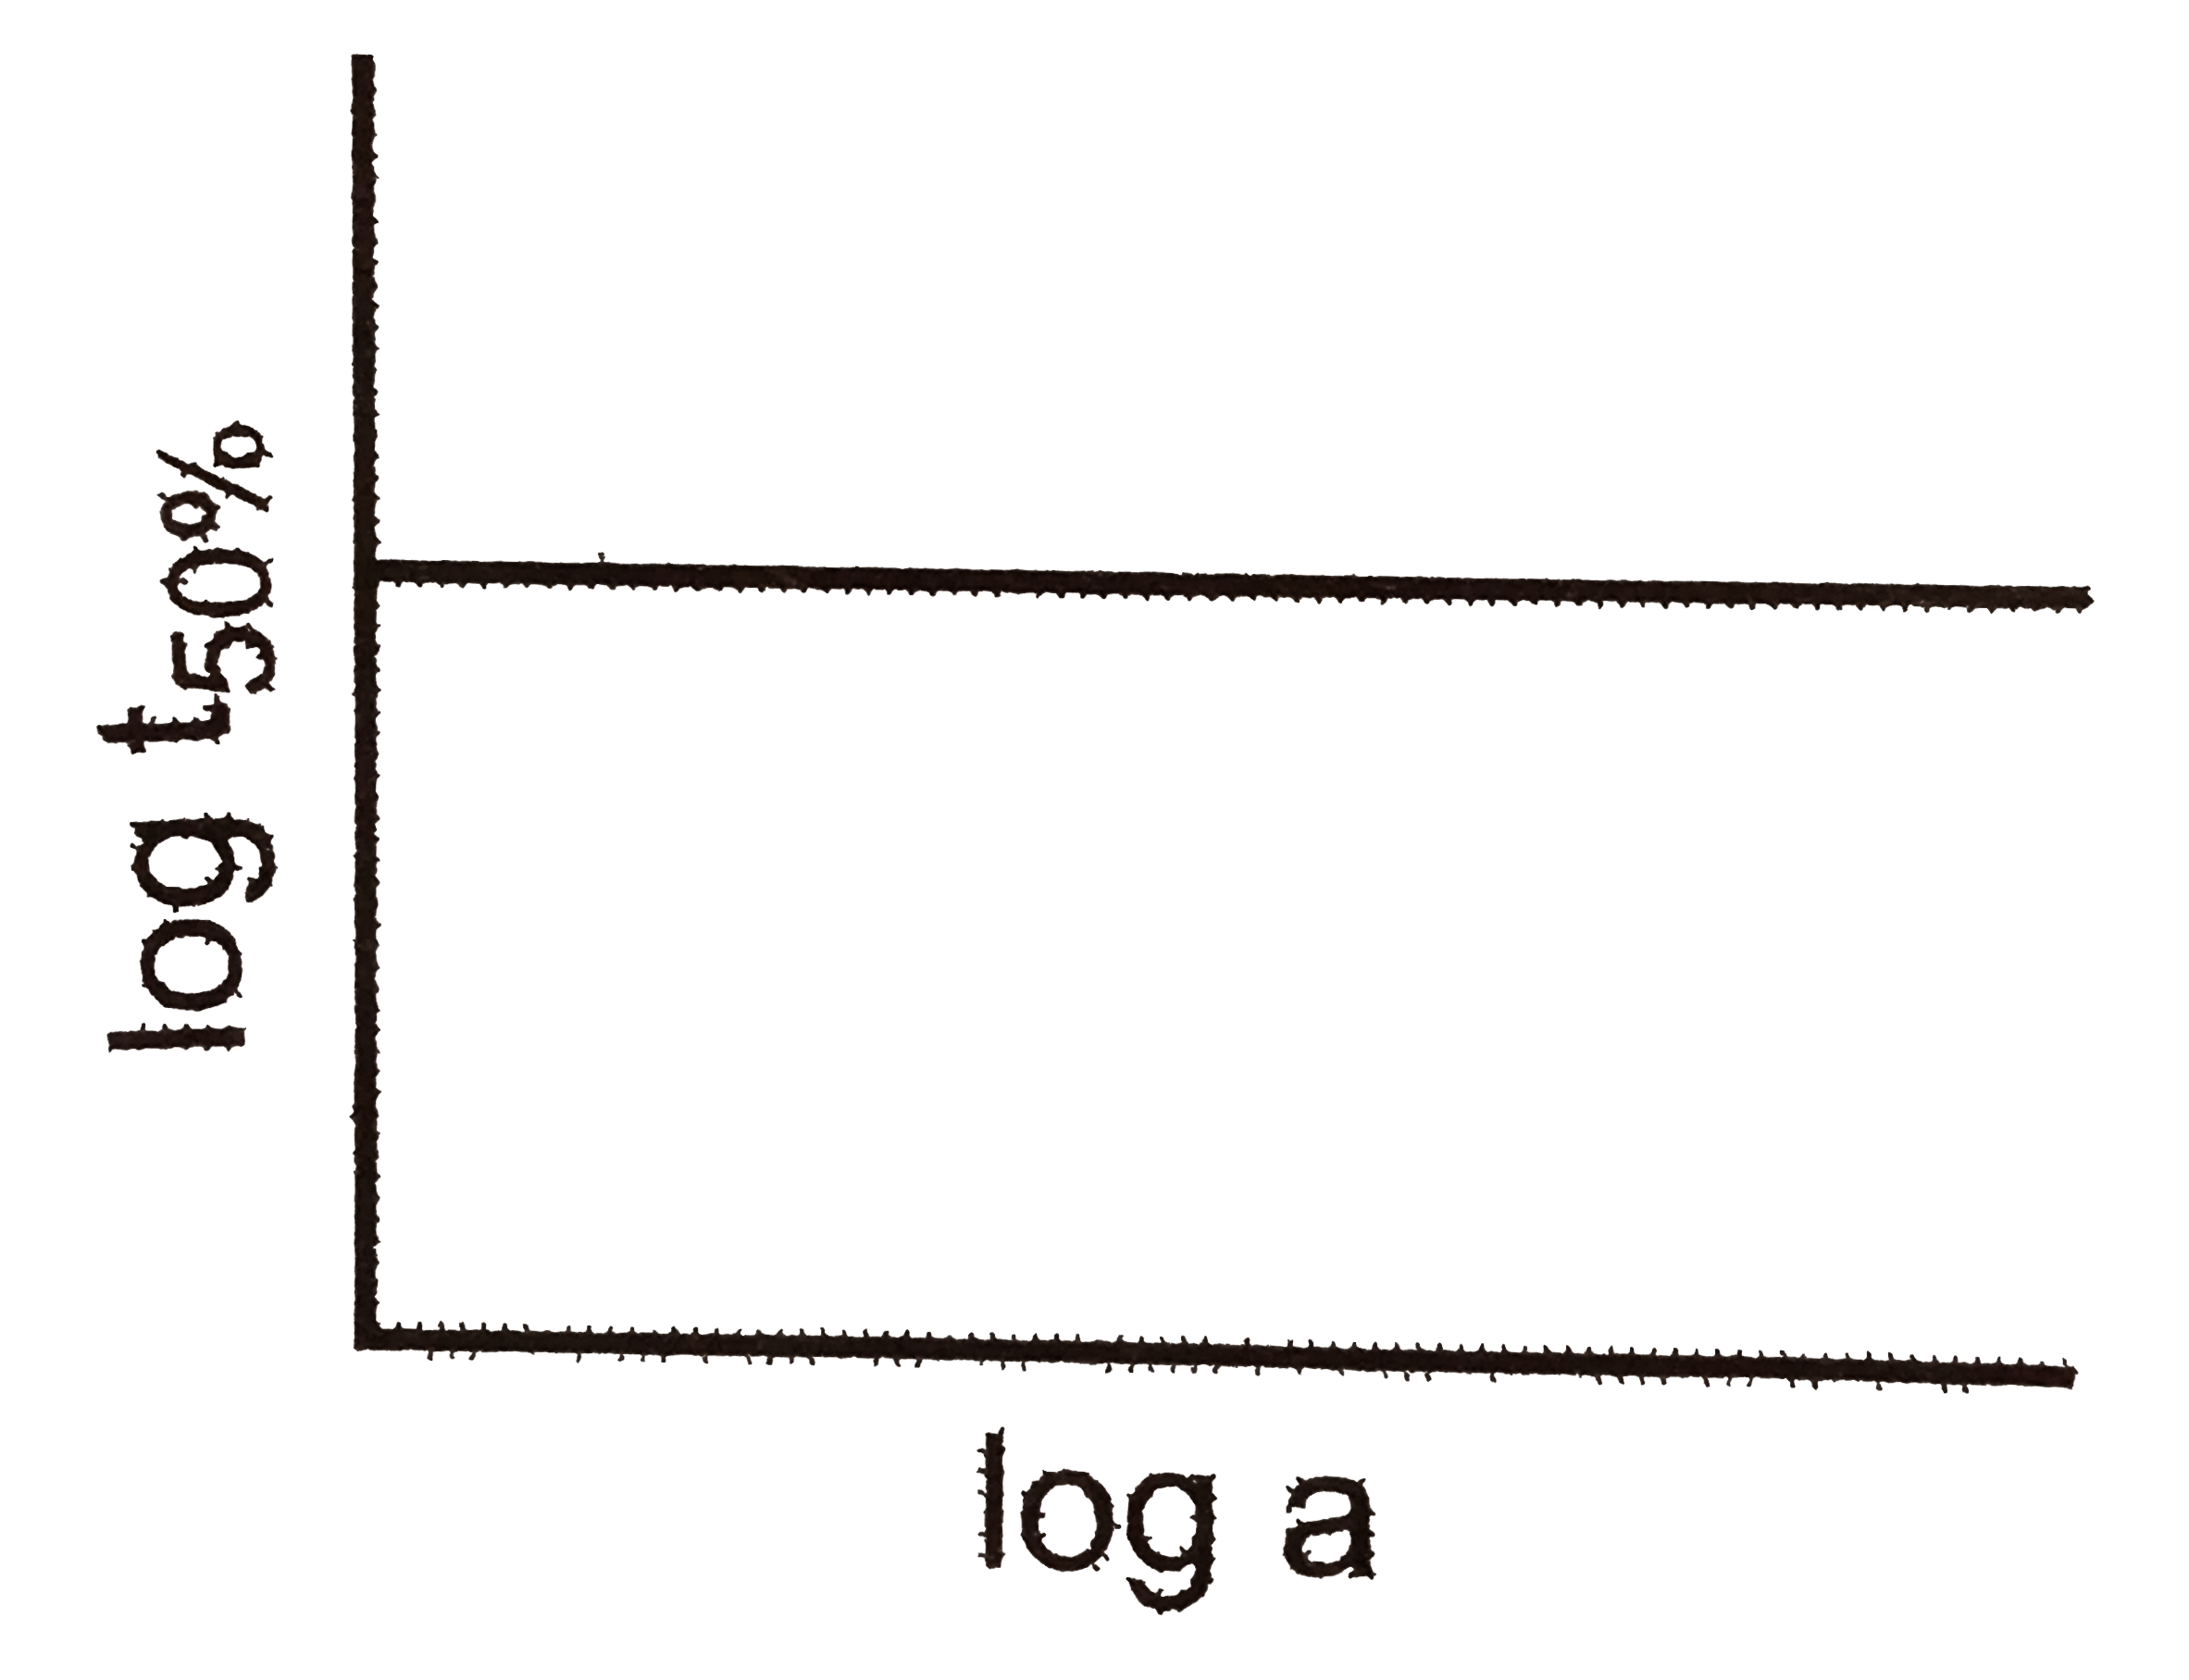
A graph plotted between log t50% vs log concentration is a straight line. What conclusion can you draw from this graph?
A
a=1:t1/2∝a
B
a=2,t1/2∝1/a
C
a=1:t1/2=(0.693/k)
D
None of these
Video Solution
Text Solution
The correct Answer is:C
AS t30% is constant, Hence order of reaction is 1.
t30%=0.693k
n=1,t1/2=0.693k
|
Updated on:21/07/2023
Topper's Solved these Questions
- BOOK - PHYSICS WALLAHCHAPTER - MOLECULARITY EXERCISE - NEET Past 5 Years Questions30videos
MOLECULARITY
- BOOK - PHYSICS WALLAHCHAPTER - MOLECULARITY EXERCISE - NEET Past 5 Years Questions30videos
MOLECULARITY
- BOOK - PHYSICS WALLAHCHAPTER - HYDROGENEXERCISE - LEVEL-258videos
HYDROGEN
- BOOK - PHYSICS WALLAHCHAPTER - ORGANIC CHEMISTRY EXERCISE - NEET PAST 5 YEARS QUESTIONS13videos
ORGANIC CHEMISTRY
Similar Questions
Knowledge Check
- Question 1 - Select One
A graph plotted between logt50% vs log concentration in a straight line. What conclusion can you draw from this graph?
 An= 1, t1/2=tx×aBn=2,t1/2=1aCn=1,t1/2=0.693kDnone of these
 - Question 2 - Select One
A graph plotted between log t50% vs log concentration is a straight line. What conclusion can you draw from this graph?
 An = 1 , t1/2=1KaBn = 2 , t1/2=1/aCn=1,t1/2=0.693KDNone of these
 - Question 3 - Select One
A graph plotted between log k vs 1T is represented by
A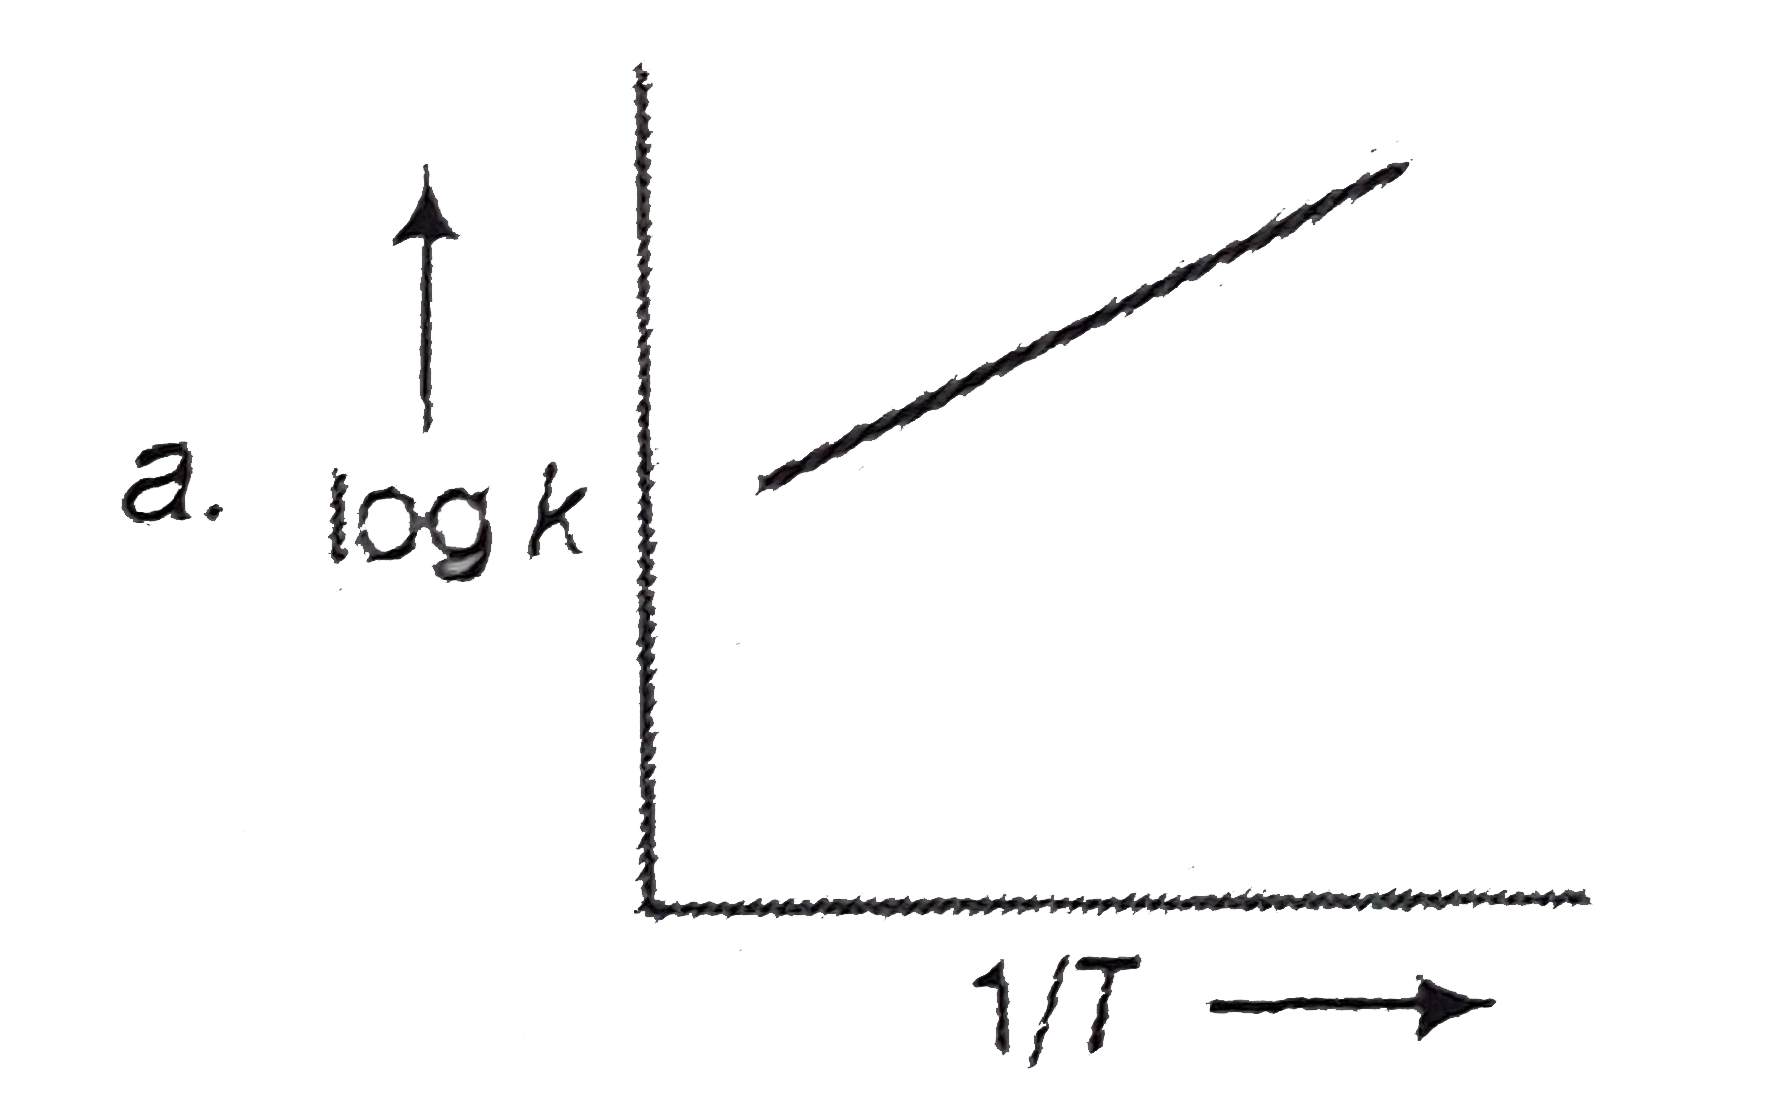 B
B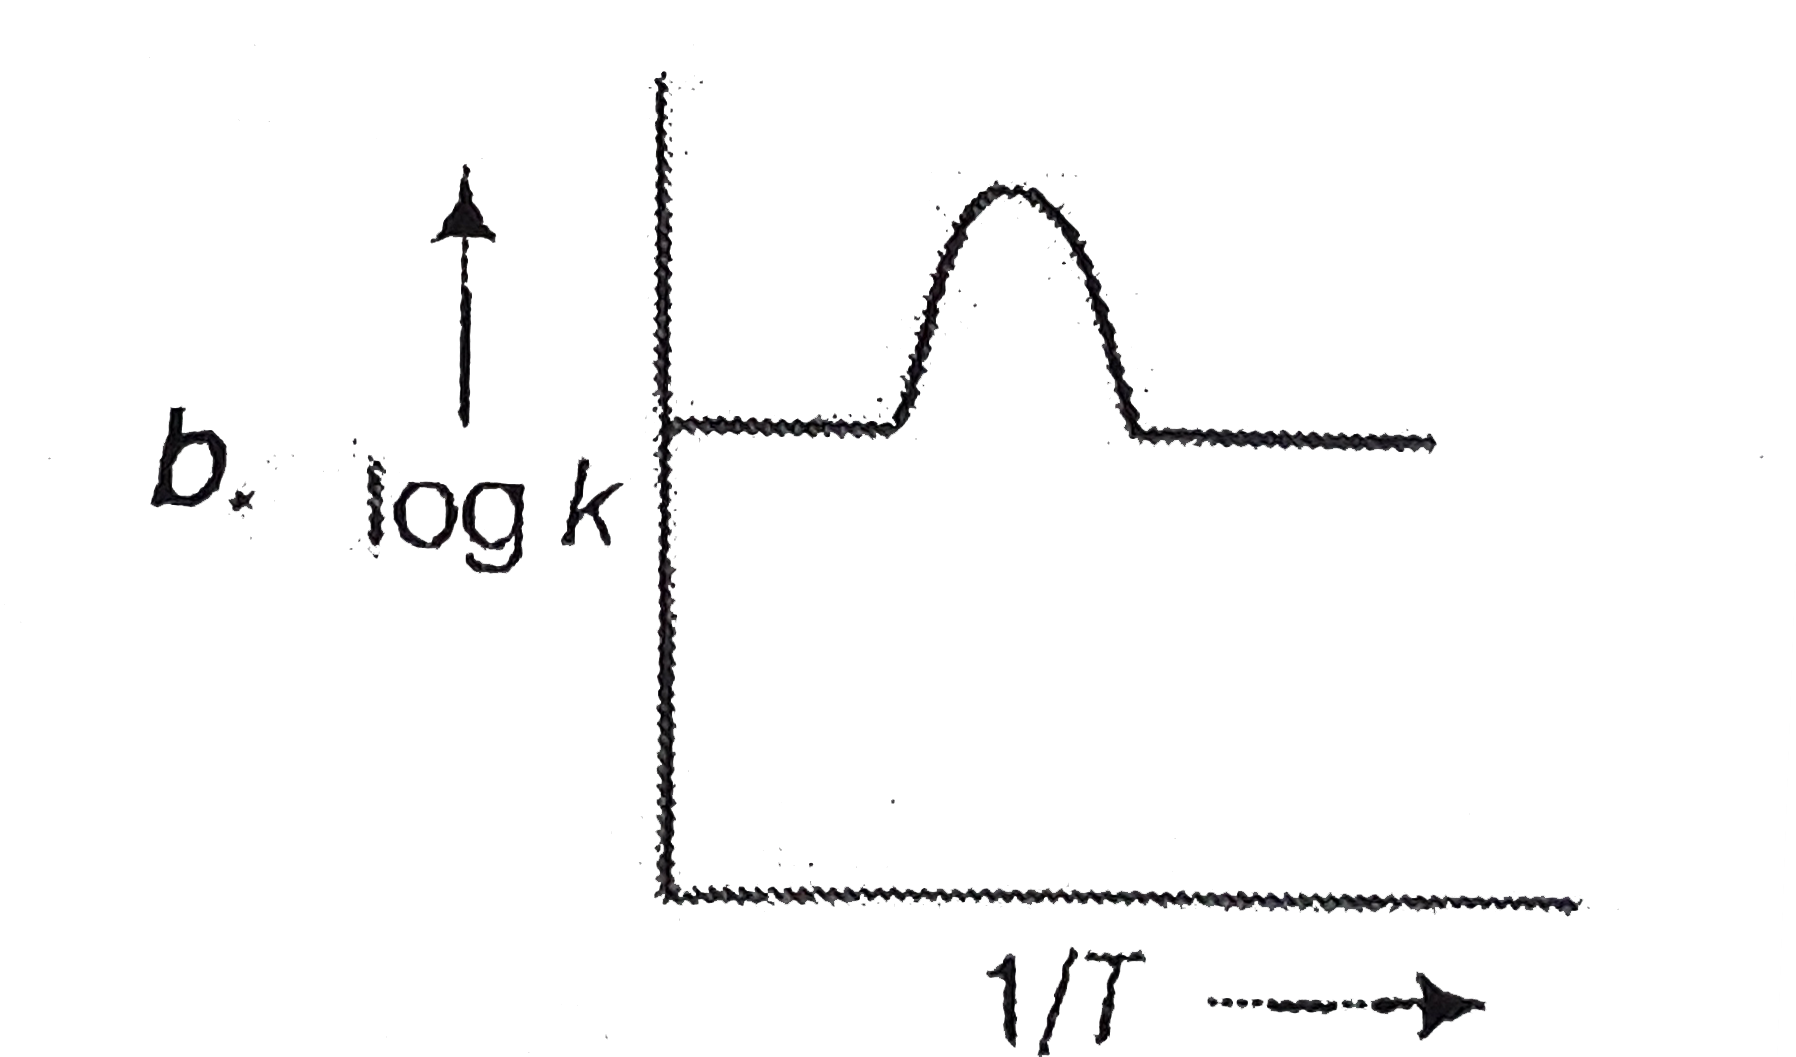 C
C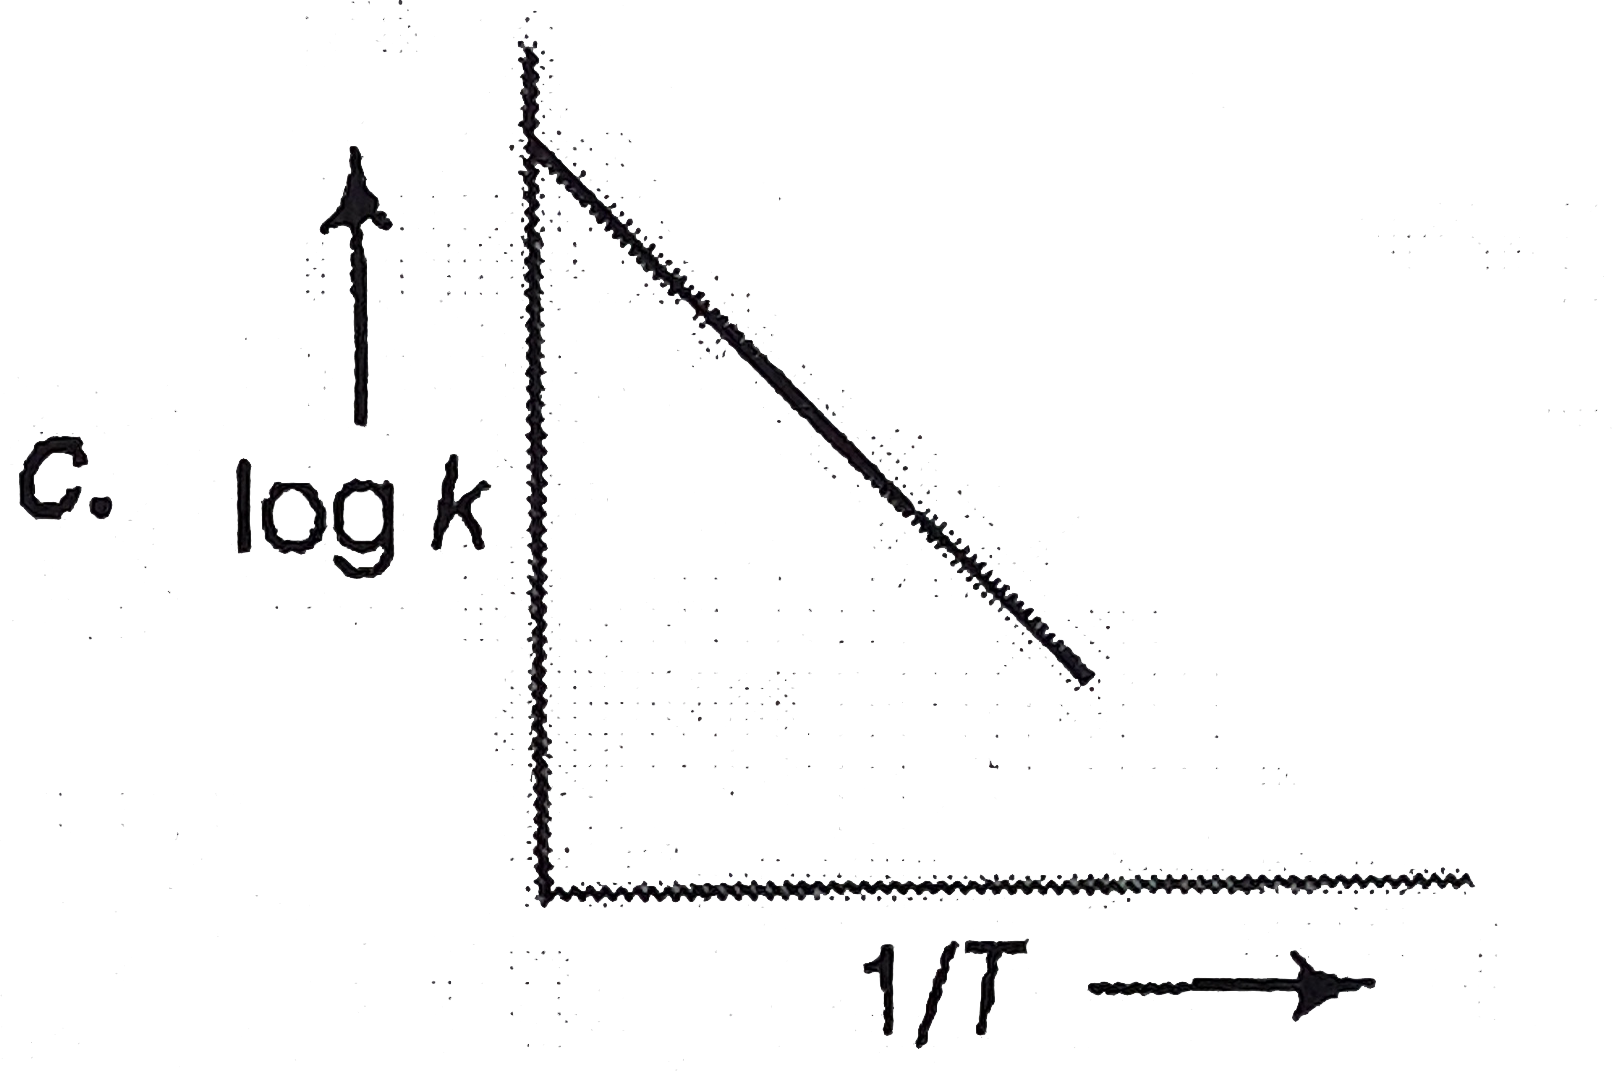 D
D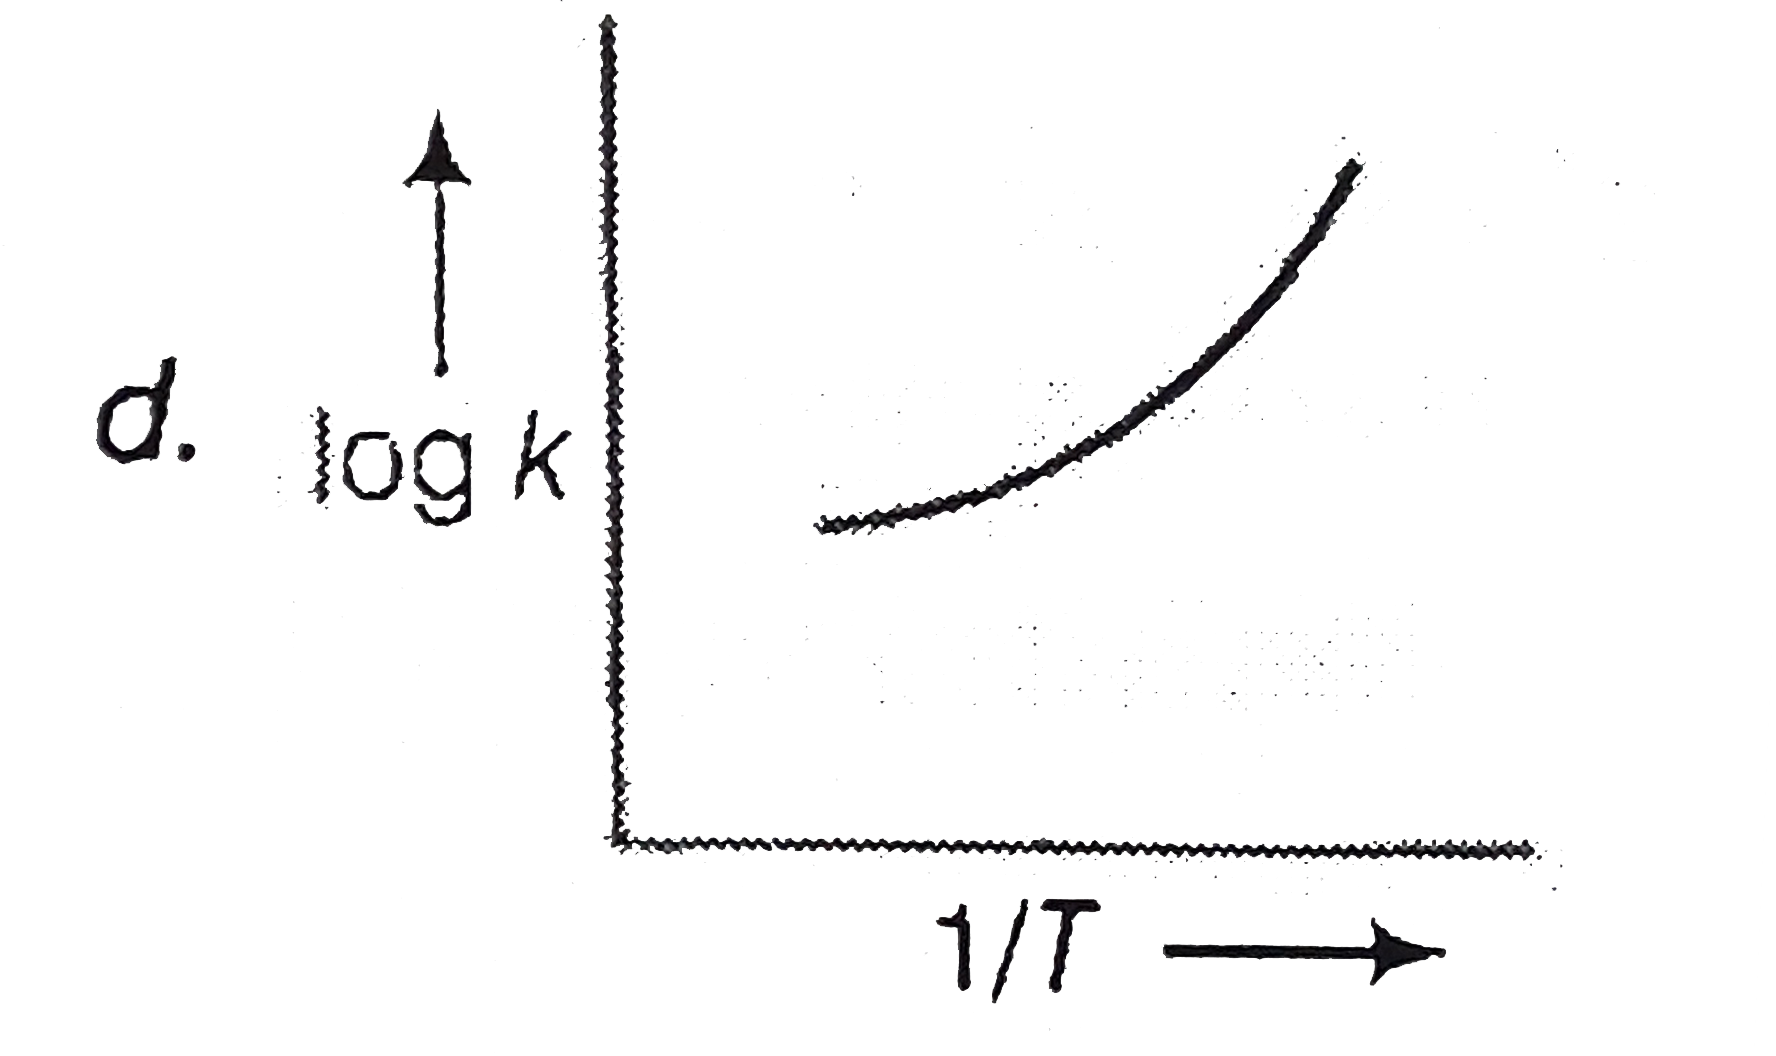
A graph plotted between logk versus 1/T for calculating activation energy is shown by
View SolutionA graph plotted between log N vs, time gives a slope and intercept equal to:
View SolutionA graph plotted between logk versus 1/T for calculating activation energy is shown by
View SolutionWhich conclusion can be drawn if a graph is plotted between log t50% vs. log [reactant] if it show an intercept 'A' and tanθ=0?
View SolutionA graph plotted between logk versus 1/T for calculating activation energy is shown by
View Solution

