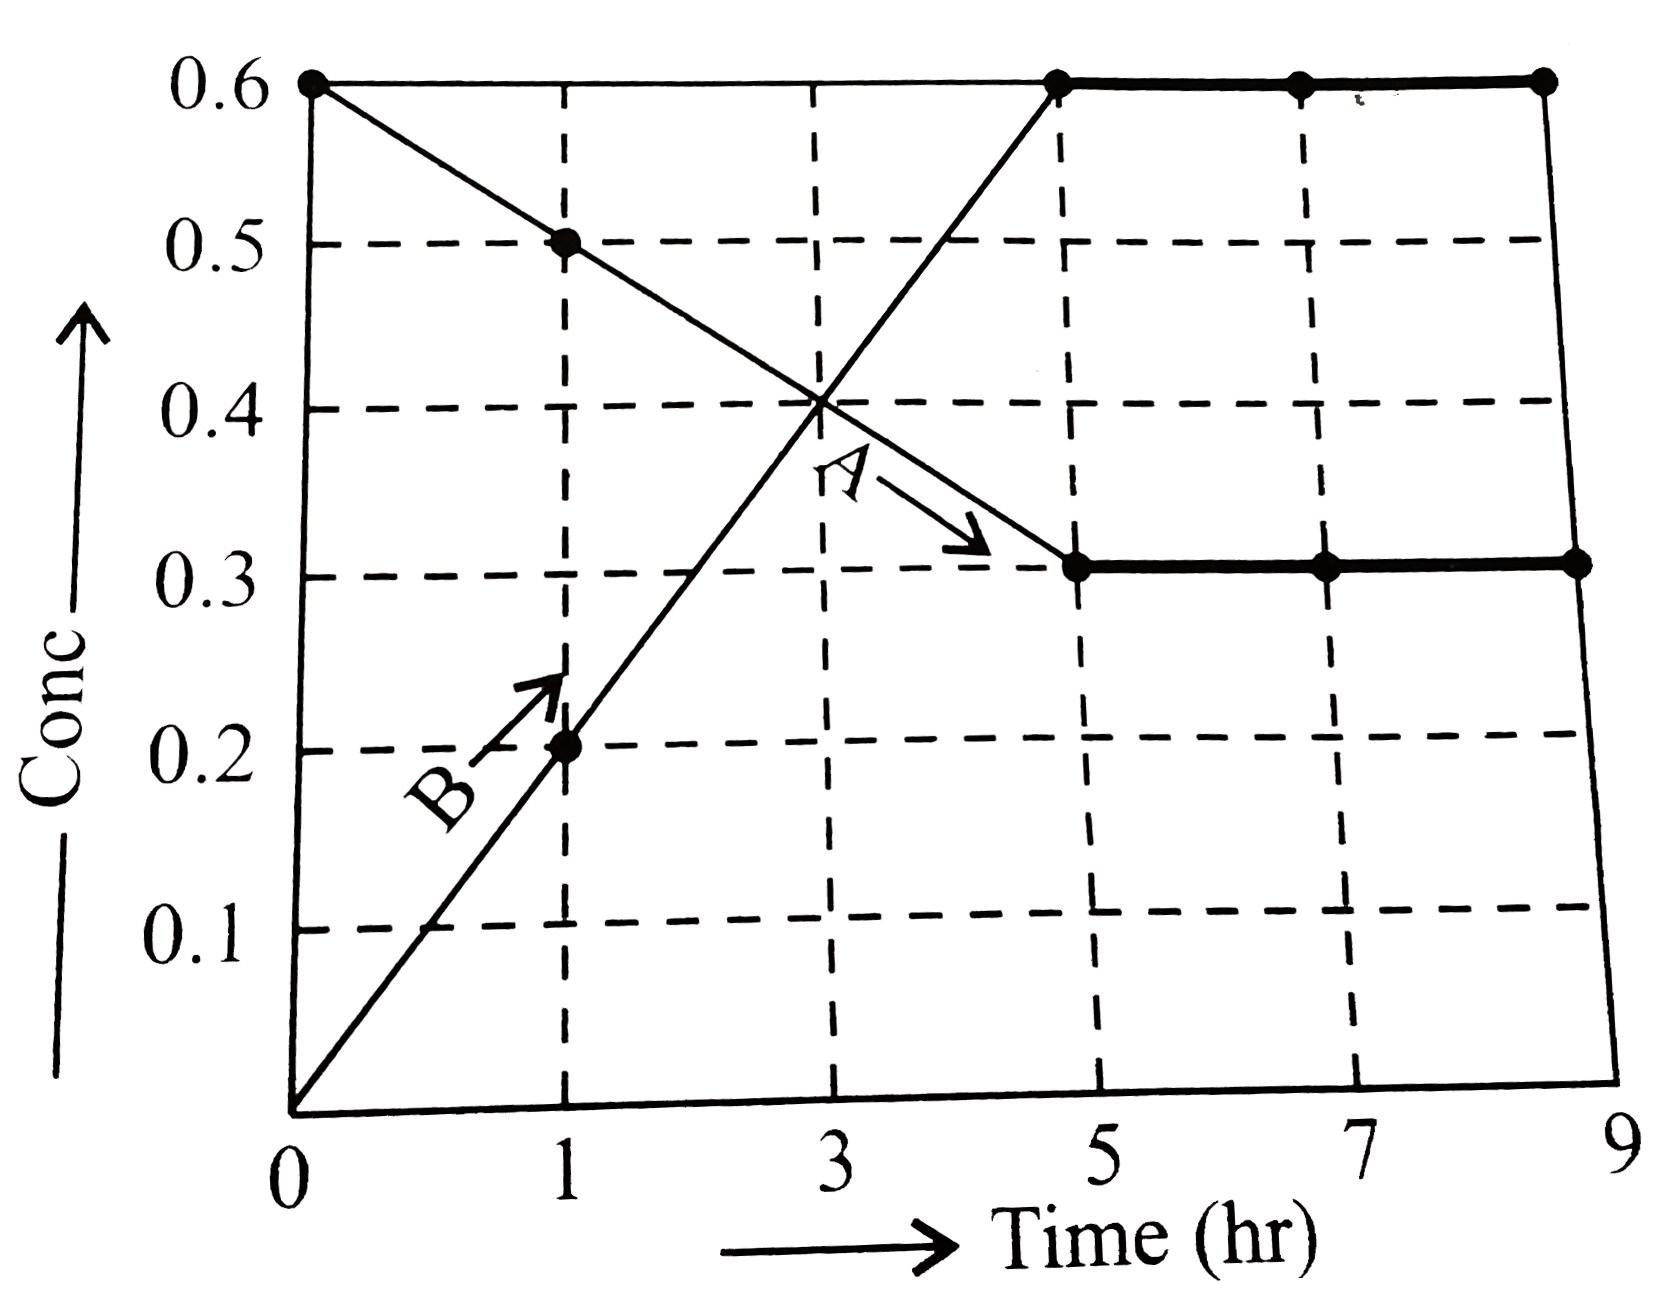
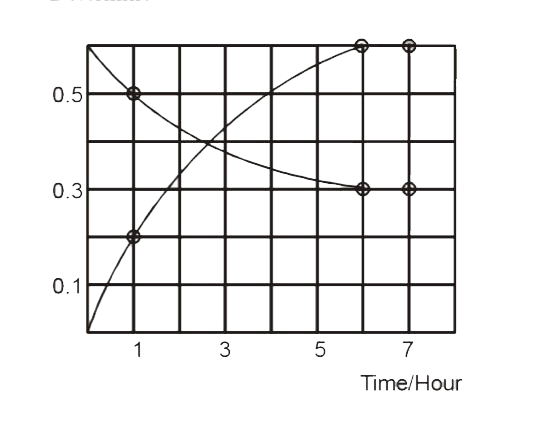
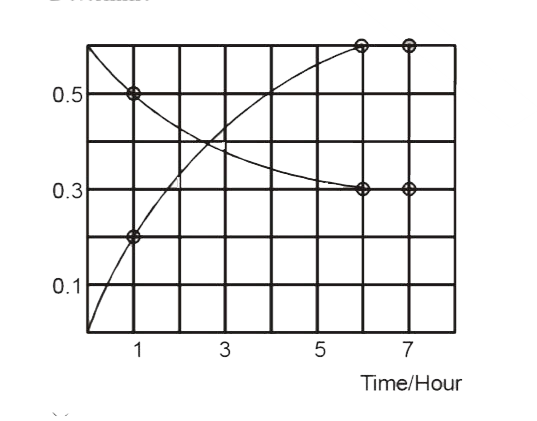
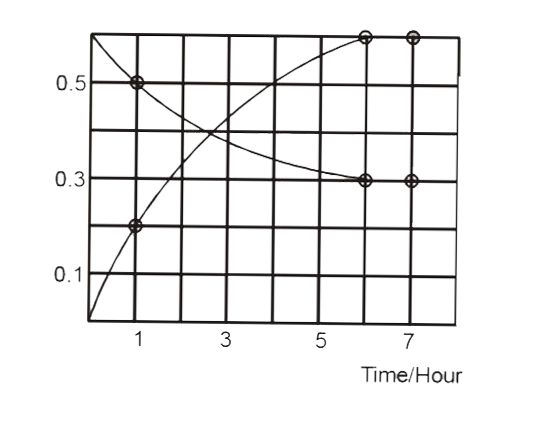
The progress of the reaction A⇔nB with time is represented in the Fig. below :

The value of n is
1
2
3
1.5
The correct Answer is:B
From time t = 1 hour to t = 5 hour, Δt=4 hr Decrease in conc. Of A=0⋅5−0⋅3=0⋅2molL−1.
Increase in conc. Of B=0⋅6−0⋅2=0⋅4molL−1.
Thus, in the same time interval, increase in conce of B is double then d3ecrease in the cone of A Hence, n = 2
Topper's Solved these Questions
- CHEMICAL KINETICSBook:PRADEEPChapter:CHEMICAL KINETICSExercise:COMPETITION FOCUS (IV. Matching Type Questions)
Explore 1 Video
- CHEMICAL KINETICSBook:PRADEEPChapter:CHEMICAL KINETICSExercise:COMPETITION FOCUS (JEE(Main and Advanced)/Medical Entrance) (IV. Matching Type Questions)
Explore 2 Videos
- CHEMICAL KINETICSBook:PRADEEPChapter:CHEMICAL KINETICSExercise:COMPETITION FOCUS (JEE(Main and Advanced)/Medical Entrance) (I. Multiple Choice Questions) With one or more than one correct answers
Explore 7 Videos
- BIOMOLECULES Book:PRADEEPChapter:BIOMOLECULES Exercise:IMPORTANT QUESTIONS (FOR BOARD EXAMINATION)
Explore 25 Videos
- CHEMISTRY IN EVERYDAY LIFE Book:PRADEEPChapter:CHEMISTRY IN EVERYDAY LIFE Exercise:IMPORTANT QUESTION FOR BOARD EXAMINATION
Explore 30 Videos
Similar Questions
The progress of the reaction A⇔nB , with time is presented in the figure. Determine (i) the value of n (ii) the equilibrium constant K (iii) the initial rate of conversion of A
View SolutionThe progress of the reaction A⇔nB, with times is presented in the figure below.
Determine:
(a) The value of n , (b) Keq
( c) Initial rate of converison of A
View Solution
Knowledge Check
The process of the reaction A⇔nB with time is represented in the fig, given below
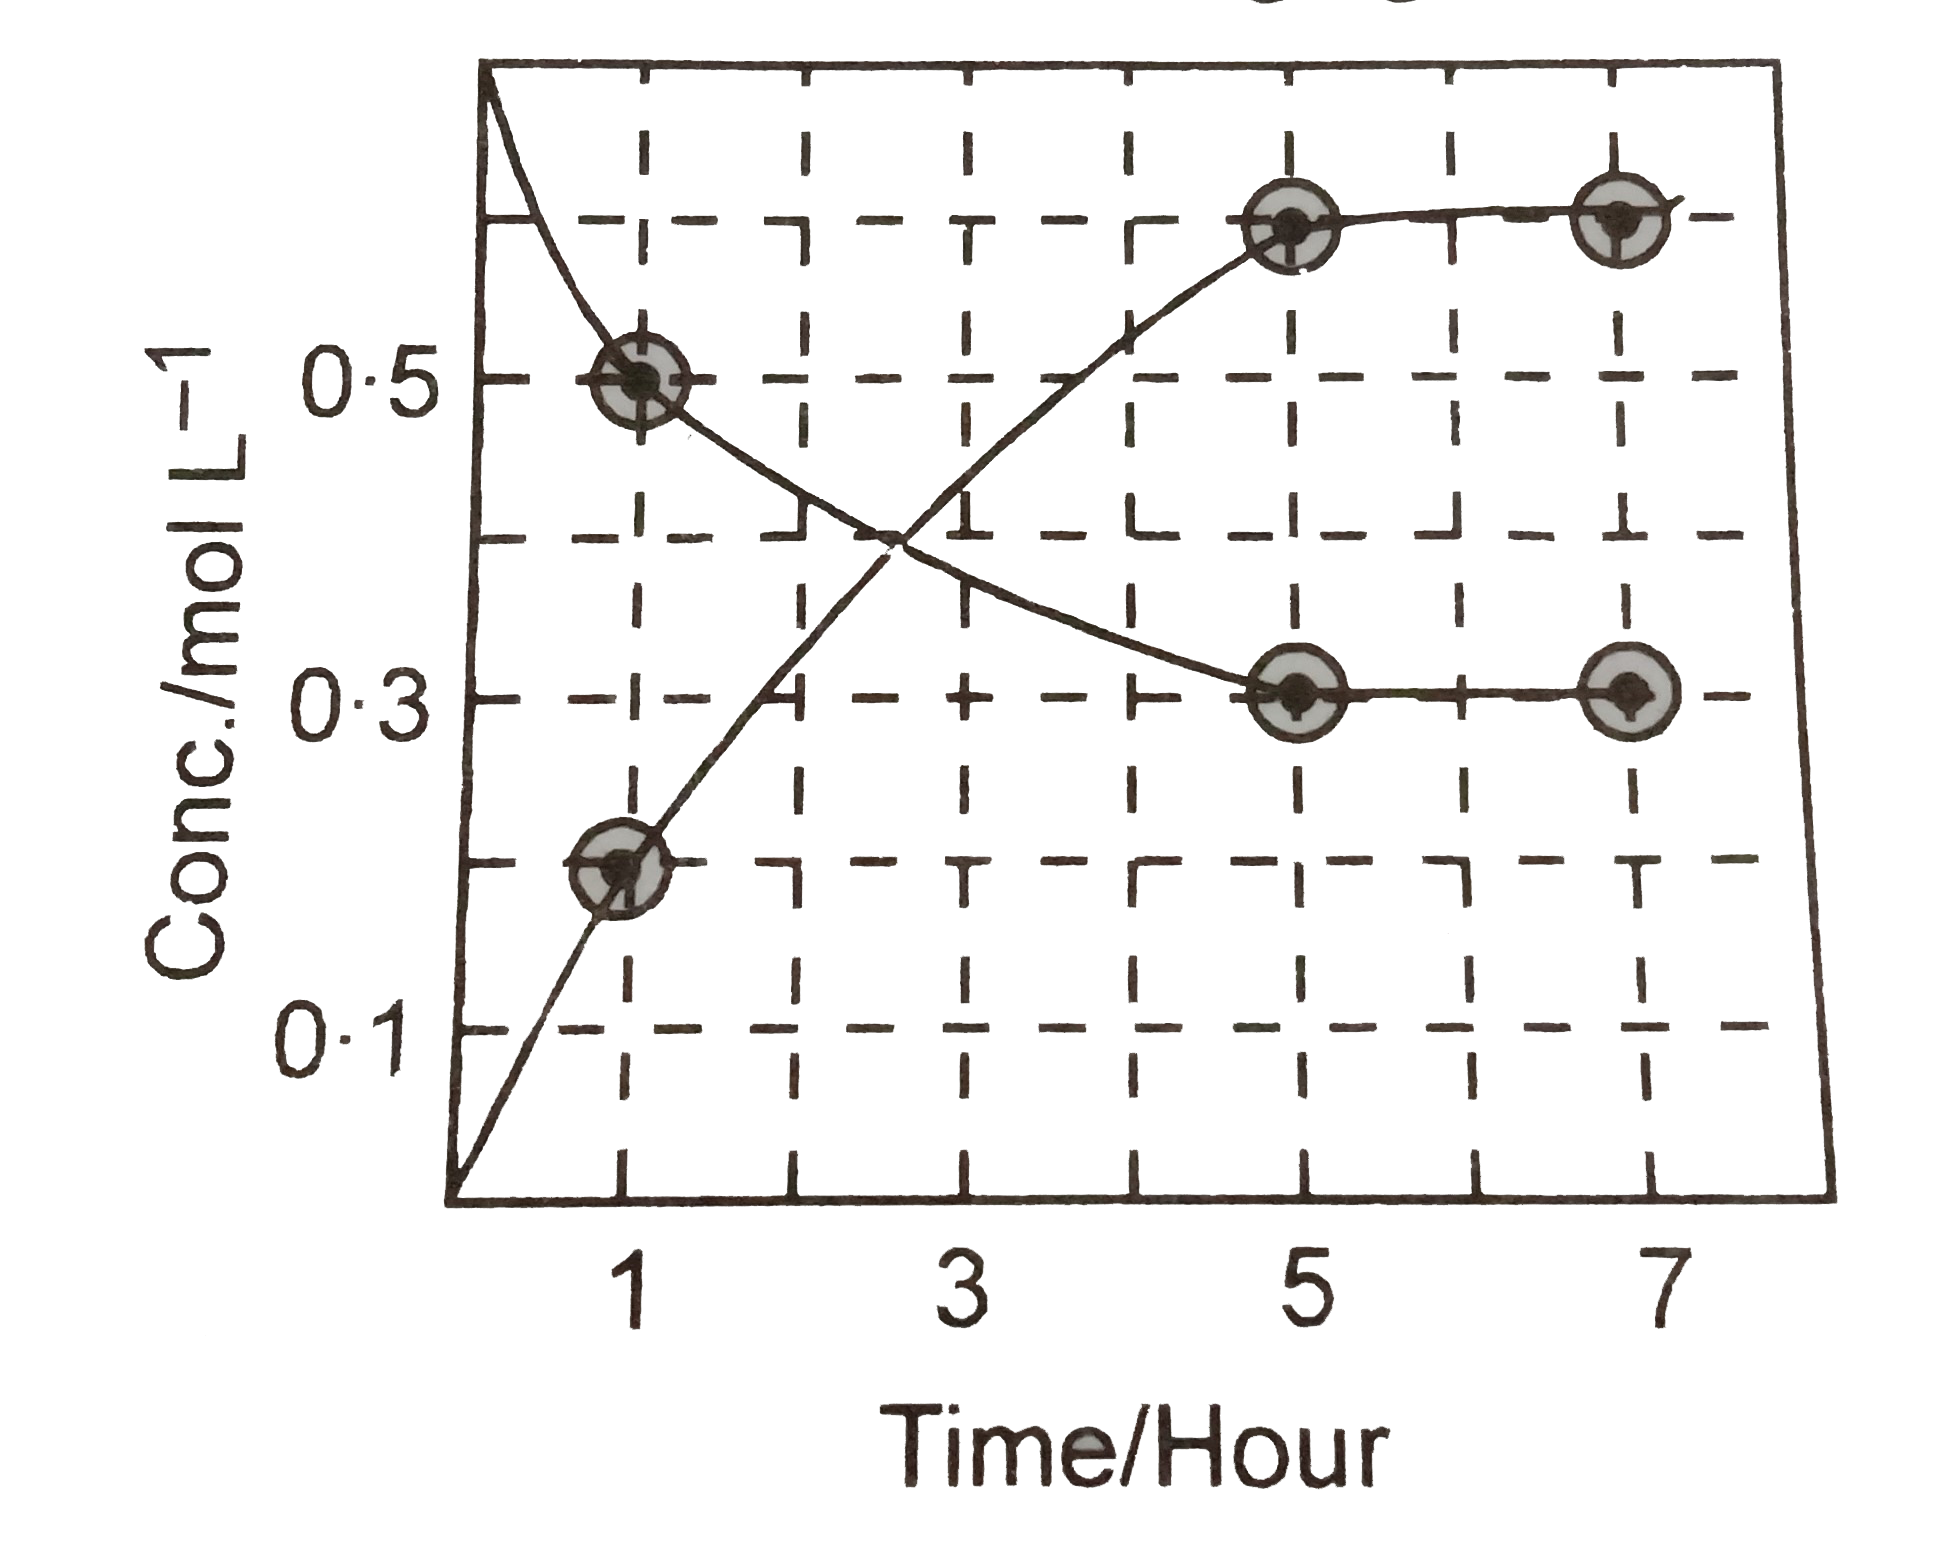
The value of n isA1B2C3D1.5
The progress of the reaction A⇔nB with time is persented in the figure given below:
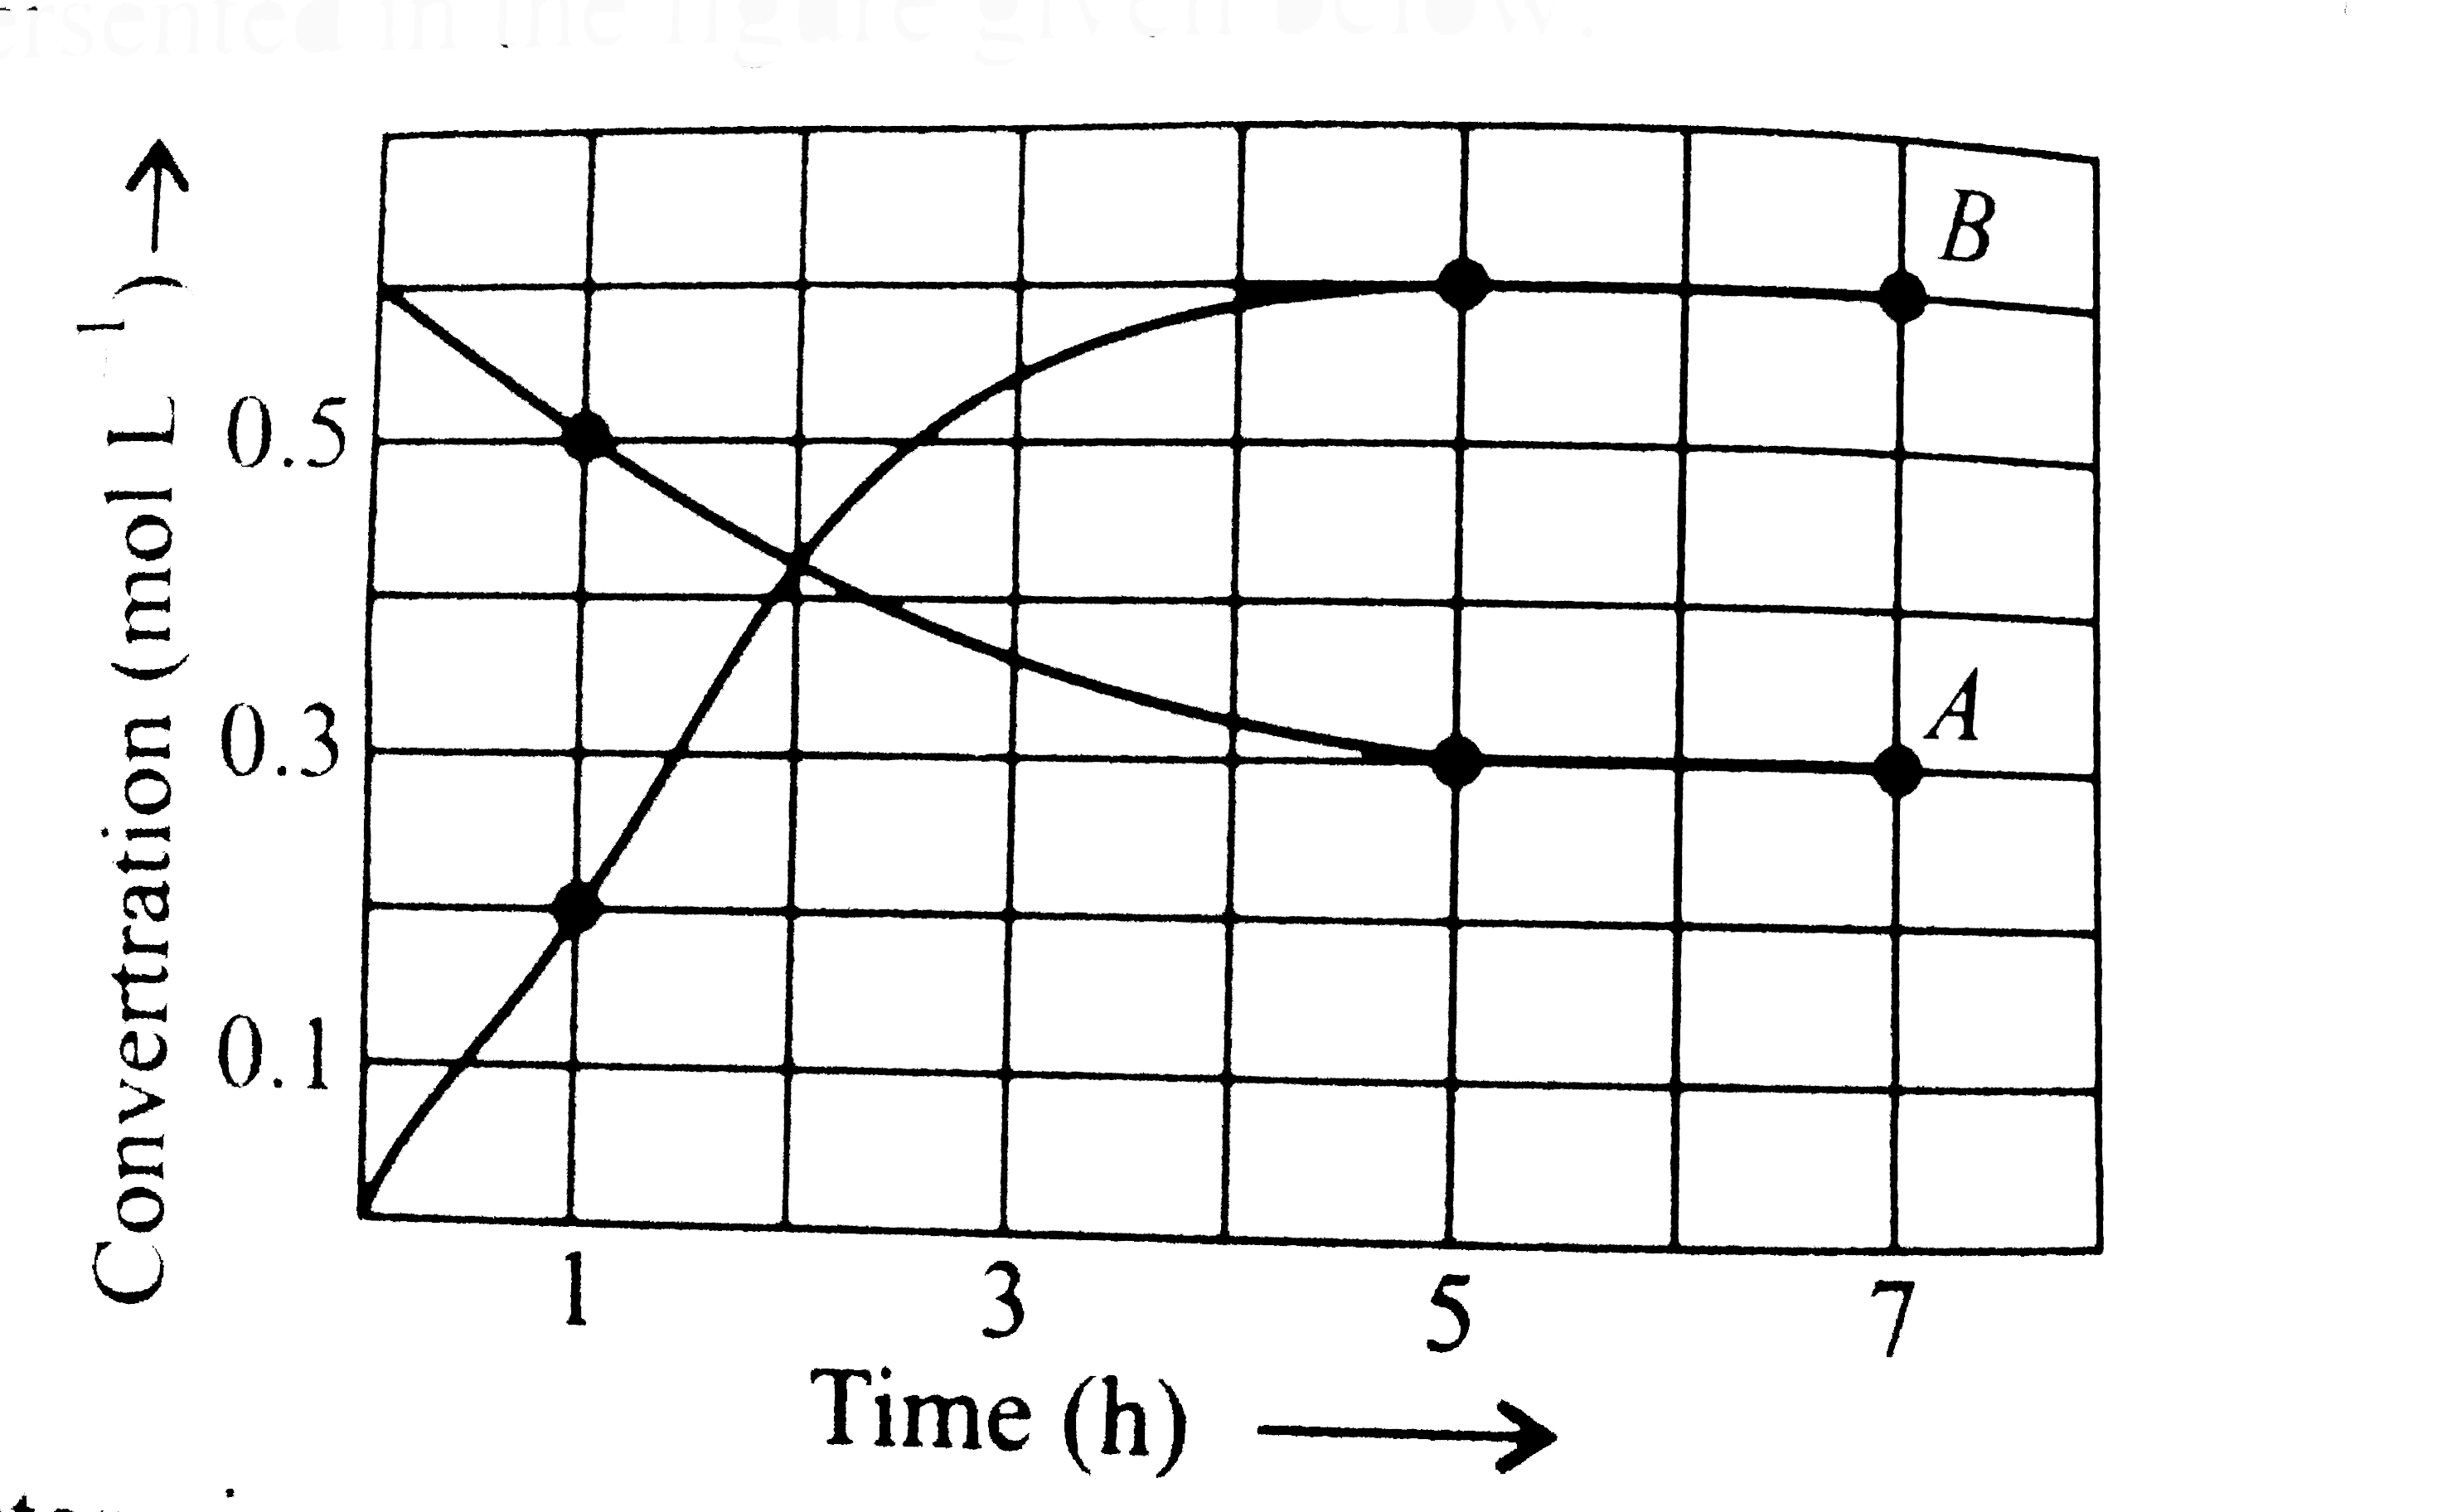
Determine
a. The value of n.
b. The equilibrium constant K.
c. The initial rate of concentration of A.
View SolutionThe progress of the reaction A⇔nB with time is persented in the figure given below:

Determine
a. The value of n.
b. The equilibrium constant K.
c. The initial rate of concentration of A.
View SolutionThe progress of the reaction, A ⇌ nB with time, is presented in figure given below. Determine.
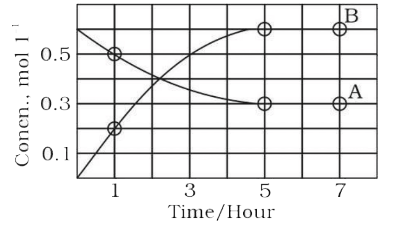
(i) The value of n,
(ii) The equilibrium constant K, and
(iii) the initial rate of conversion of A.
View SolutionThe progress of the reaction, A ⇌ nB with time, is presented in figure given below. Determine.

(i) The value of n,
(ii) The equilibrium constant K, and
(iii) the initial rate of conversion of A.
View SolutionThe progress of the reaction A⇔nB with time, is presented in figure. Determine
the value of n.
View SolutionThe progress of the reaction A⇔nB with time, is presented in figure. Determine
the initial rate of conversion of A.
View SolutionThe progress of the reaction A⇔nB with time, is presented in figure. Determine
the equilibrium constant K.
View Solution
