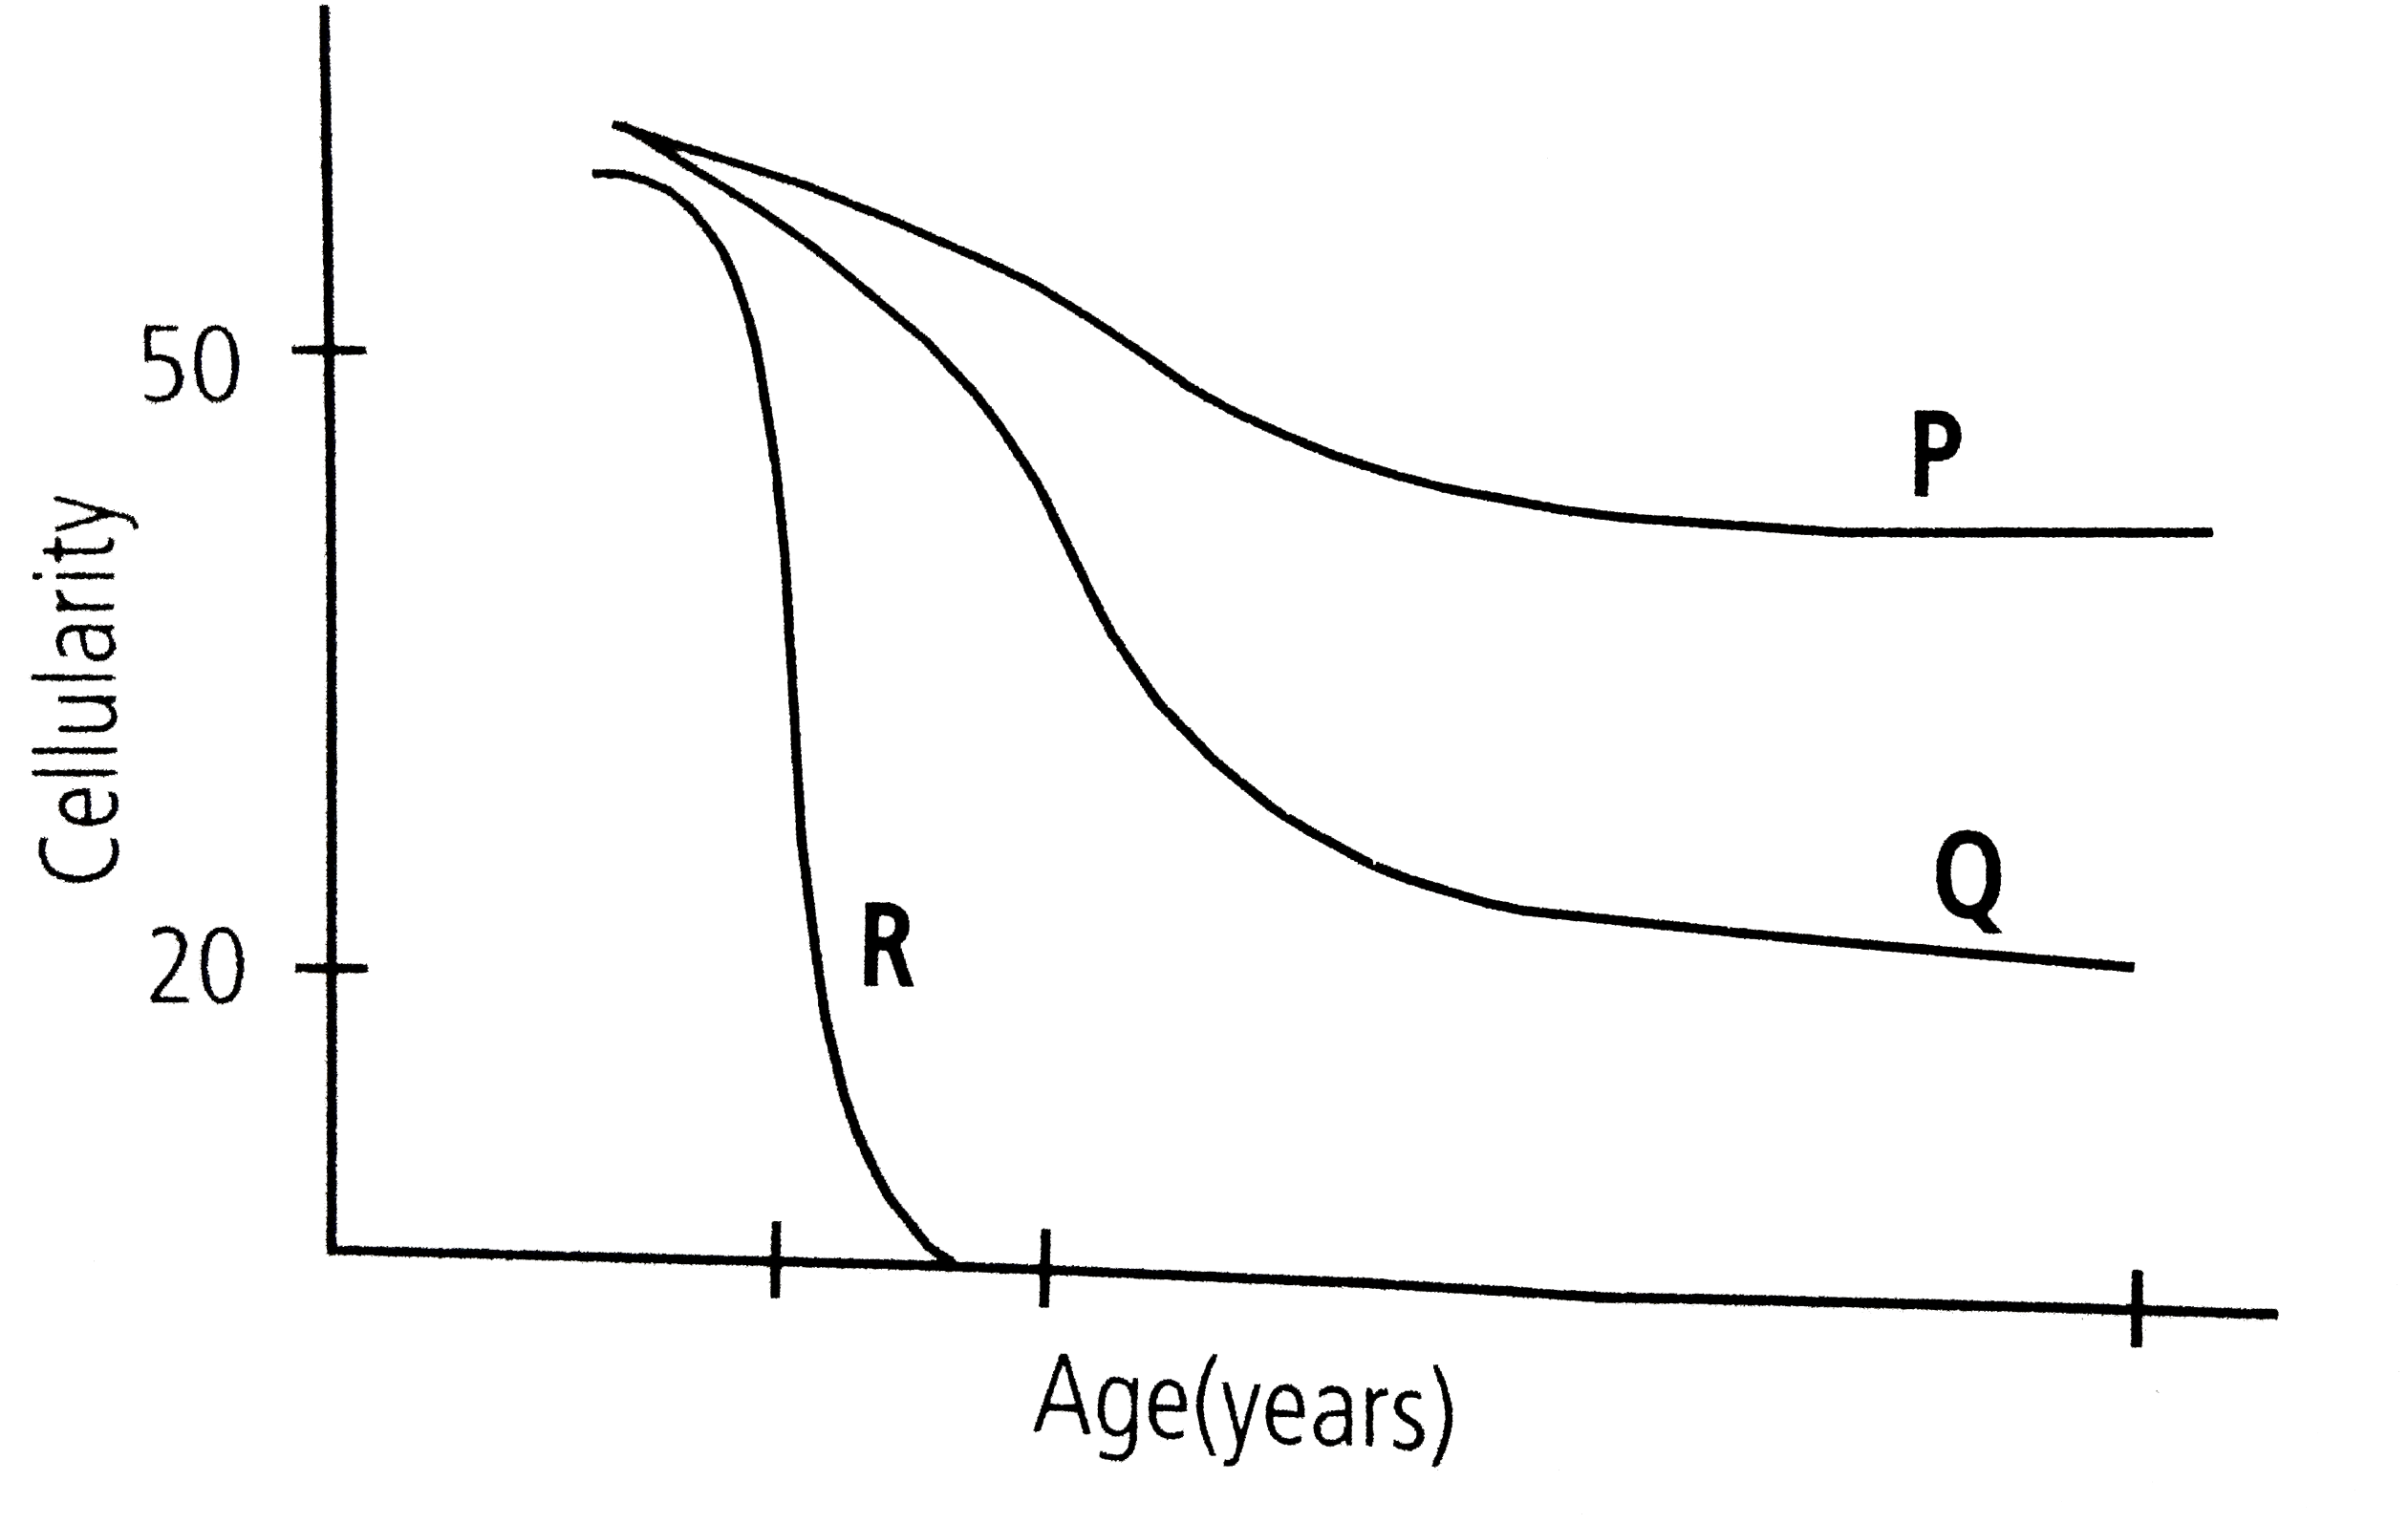
Relative rates of red blood cell production in the bone marrow of different bones at different ages are shown in the graph P,Q and R are likely to be, respectively

vertebra, rib and tibia
femur, carpal and rib
tibia, fibula and femur
radius, sternum and carpal
The correct Answer is:A
Step by step video, text & image solution for Relative rates of red blood cell production in the bone marrow of different bones at different ages are shown in the graph P,Q and R are likely to be, respectively by Biology experts to help you in doubts & scoring excellent marks in Class 11 exams.
Topper's Solved these Questions
- BOOK - NCERT FINGERTIPSCHAPTER - TEST PAPEREXERCISE - Test Paper 250videos
TEST PAPER
- BOOK - NCERT FINGERTIPSCHAPTER - TEST PAPEREXERCISE - Test Paper 350videos
TEST PAPER
- BOOK - NCERT FINGERTIPSCHAPTER - STRUCTURAL ORGANISATION IN ANIMALSEXERCISE - Structural Organisation In Animals129videos
STRUCTURAL ORGANISATION IN ANIMALS
- BOOK - NCERT FINGERTIPSCHAPTER - THE LIVING WORLDEXERCISE - The Living World130videos
THE LIVING WORLD
Similar Questions
The bar graph given below shows the data of the production of paper (in lakh tonnes) by three different companies P, Q and R over the years.
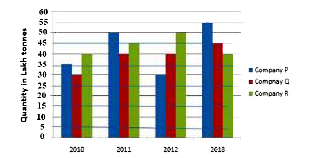
What is the percentage increase in the productionby company Q from 2010 to 2013?View Solution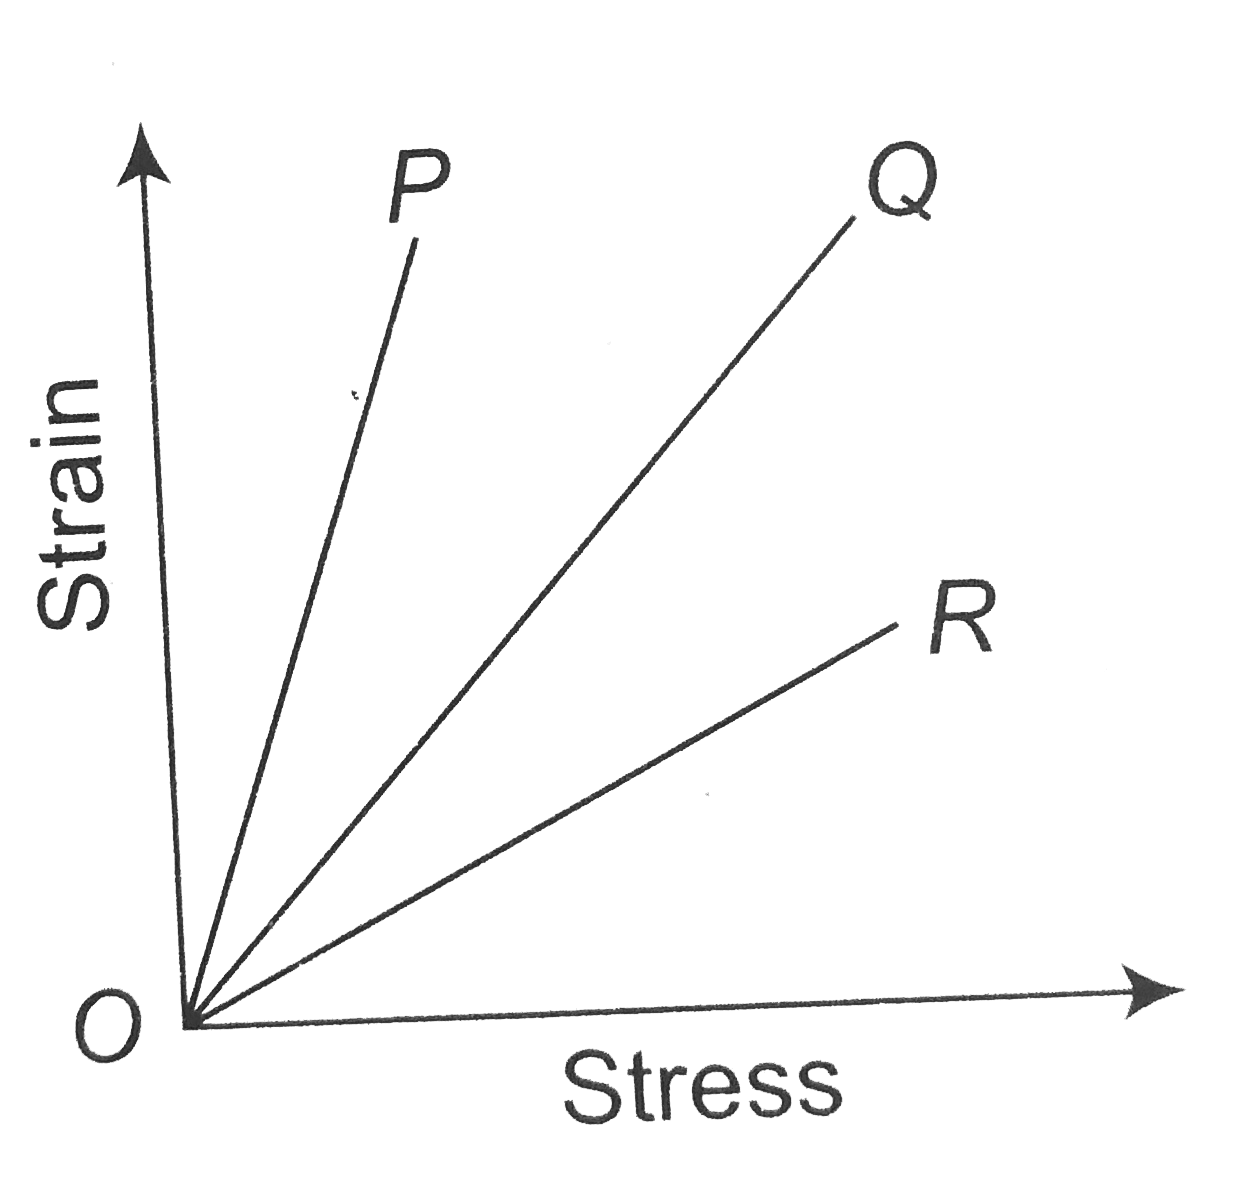
The strain stress curves of three wires of different materials are shown in the figure. P, Q and R are the elastic limits of the wires. The figure shown thatView Solution
Knowledge Check
- Question 1 - Select One
Blood cells are produced by Bone marrow in :−
AAll bonesBSome bonesCMost of the bonesDNone - Question 2 - Select One
Process by which blood cells are formed in bone marrow :−
AHaemopoiesisBHaemolysisCThrombopoesisDErythroblastosis - Question 3 - Select One
Blood cells are fonried in bone marrow. This process is known as
AhaemolysisBerythrobiastosisChaemopoiesisDNone of these
The strain-stress curves of three wire of different materials are shown in the figure. P,Q and R are the elastic limits of the wires. The figures shows that
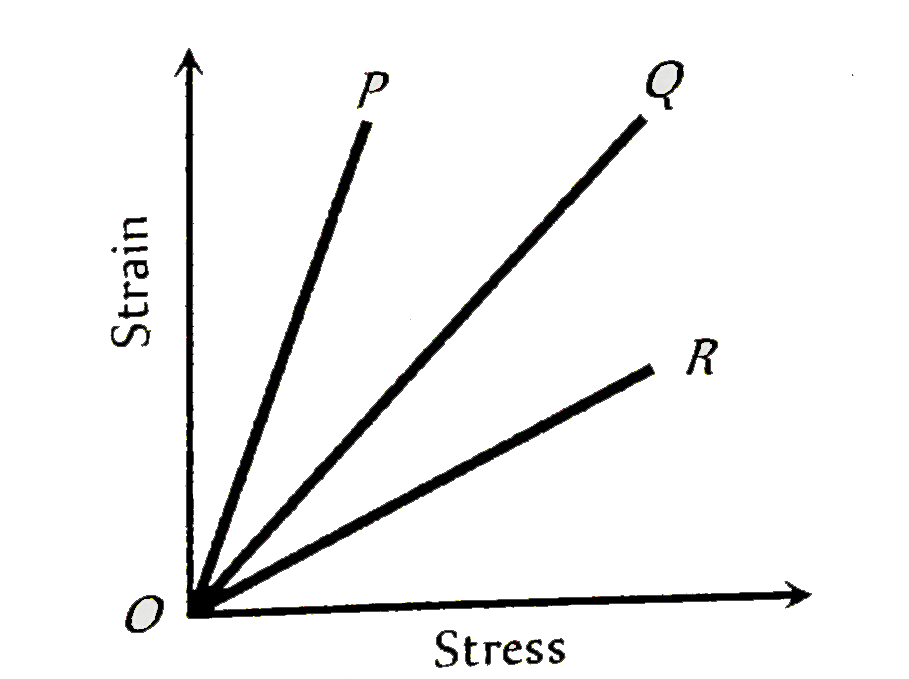 View Solution
The strain-stress curves of three wires of different materials ar shown in the figure P,Q and R are the elastic limits of the wires. The figure shows that :
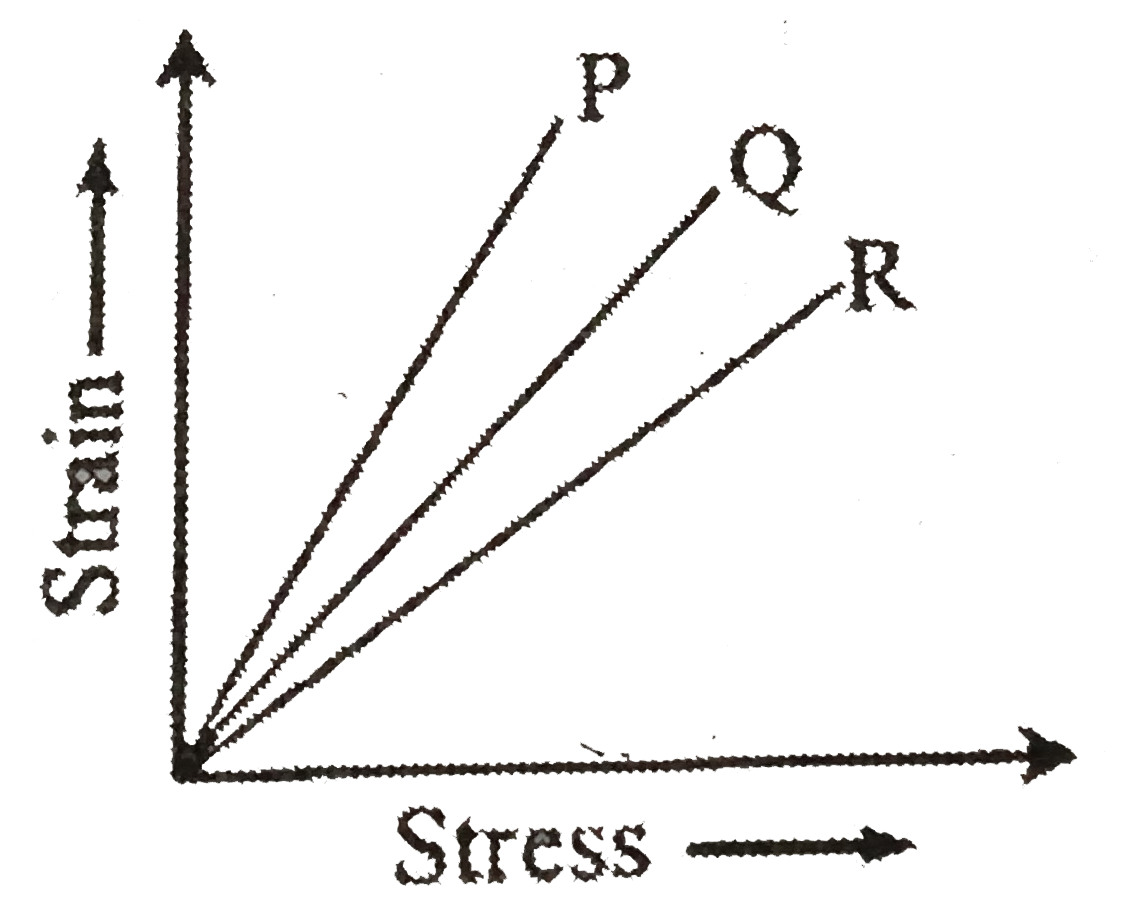 View Solution
Characteristic features of different blood vessels in the body are shown. What does P,Q and R represent ?
 View Solution
Identify P,Q, and R in the graph shown below
 View Solution
The inputs and outputs for different time intervals are given below for NAND gate
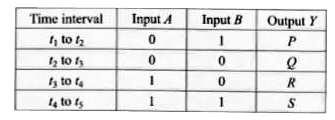
The value taken by P, Q, R, S are respectivelyView Solution

