A piece of cork starts from rest at the bottom of a lake and floats up. Its velocity v is plotted against time t. Which of the following best represents the resulting curve?
_S01_061_Q01.png)
_E01_108_O01.png)
_E01_108_O02.png)
_E01_108_O03.png)
_E01_108_O04.png)
The correct Answer is:A
Step by step video, text & image solution for A piece of cork starts from rest at the bottom of a lake and floats up. Its velocity v is plotted against time t. Which of the following best represents the resulting curve? by Physics experts to help you in doubts & scoring excellent marks in Class 11 exams.
Topper's Solved these Questions
- BOOK - ALLENCHAPTER - ELASTICITY, SURFACE TENSION AND FLUID MECHANICSEXERCISE - Exercise 3 (Assertion & Reason)32videos
ELASTICITY, SURFACE TENSION AND FLUID MECHANICS
- BOOK - ALLENCHAPTER - ELASTICITY, SURFACE TENSION AND FLUID MECHANICSEXERCISE - Exercise 3 (Comprehension based questions)24videos
ELASTICITY, SURFACE TENSION AND FLUID MECHANICS
- BOOK - ALLENCHAPTER - ELASTICITY, SURFACE TENSION AND FLUID MECHANICSEXERCISE - Exercise 1 (Fluid Statics)40videos
ELASTICITY, SURFACE TENSION AND FLUID MECHANICS
- BOOK - ALLENCHAPTER - CENTRE OF MASSEXERCISE - EXERCISE-V B19videos
CENTRE OF MASS
- BOOK - ALLENCHAPTER - ERROR AND MEASUREMENTEXERCISE - Part-2(Exercise-2)(B)22videos
ERROR AND MEASUREMENT
Similar Questions
A ray of light travels from a medium of refractive index μ to air. Its angle of incidence in the medium is i, measured from the normal to the boundary , and its angle of deviation is δ.δ is plotted against i. Which of the following best represents the resulting curve ?
View SolutionA long bar magnet moves with constant velocity along the axis of a fixed metal ring. It stars form a large distance from the ring, passes through the ring and then moves away far from the ring. The current i flowing in the ring is plotted against time t. Which of the following best represents the resulting curve?
View Solution
Knowledge Check
- Question 1 - Select One
The rate of decay (R) of nuclei in a radioactive sample is plotted against time (t). Which of the following best represents the resulting curve ?
A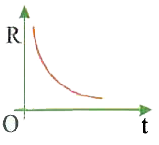 B
B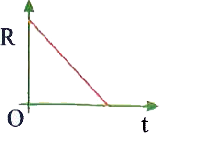 C
C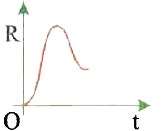 D
D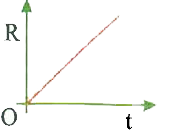
- Question 2 - Select One
The rate of decay (R) of nuclei in a radioactive sample is plotted against time (t). Which of the following best represents the resulting curve ?
A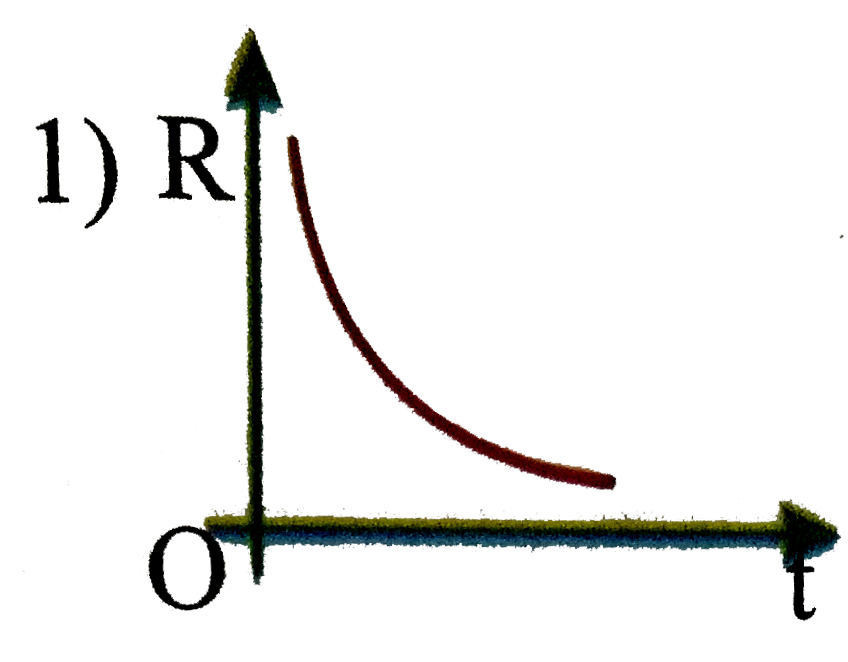 B
B C
C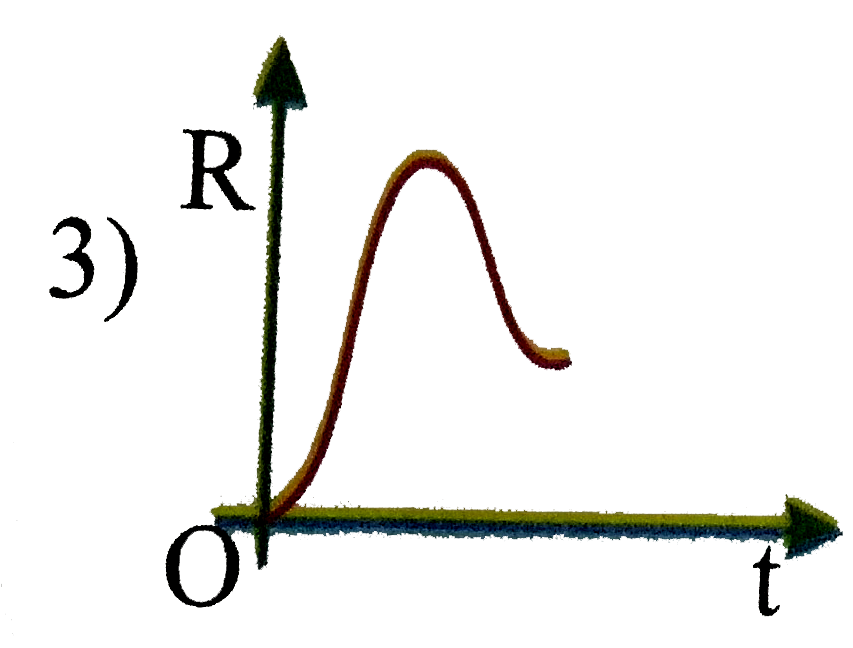 D
D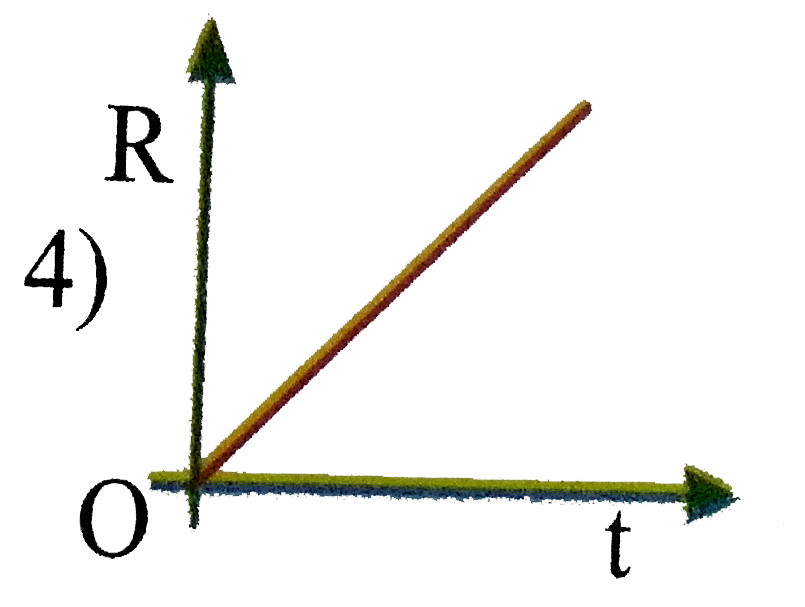
- Question 3 - Select One
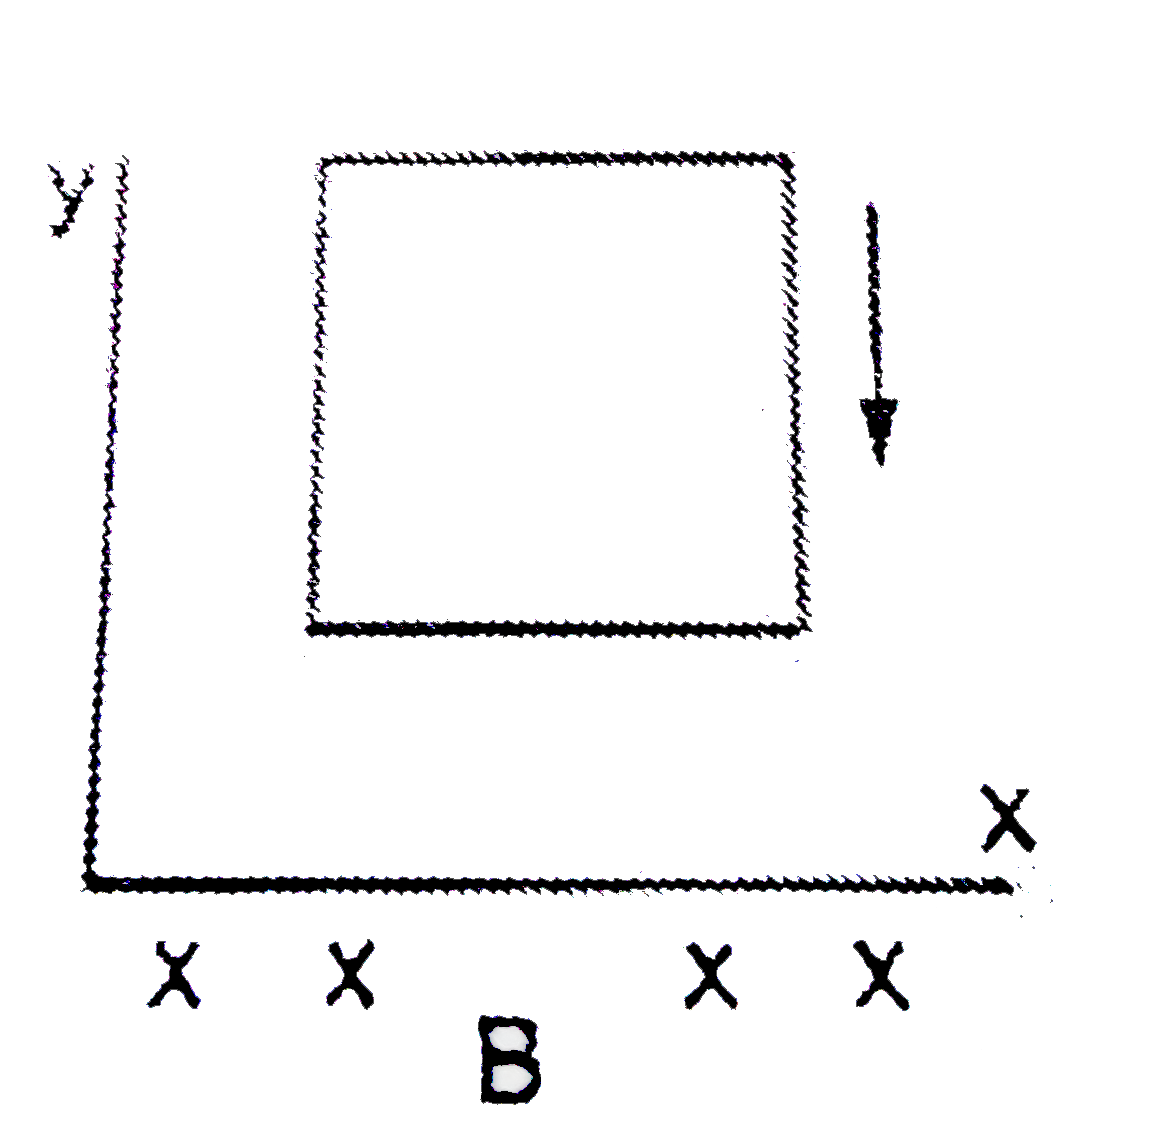
A square, conducting loop falls from rest in the xy-plane. There is a uniform magnetic field in the z-direction below the x-axis. The velocity v of the loop is plotted against time t. Which of the following best represents the resulting curveA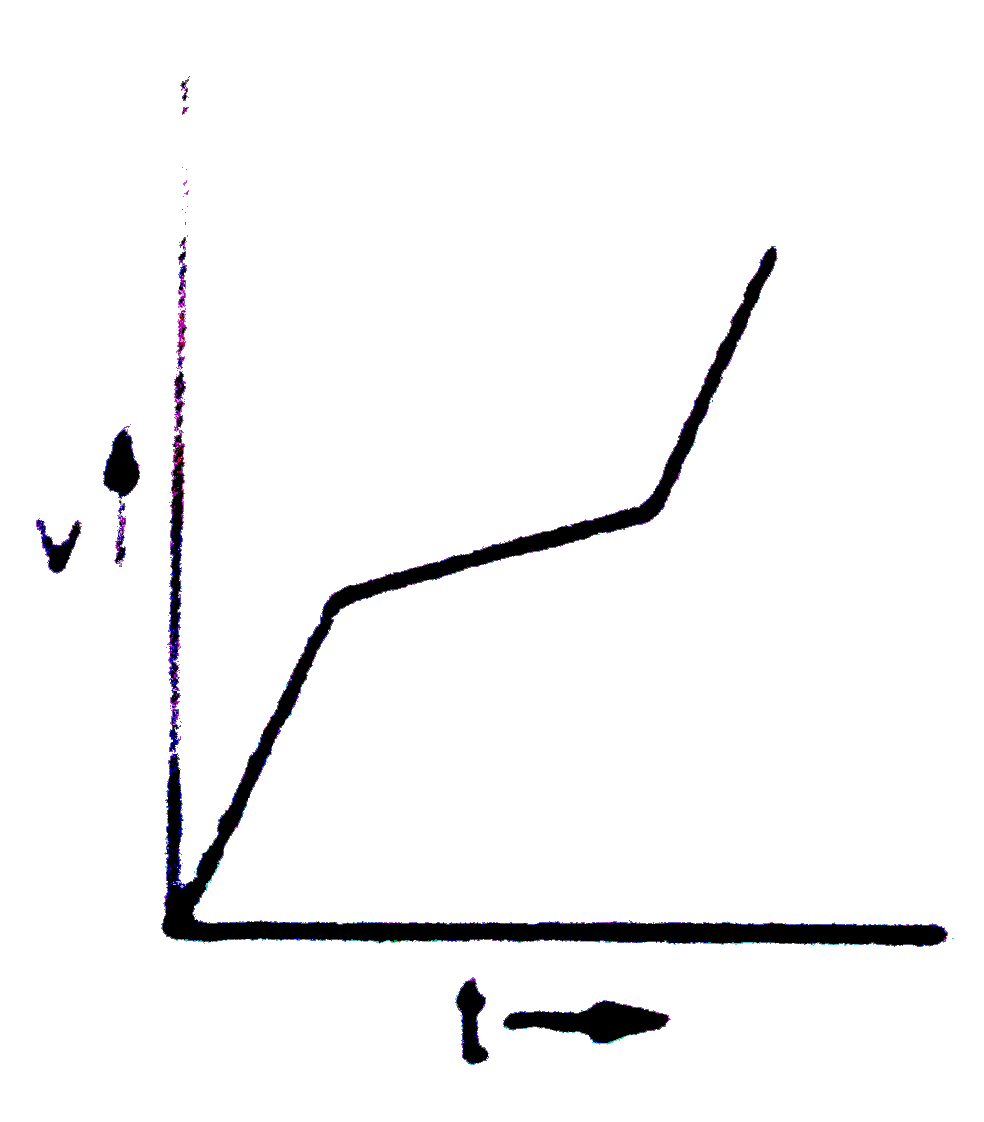 B
B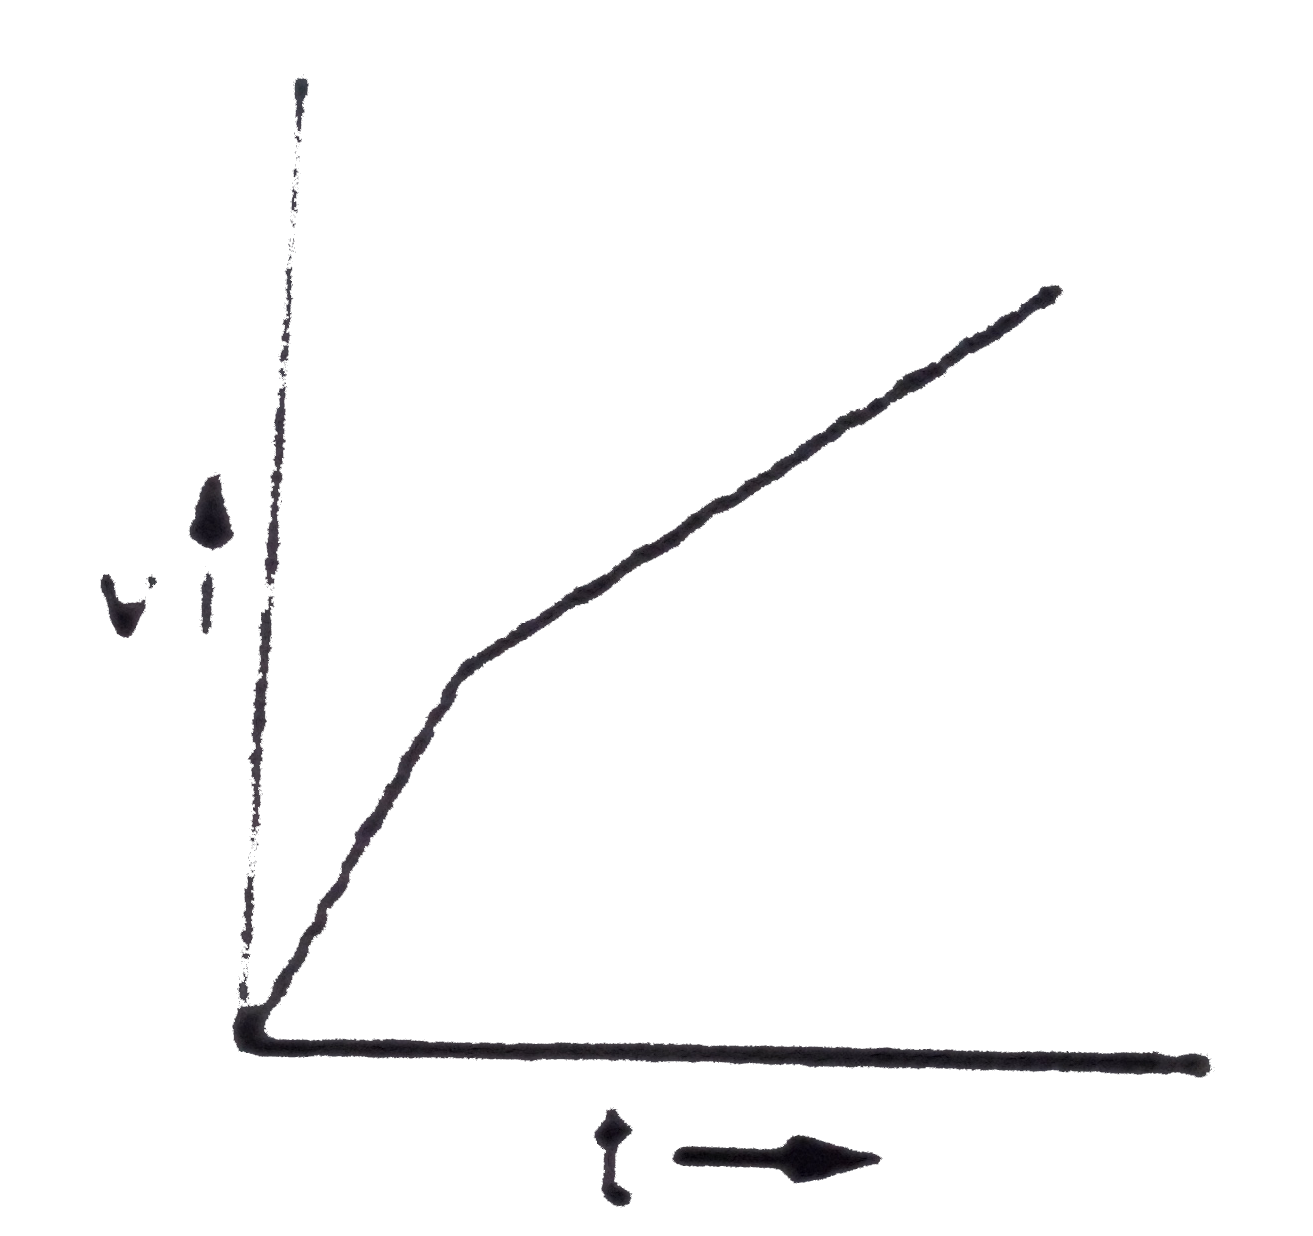 C
C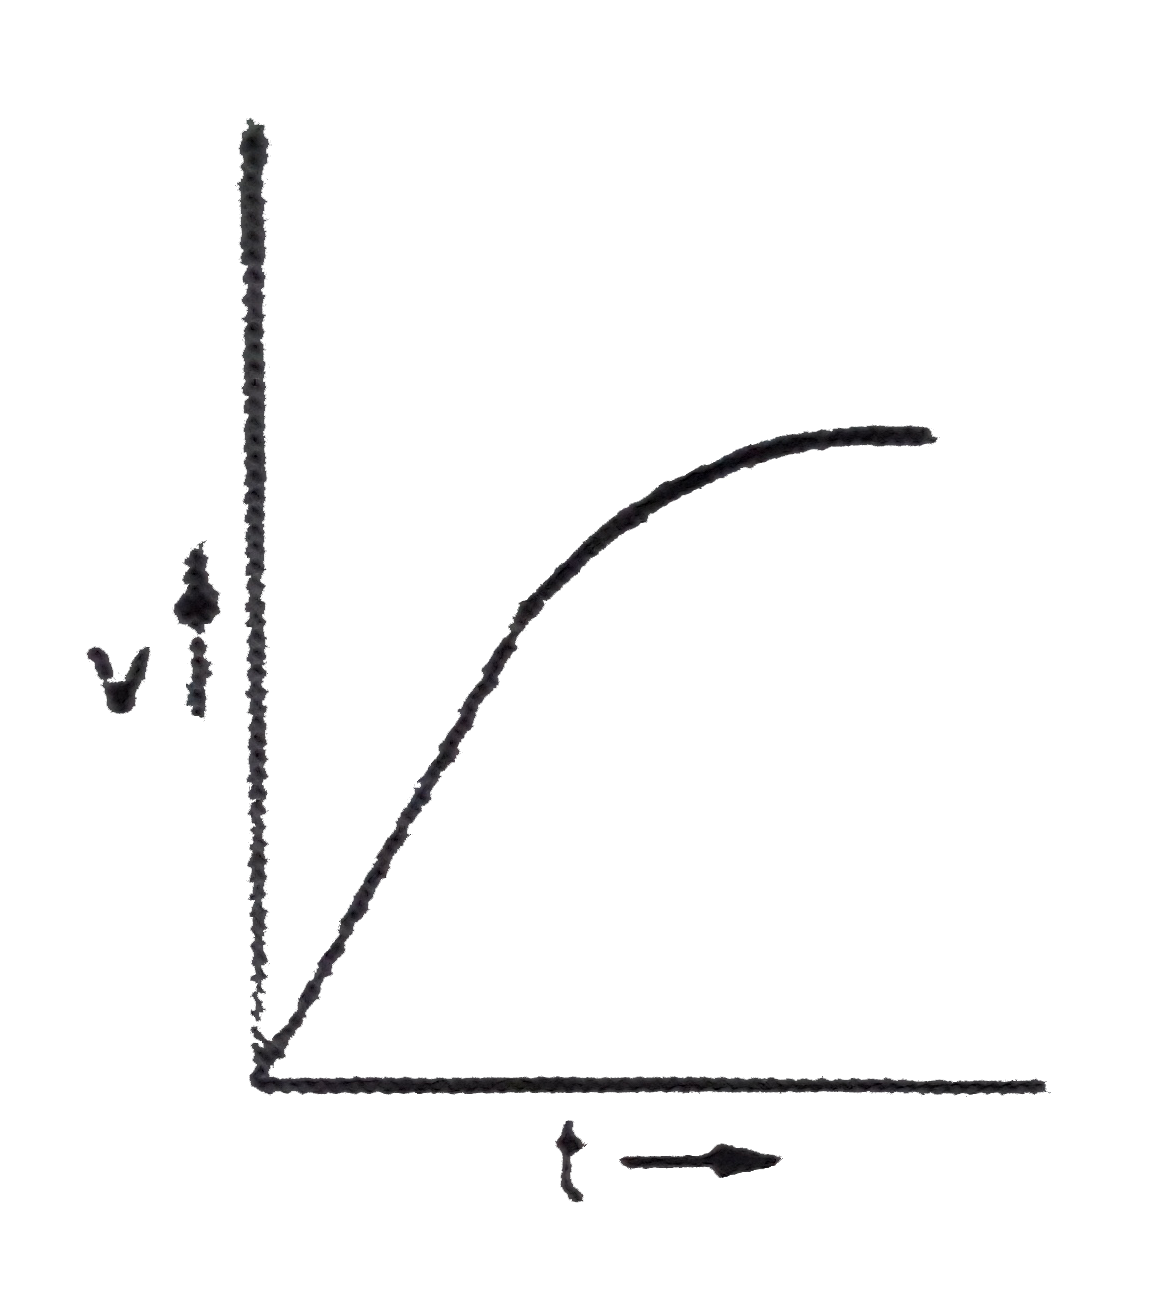 D
D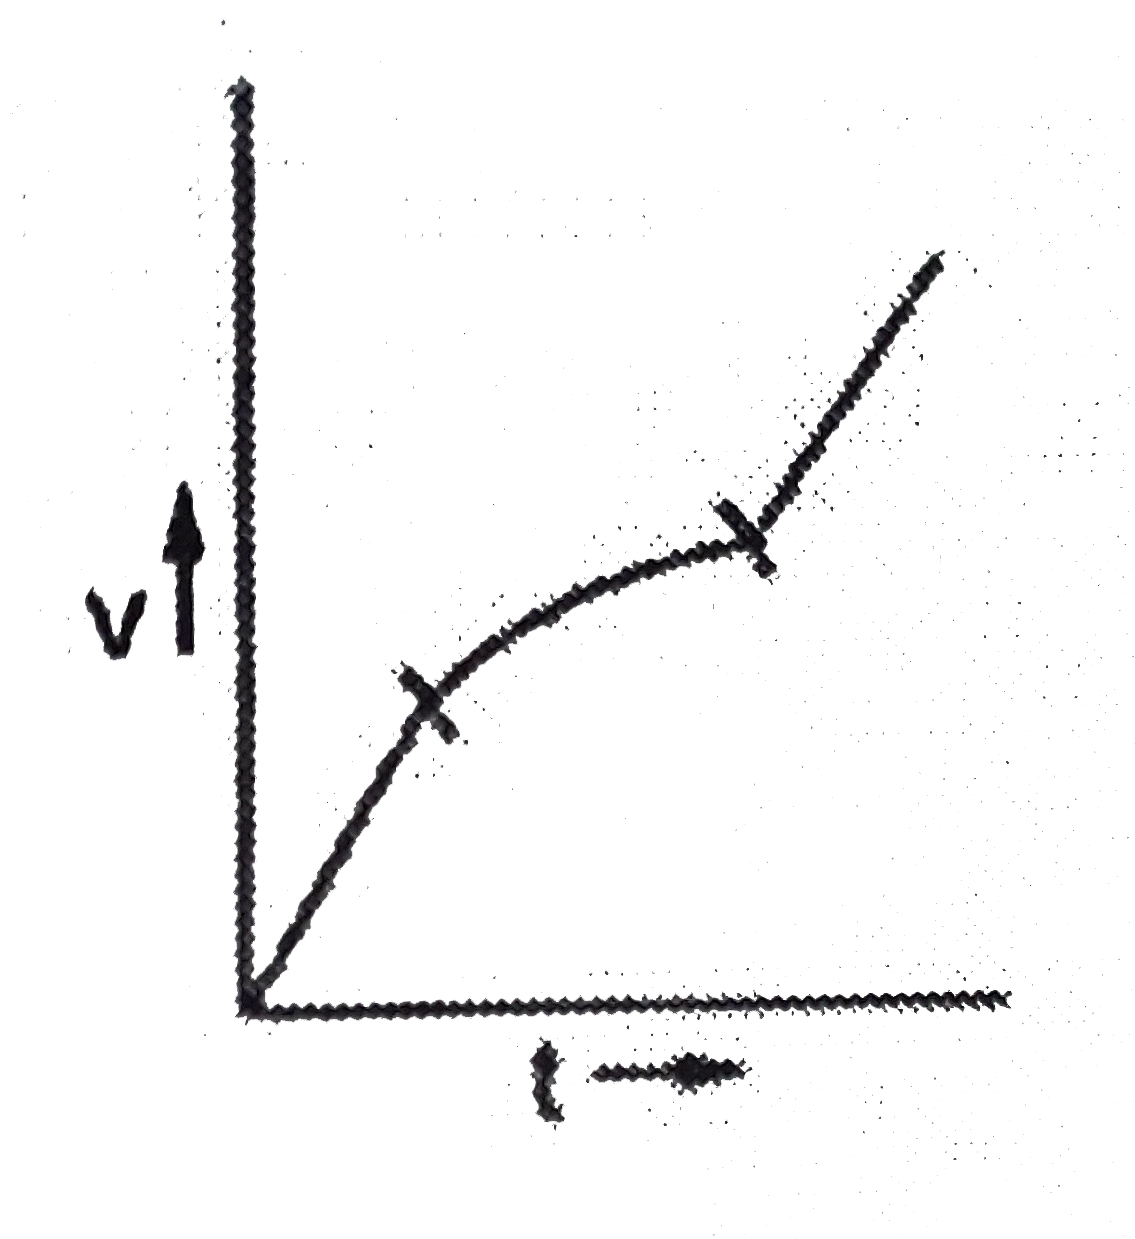
An ideal cell is connected to a capacitor through a voltmeter. The reading V of the voltmeter is plotted agains time. Which of the following best represents the resulting curve?
View SolutionWhich of the following P-V curve best represents. As isothermal process?
View SolutionWhich of the following P-V curve best represents. As isothermal process?
View SolutionA railway engine whistling at a constant frequency moves with a constant speed. It goes past a stationary observer standing beside the railway track. The frequency (n) of the sound heard by the observer is plotted agains time (t). Which of the following best represents the resulting curve?
View SolutionA thin, straight conductor lies along the axis of a hollow conductor of radius R. The two carry equal currents in the same direction. The magnetic field B is plotted against the distance r from the axis. Which of the following best represents the resulting curve?
View Solution

