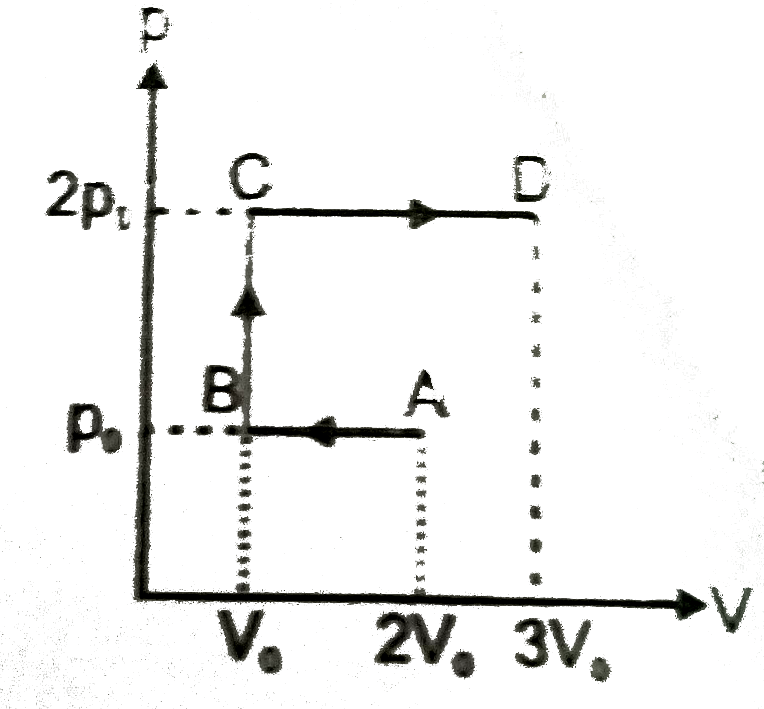
P−V indicator diagram for a given sample of monoatomic idela gas is shown in figure. If the average molar specific heat capacity of the system for the process ABCD is xR4 than find value of x:(R is a uniersal gas constant)
The correct Answer is:9
QAB=−(Cp)p0V0R
QBC=(Cv)p0V0R
QCD=Cp4p0V0R
Average molar specific heat capacity
=QAB+QBC+QCDμ(TD−TA)=[3Cp+Cv4]
Topper's Solved these Questions
- KTG & THERMODYNAMICSBOOK - RESONANCECHAPTER - KTG & THERMODYNAMICSEXERCISE - Exercise-2
1 Videos
- KTG & THERMODYNAMICSBOOK - RESONANCECHAPTER - KTG & THERMODYNAMICSEXERCISE - PART -I
15 Videos
- KTG & THERMODYNAMICSBOOK - RESONANCECHAPTER - KTG & THERMODYNAMICSEXERCISE - SECTION (J)
2 Videos
- KINETIC THEORY OF GASES AND THERMODYNAMICSBOOK - RESONANCECHAPTER - KINETIC THEORY OF GASES AND THERMODYNAMICSEXERCISE - Exercise
64 Videos
- MAGNETIC FIELD AND FORCESBOOK - RESONANCECHAPTER - MAGNETIC FIELD AND FORCESEXERCISE - Exercise
65 Videos
Similar Questions
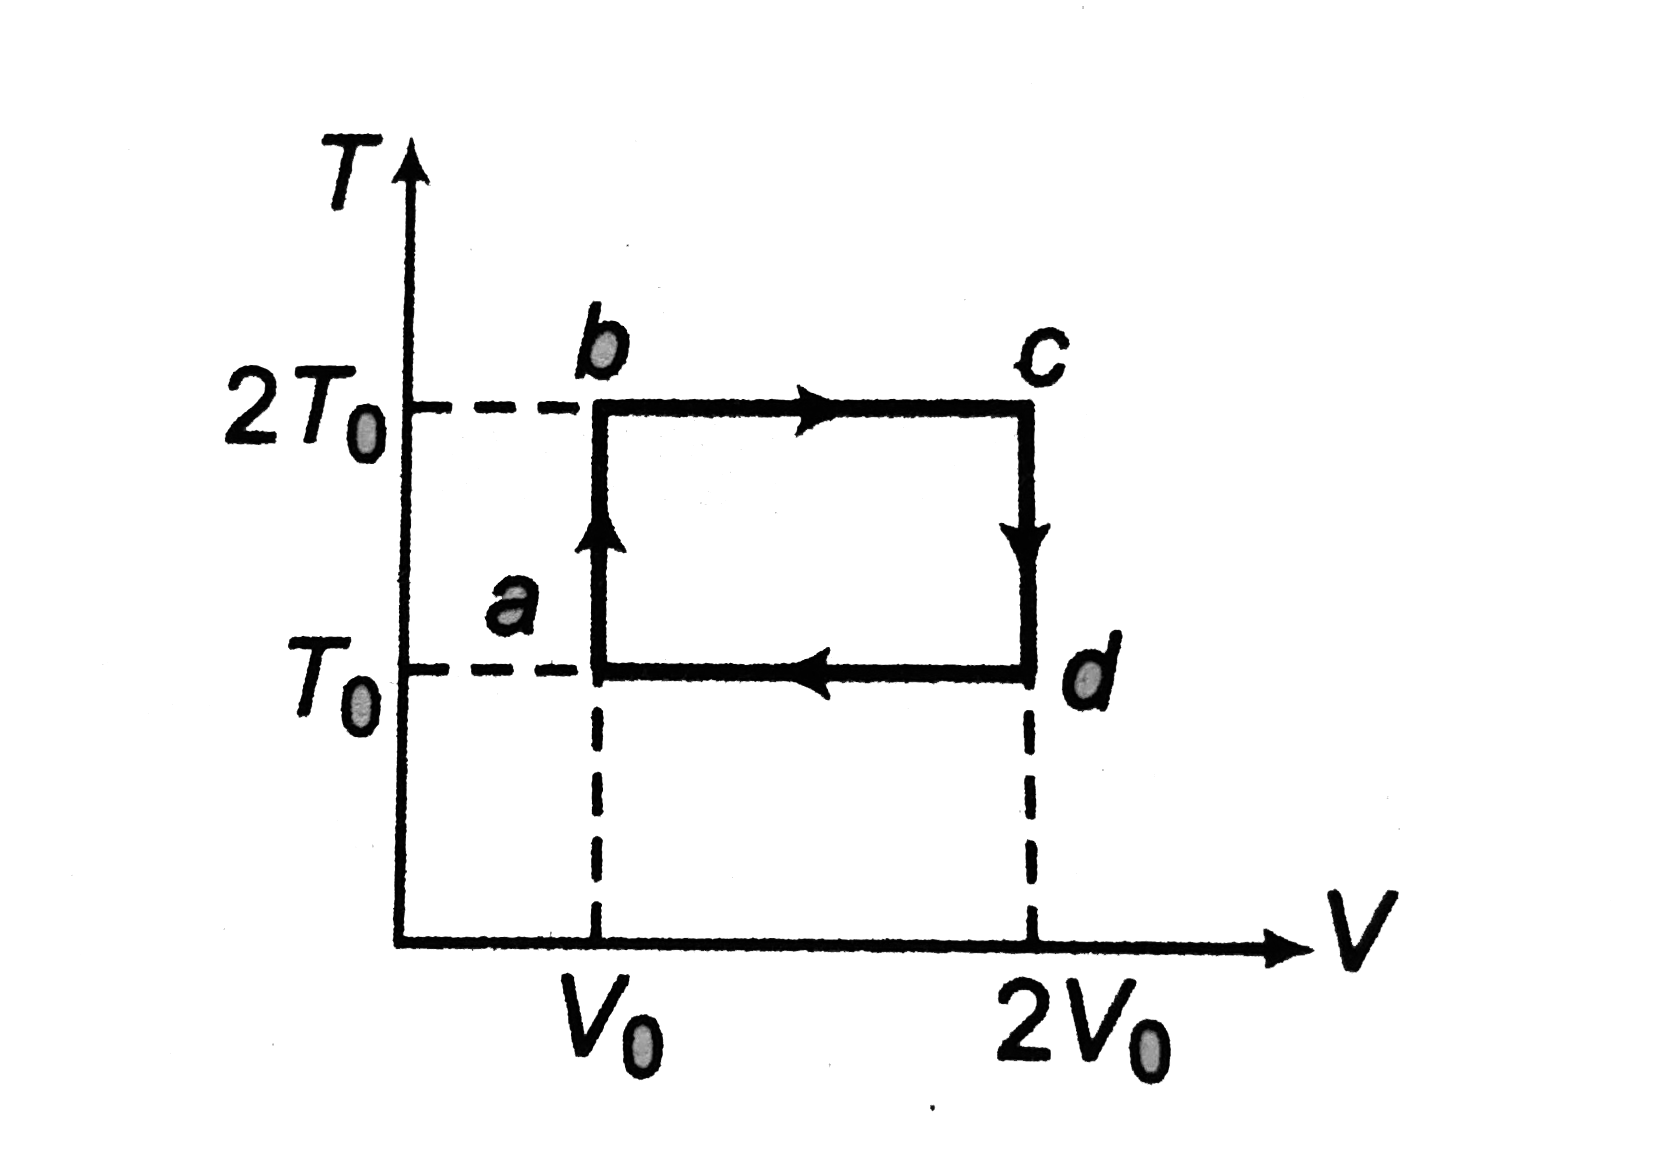
V-T graph of a process of monoatomic ideal gas is shown in figure.
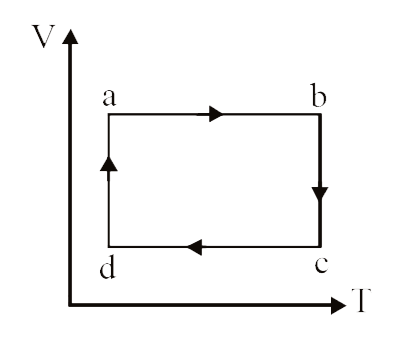
Heat is supplied to the gas in process(s)-
View SolutionP-V diagram of an ideal diatomic gas is a straight line passing through origin. The molar heat capacity of the gas in the process is xR. Find x (Here R - Universal gas constant)
View Solution
Knowledge Check
One mole of an ideal monoatomic gas undergoes a process as shown in the figure. Find the molar specific heat of the gas in the process.
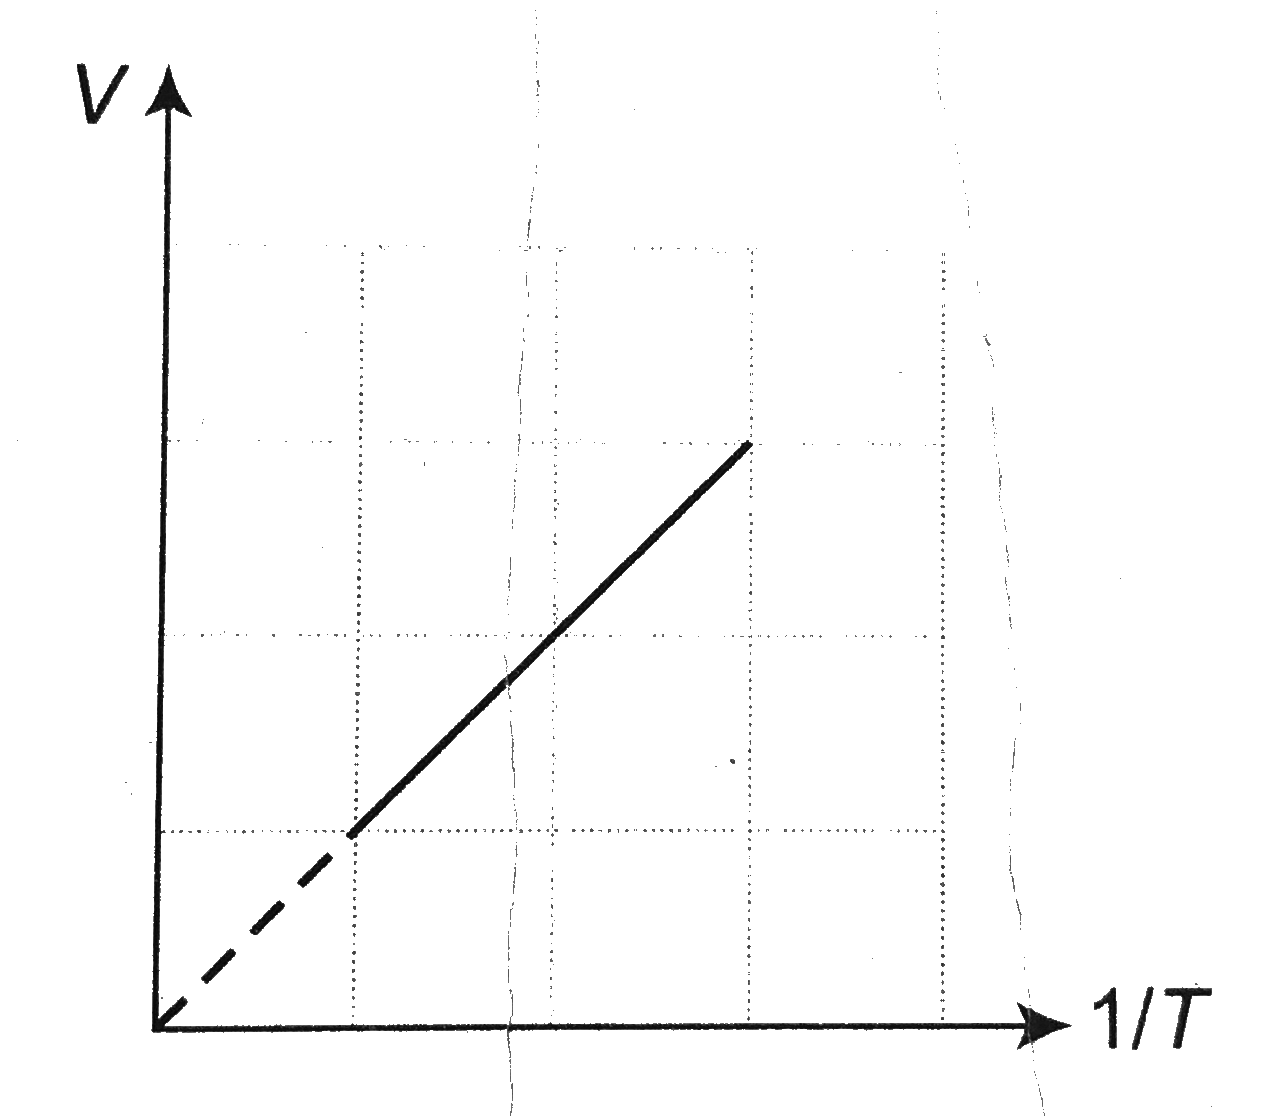
R is a gas constant.A3R4BR2CR3D2R3One mole of a monoatomic ideal gas undergoes process AB in given P – V diagram then average specific heat for this process is:
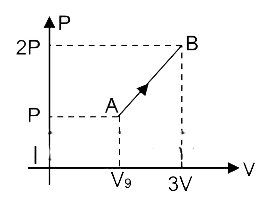 A21R10B18R10C9R10D13R10
P–V diagram of a monatomic gas is a straight line passing through origin. The molar heat capacity of the gas in the process will be:
A3R2BR2C2RD3R
P-V diagram of a diatomic gas is a straight line passing through origin. The molar heat capacity of the gas in the process will be
View SolutionT-V diagram of two moles of a monoatomic gas is as shown in figure.
For the process abcda choose the correct options given below
View SolutionDetermine the average molar heat capacity of an ideal gas under going a process shown in fig.
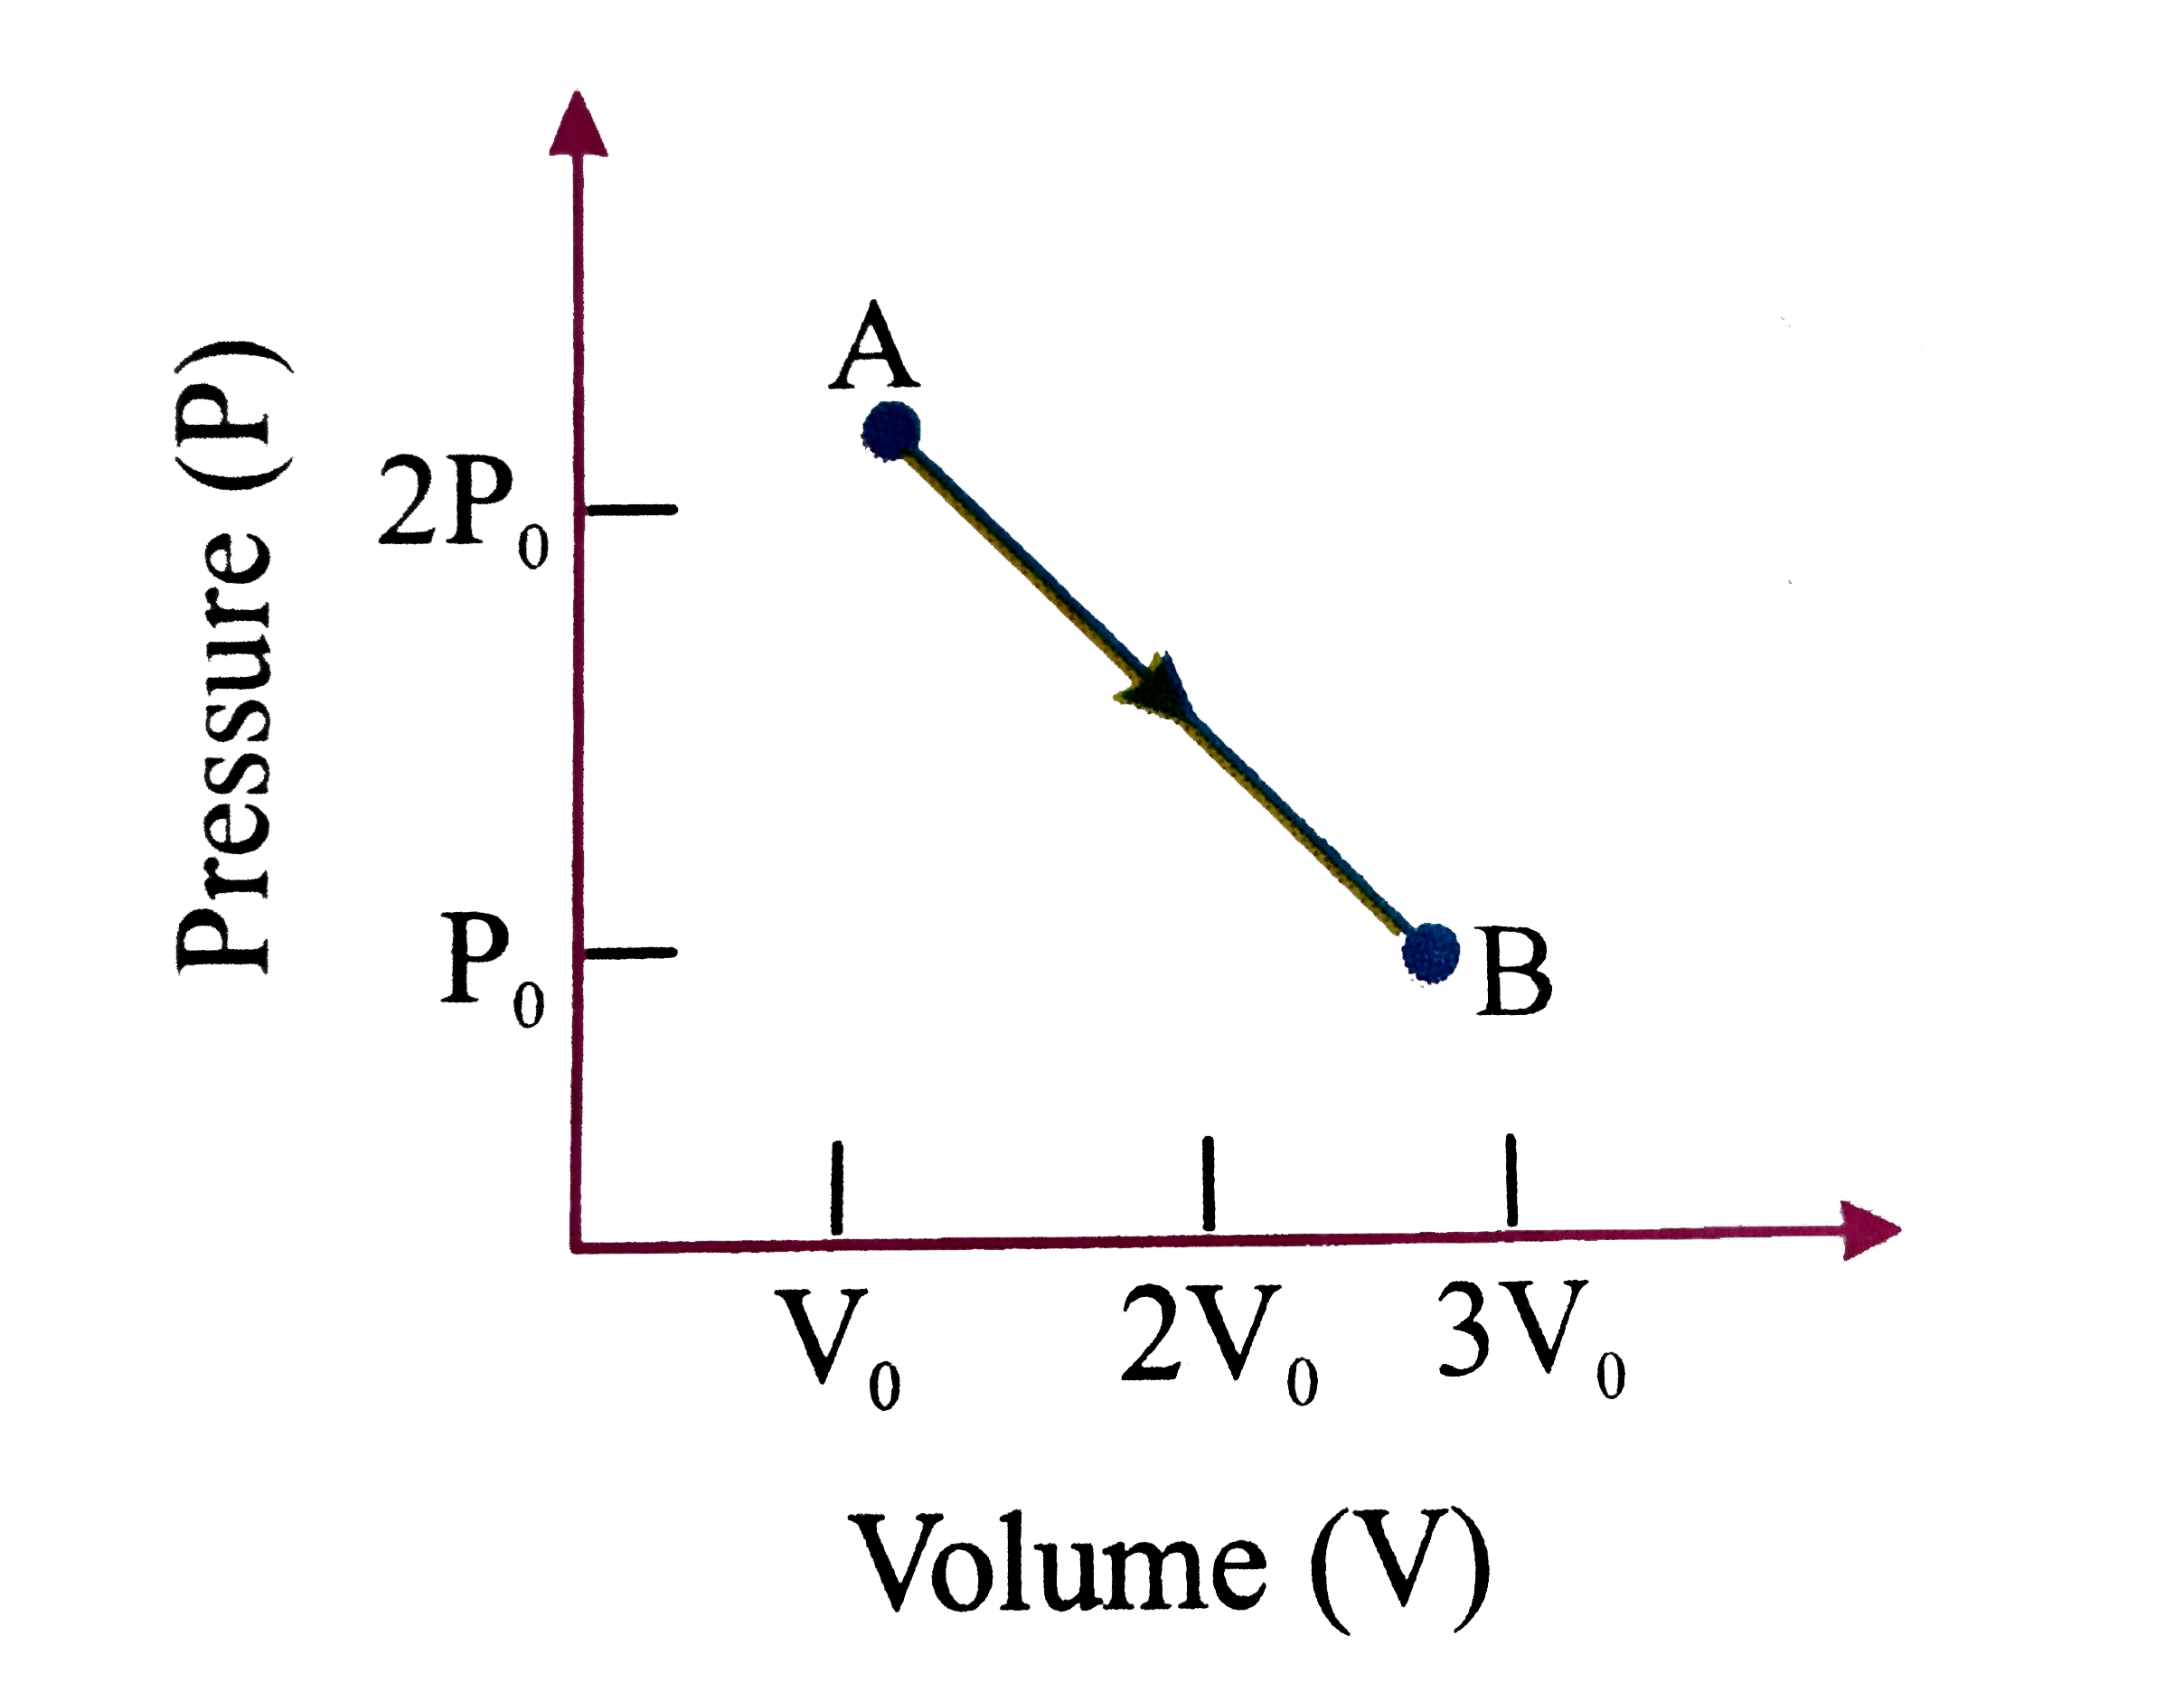
View SolutionP - V diagram of a diatomic gas is a straight line parallel to P-axis. The molar heat capacity of the gas in the process will be
View SolutionThe variation of pressure P with volume V for an ideal diatomic gas is parabolic as shown in the figure. The molar specific heat of the gas during this process is
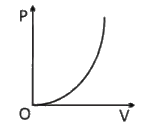
View Solution
