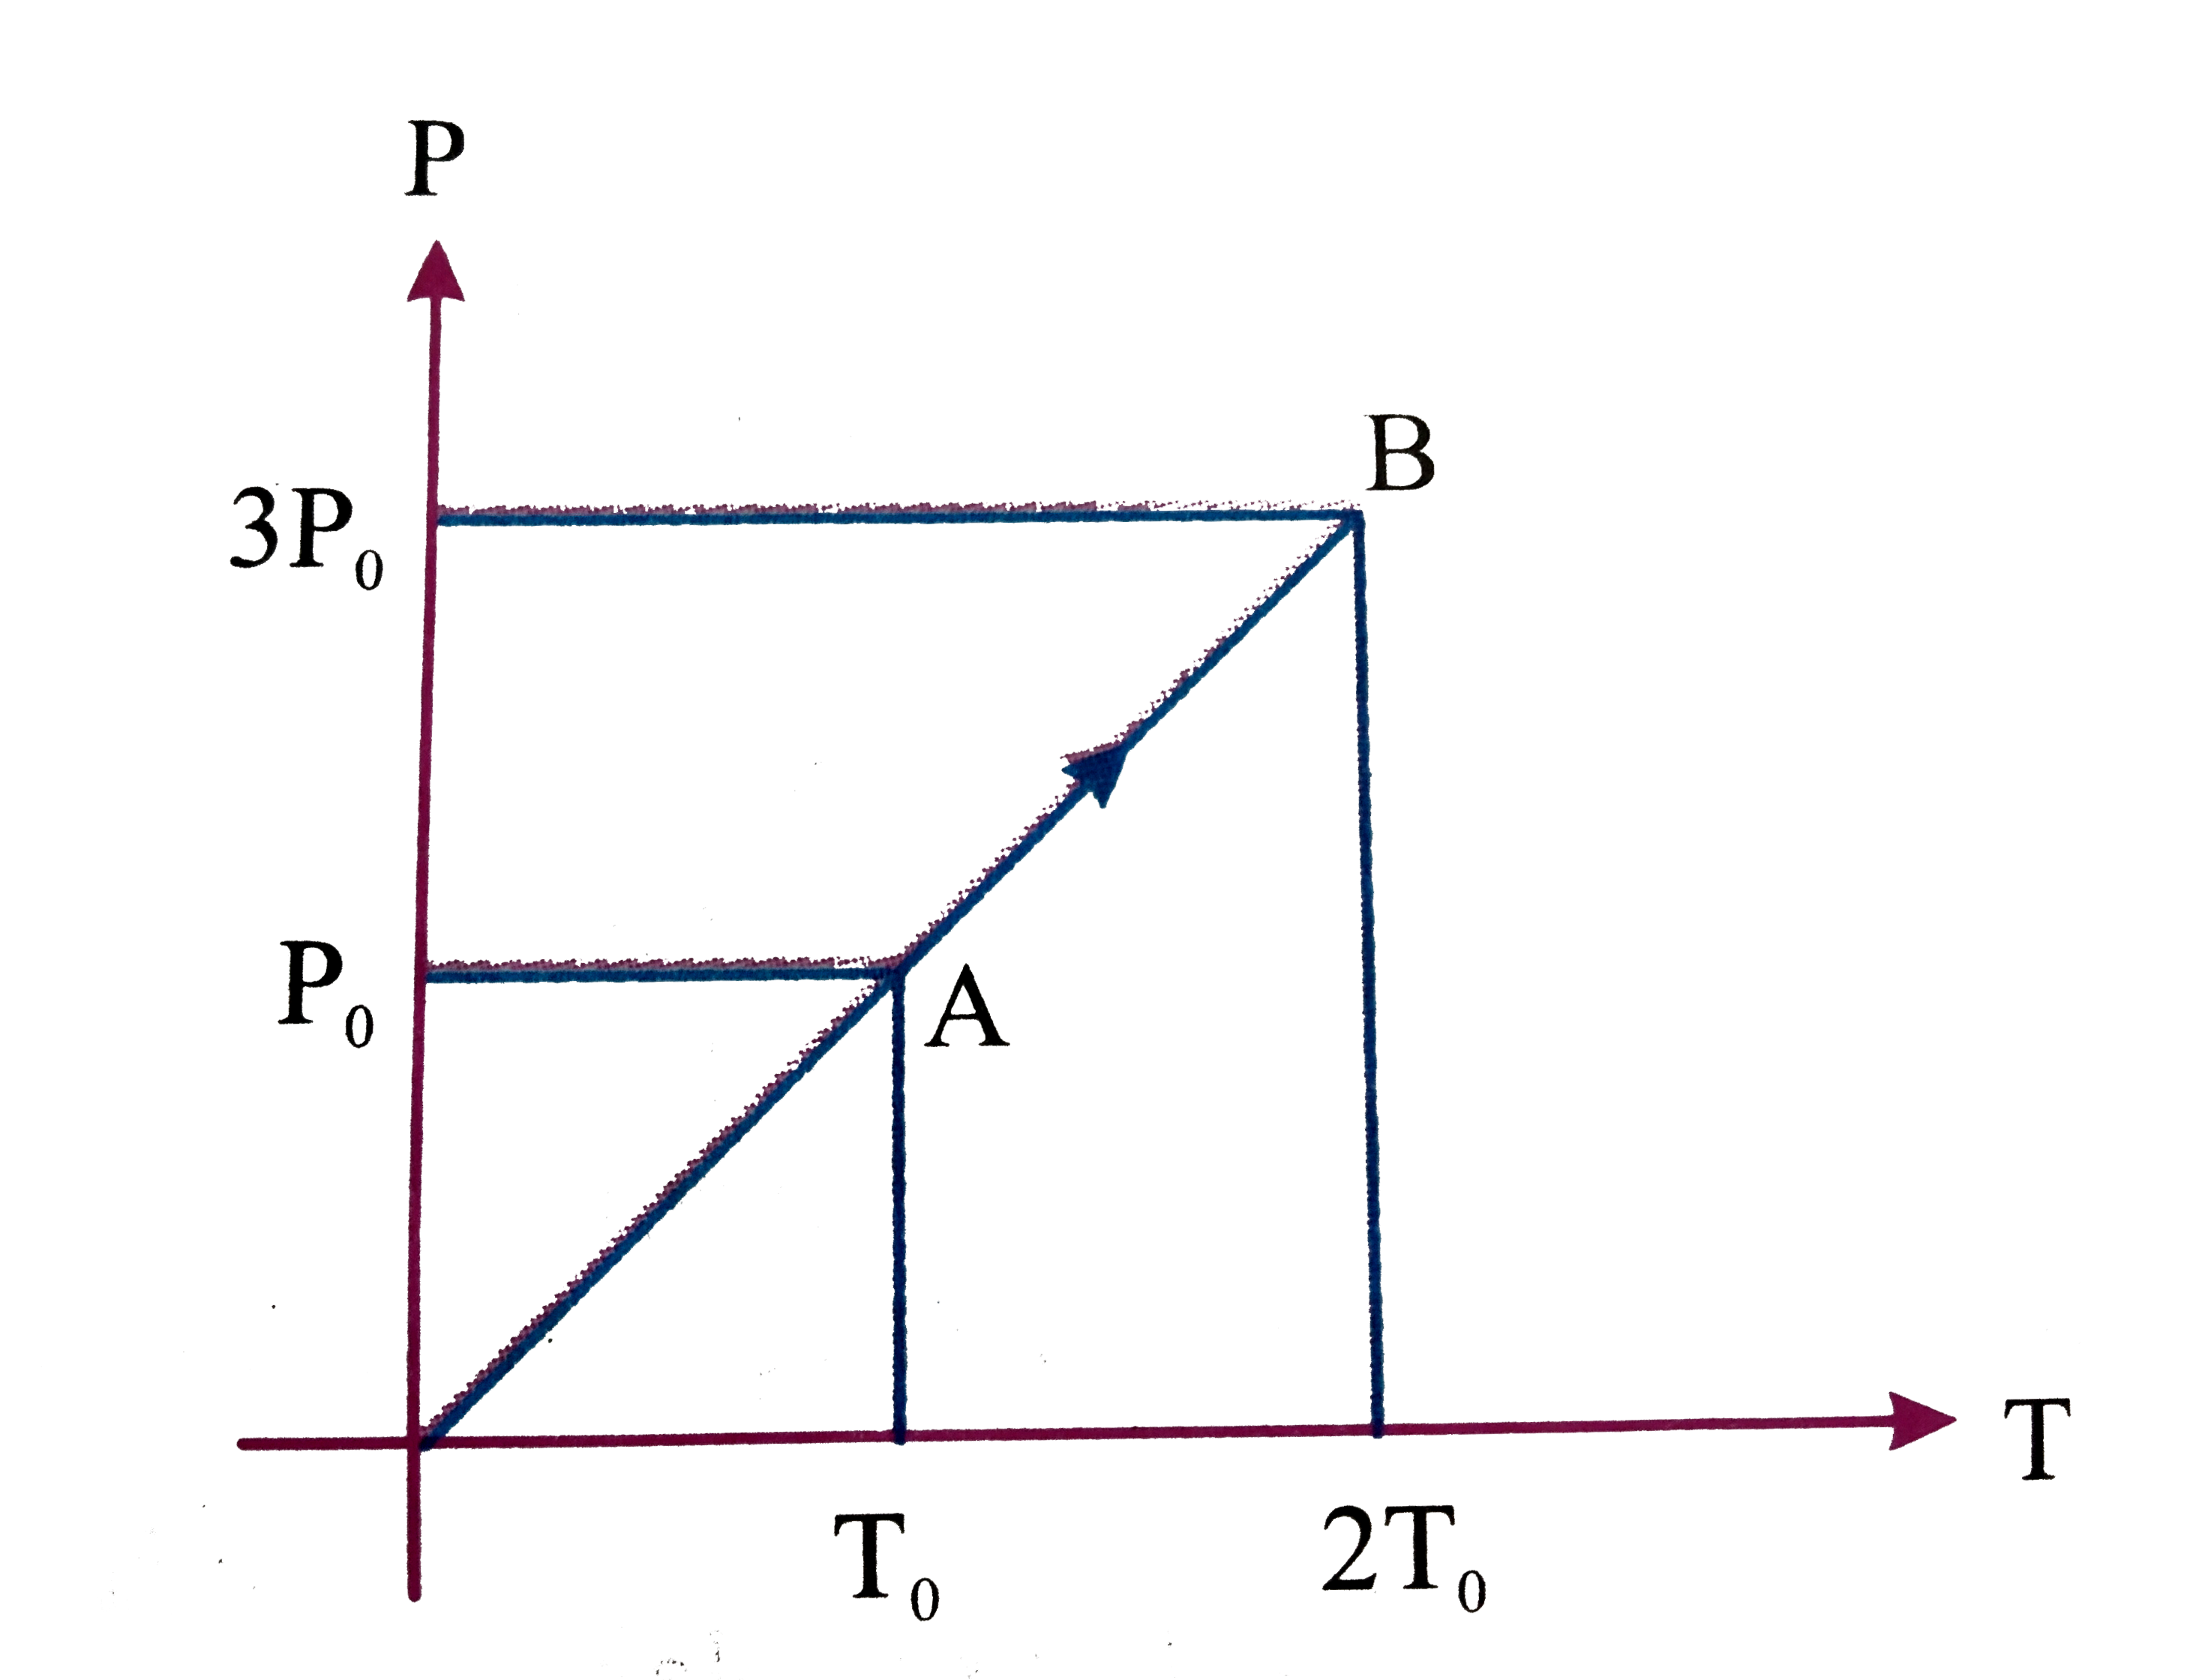
For a given mass of gas the variation of pressure versus temperature is shown in the figure. What is the ratio of volume of the gas at points A and B.
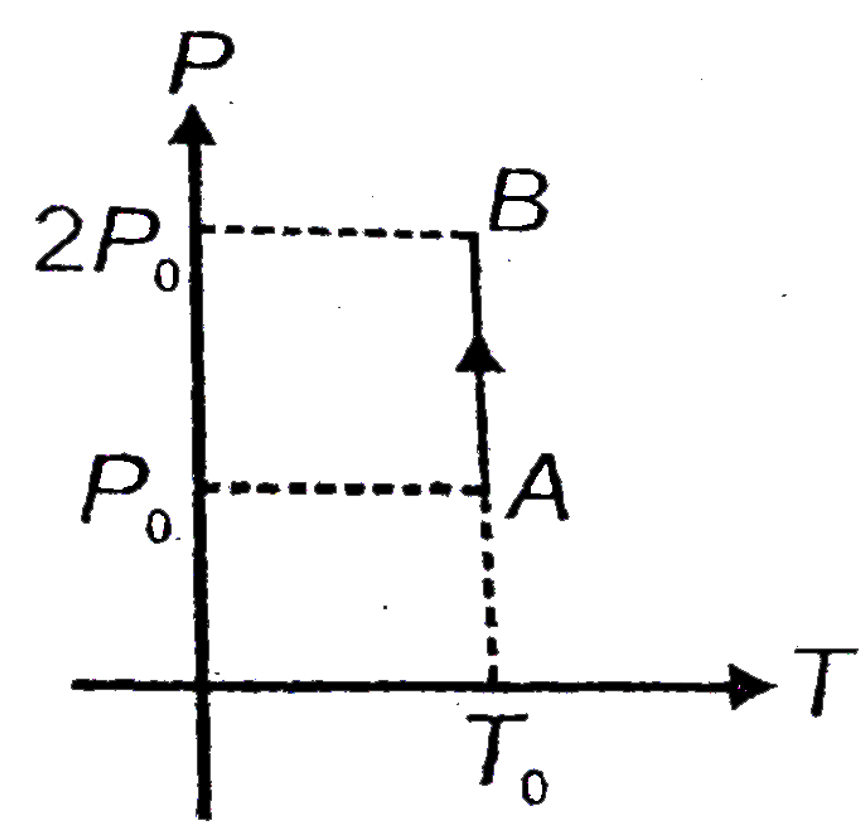 .
.
2:1
1:2
3:5
3:1
The correct Answer is:1
Step by step video & image solution for For a given mass of gas the variation of pressure versus temperature is shown in the figure. What is the ratio of volume of the gas at points A and B. . by Physics experts to help you in doubts & scoring excellent marks in Class 12 exams.
Updated on:21/07/2023Topper's Solved these Questions
- KINETIC THEORYBOOK - AAKASH INSTITUTECHAPTER - KINETIC THEORYEXERCISE - Assignment (Section-H) (Multiple True-false Type questions)
3 Videos
- KINETIC THEORYBOOK - AAKASH INSTITUTECHAPTER - KINETIC THEORYEXERCISE - Assignment (Section-I) (Subjective Type Questions)
5 Videos
- KINETIC THEORYBOOK - AAKASH INSTITUTECHAPTER - KINETIC THEORYEXERCISE - Assignment (Section-F) (Matrix-match type questions)
1 Video
- GRAVITATION BOOK - AAKASH INSTITUTECHAPTER - GRAVITATION EXERCISE - ASSIGNMENT SECTION - D (ASSERTION-REASON TYPE QUESTIONS)
16 Videos
- LAWS OF MOTIONBOOK - AAKASH INSTITUTECHAPTER - LAWS OF MOTIONEXERCISE - Assignment (SECTION-D) (Assertion-Reason Type Questions)
15 Videos
Similar Questions
The variation of pressure versus volume is shown in the figure. The gas is diatomic and the molar specific heat capacity for the process is found to xR. Find the value of x.
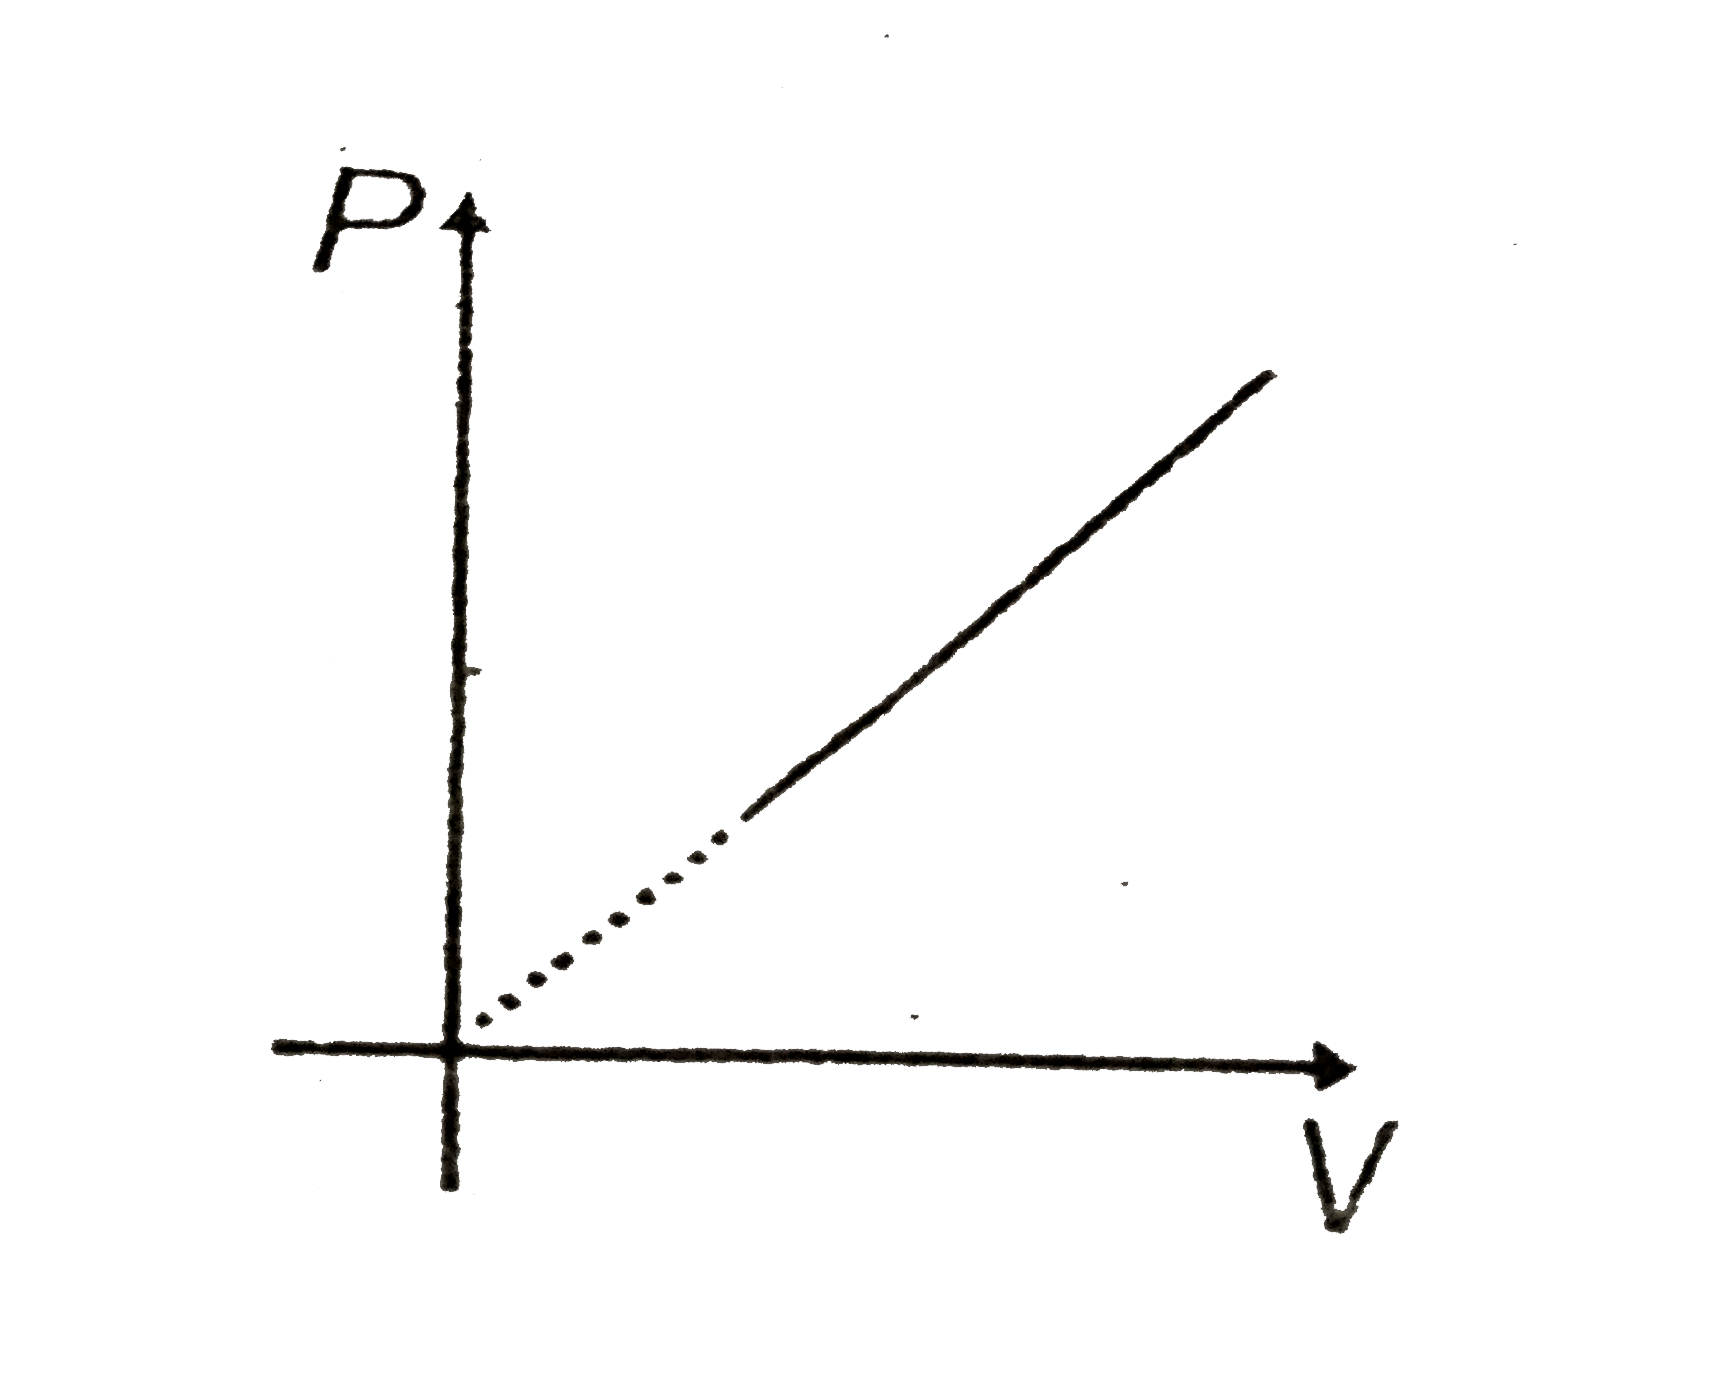 .
.
View SolutionThe volume of vessel A is twice the volume of another vessel B and both of them are filled with the same gas. If the gas in A is at twice the temperature and twice the pressure in comparison to the gas in B, what is the ratio of number of gas molecule in A and B ?
View Solution
Knowledge Check
The change in volume of a given mass of gas with the temperature is graphically represented as shown in the figure shown below. Determine the ratio of densities of the gas at 100∘Cand150∘C.
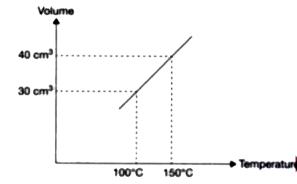 A43B34C35D13
Pressure versus temperature graphs of an ideal gas are as shown in figure. Choose the wrong statement
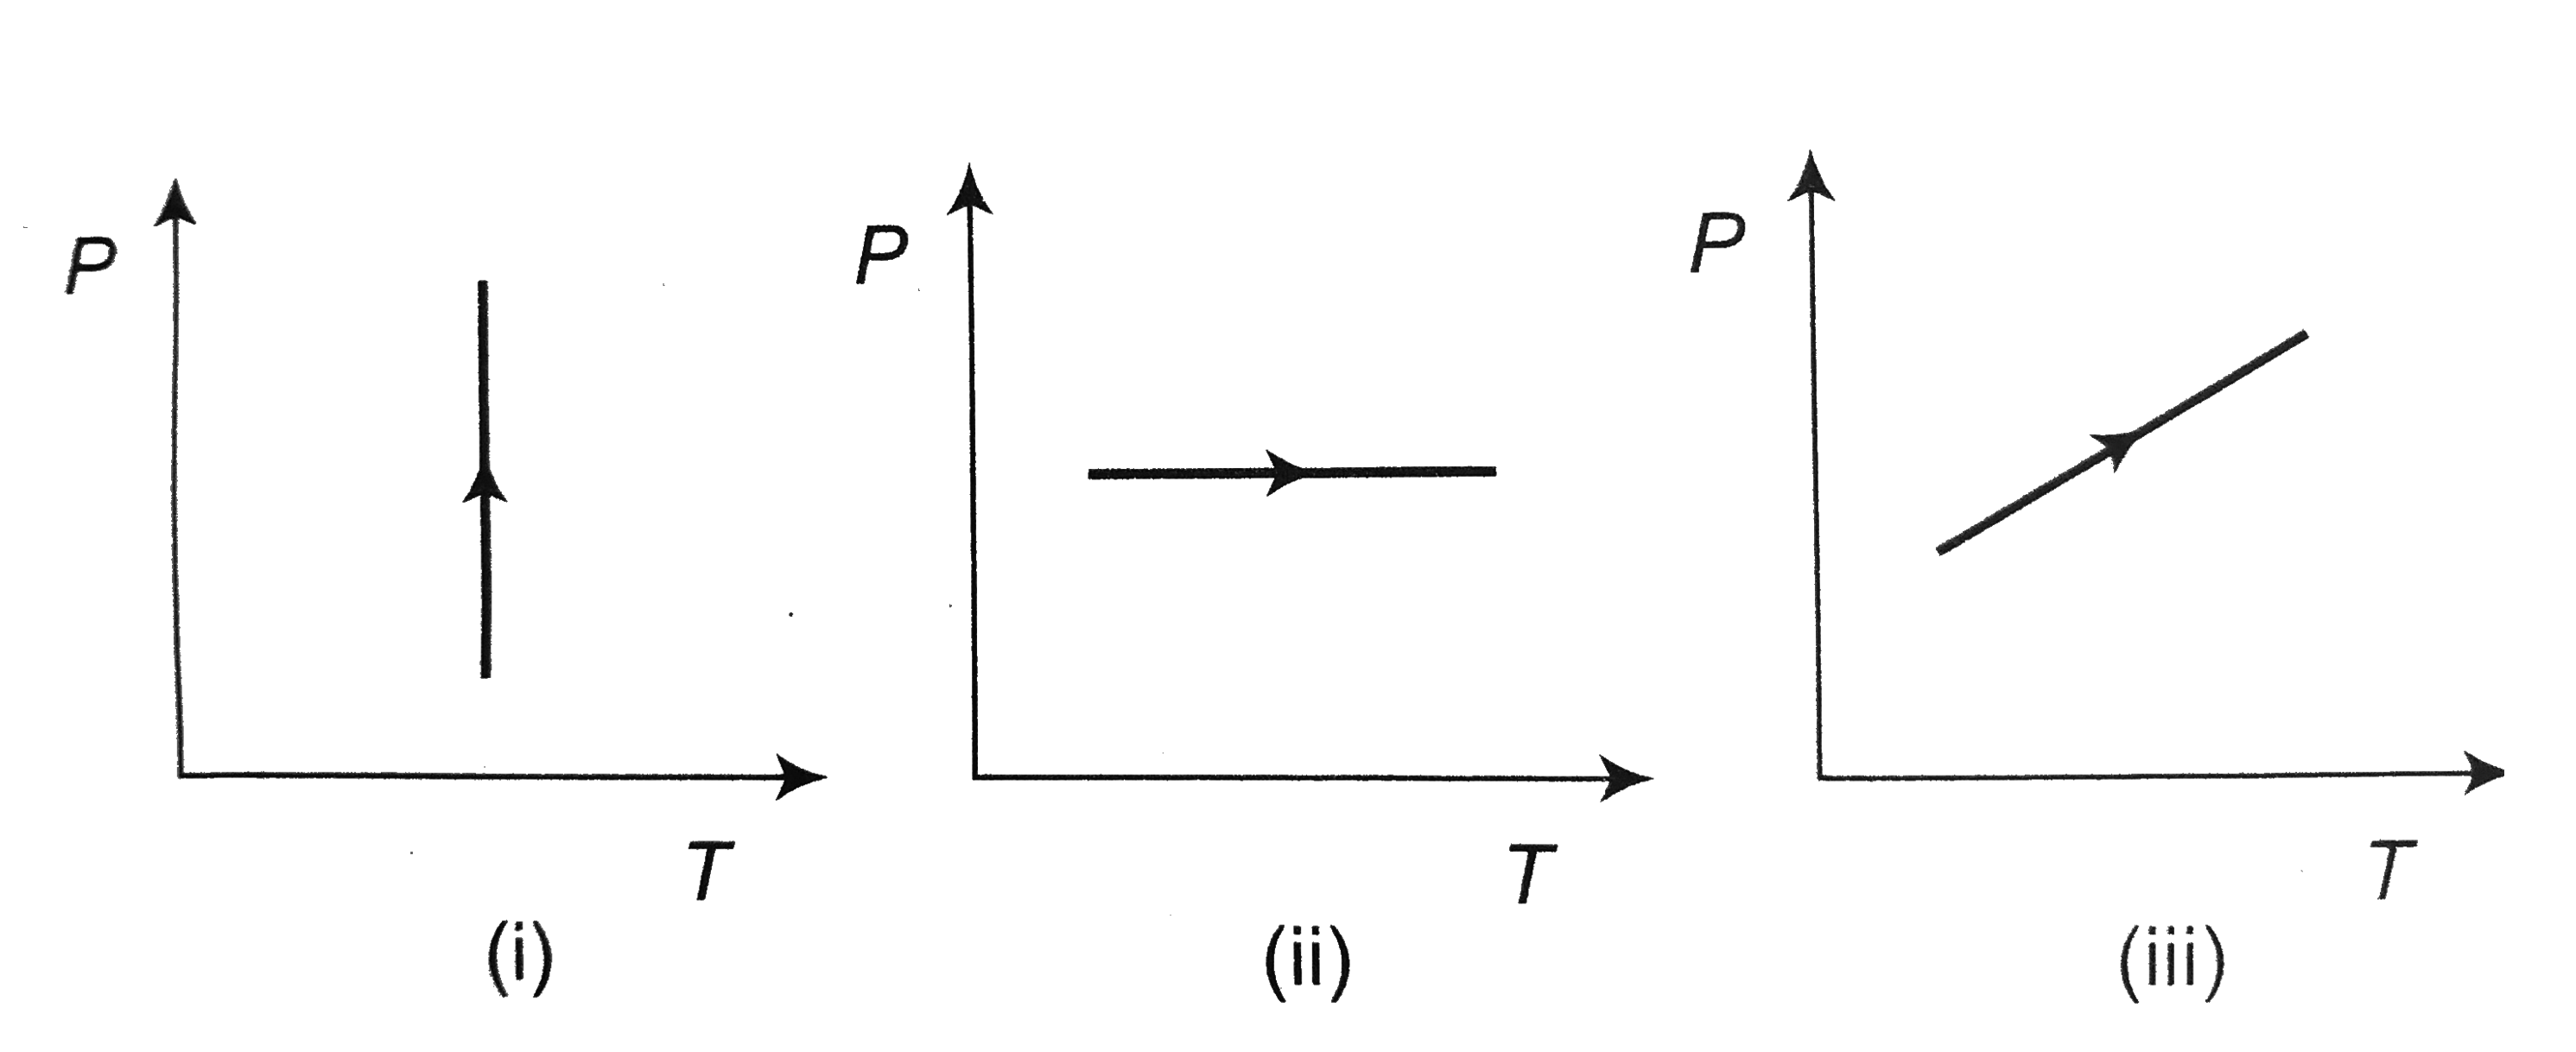 ADensity of gas is increased in graph (i)BDensity of gas is decrease in graph (ii)CDensity of gas is constant in graph (iii)DNone of these
Pressure versus temperature graph of an ideal gas is shown in figure. Density of the gas at point A is P0. Density at B will be
 A34ρ0B32ρ0C43ρ0D2ρ0
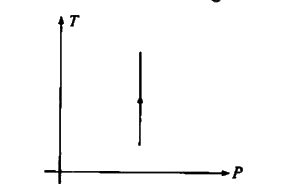
Pressure versus temperature graph of an ideal gas are as shown in figure-2.39. Choose the wrong statement
View SolutionThe pressure of a gas is doubled keeping its temperature constant. Find the ratio of the final volume of the gas to its initial volume.
View SolutionThe pressure of a gas is doubled keeping its temperature constant. Find the ratio of the final volume of the gas to its initial volume.
View SolutionFor a given mass of a gas what is the shape of (p) versus (1V) graph at constant temperature ?
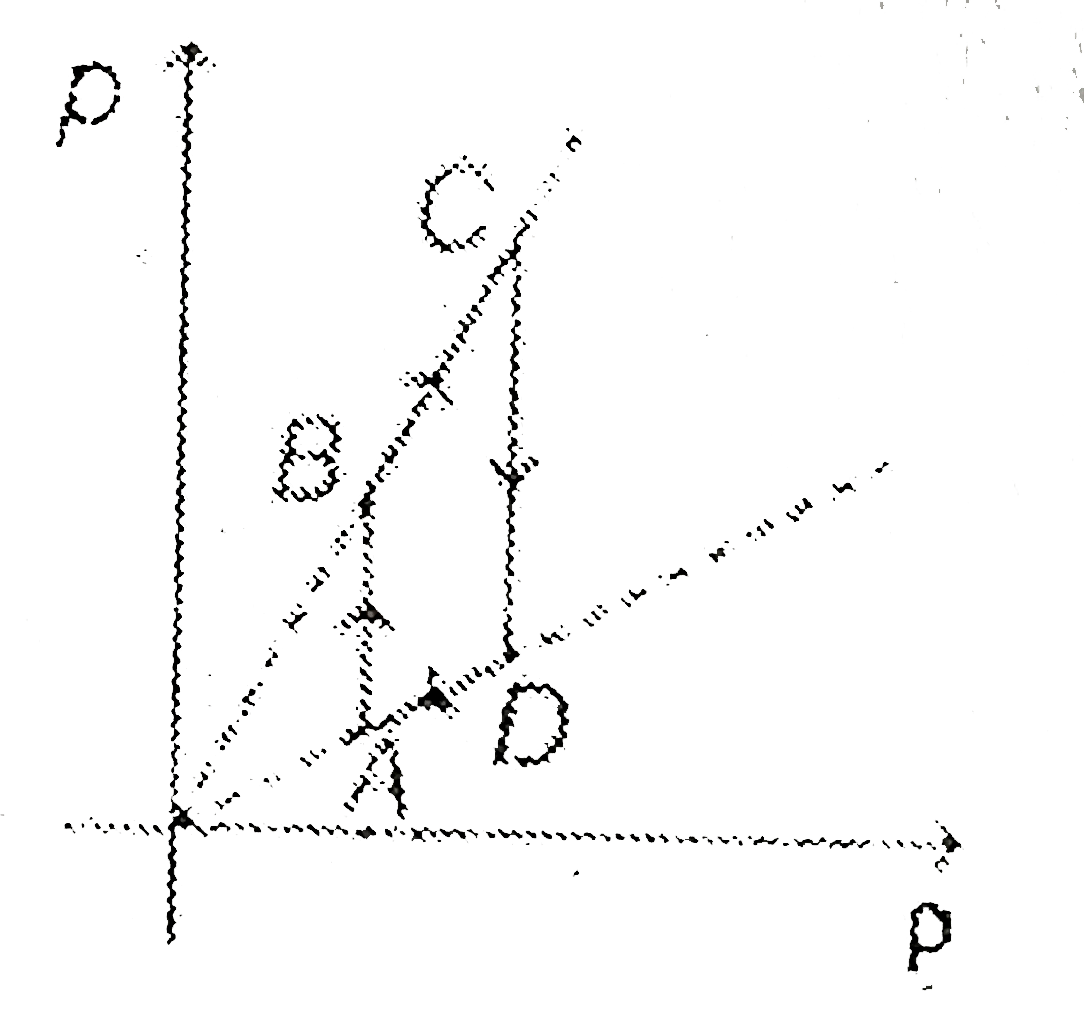
View SolutionPressure versus density graph of an ideal gas is shown in figure
View Solution
