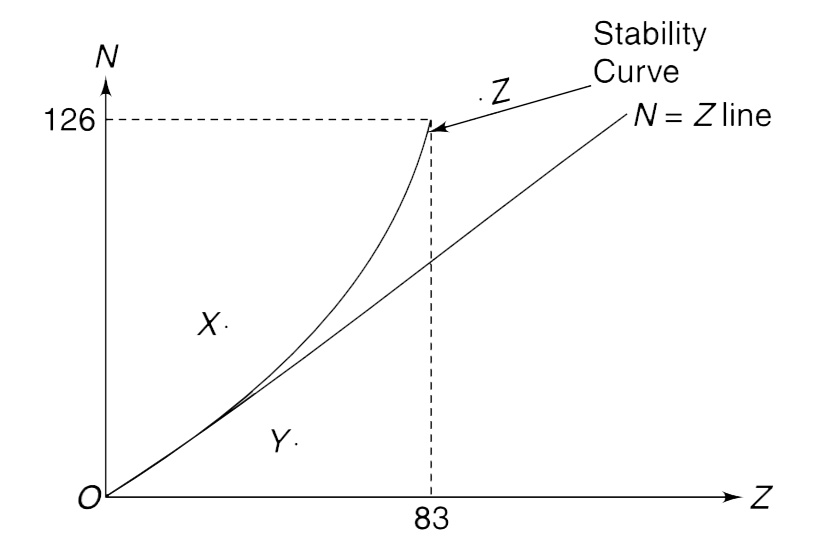
Statement-1: Th plot of atomic number (y-axis) versus number of neutrons (x-axis) for stable nuclei shows a curvature towards x-axis from the line of 45∘C slope as the atomic number is increased.
Statement-2: Proton-proton electrostatic repulsions begin to overcome attractive forces involving protons and neutrons in heavier nuclides.
Statement-1 is True, statement-2 is True, Statement-2 is a correct explantion for Statement-1.
Statement-1 is True, Statement-2 is True, Statement-2 is NOT a correct explanation for Statement-1
Statement-1 is True, Statement-2 is False.
Statement-1 is False, Statement-2 is True.
The correct Answer is:a
Topper's Solved these Questions
- CHEMICAL KINETICSBOOK - GRB PUBLICATIONCHAPTER - CHEMICAL KINETICSEXERCISE - Multiple Objective type
40 Videos
- CHEMICAL KINETICSBOOK - GRB PUBLICATIONCHAPTER - CHEMICAL KINETICSEXERCISE - Comprehension type 1
1 Videos
- CHEMICAL KINETICSBOOK - GRB PUBLICATIONCHAPTER - CHEMICAL KINETICSEXERCISE - Nuclear Chemistry
63 Videos
- CHEMICAL BONDING-IBOOK - GRB PUBLICATIONCHAPTER - CHEMICAL BONDING-IEXERCISE - Subjective Type
120 Videos
- COORDINATION COMPOUNDSBOOK - GRB PUBLICATIONCHAPTER - COORDINATION COMPOUNDSEXERCISE - SBJECTIVE TYPE
98 Videos
Similar Questions
Statement : The plot of atomic number ( y -axis ) versus number of neutrons ( x -axis ) for stable nuclei shows a curvature towards x-axis fron the line of 45∘ slope as the atomic number is increased .
Explanation : proton -proton electrostatic repulsions begin to overcome attracive forces involving protons and neutrons in heavier nuclides.
View SolutionThe figure shows a plot of number of neutron (N) versus number of protons (z) in all stable nuclei found in nature. What kind of decay are nuclei X,Y and Z expected to show?

View Solution
Knowledge Check
Statement : The plot of atomic number ( y -axis ) versus number of neutrons ( x -axis ) for stable nuclei shows a curvature towards x-axis fron the line of 45∘ slope as the atomic number is increased .
Explanation : proton -proton electrostatic repulsions begin to overcome attracive forces involving protons and neutrons in heavier nuclides.AStatement 1 is true, statement 2 is true, statement 2 is correct explanation for statement 1.BStatement 1 is true, statement 2 is true, statement 2 is not a correct explanation for statement 1.CStatement 1 is true, statement 2 is falseDStatement 1 is false, statement 2 is trueStatement : The plot of atomic number ( y -axis ) versus number of neutrons ( x -axis ) for stable nuclei shows a curvature towards x-axis fron the line of 45∘ slope as the atomic number is increased .
Explanation : proton -proton electrostatic repulsions begin to overcome attracive forces involving protons and neutrons in heavier nuclides.AIf both Statement-I & Statement -II are True & the Statement -II is a correct explanation of the Statement -I.BIf both Statement -I & Statement -II are True but Statement-II is not a correct explanation of the Statement-I.CIf Statement-I is True but the Statement -II is False.DIf Statement-I is False but the Statement -II is True.Statement : The plot of atomic number ( y -axis ) versus number of neutrons ( x -axis ) for stable nuclei shows a curvature towards x-axis fron the line of 45∘ slope as the atomic number is increased .
Explanation : proton -proton electrostatic repulsions begin to overcome attracive forces involving protons and neutrons in heavier nuclides.AS is correct but E is wrongBS is wrong but E is correct.CBoth S and E are correct and E is correct explanation of SDBoth S and E are correct but E is not correct explanation of S
Statement 1 : Proton -proton electrostatic repulsions begin to overcome attractive forces involving protons and neutrons in heavier nuclides
Statement 2 : The plot of atomic number (y-axis) veruse number of neutrons (x-axis) for stable nuclei shows a curvature towards x-axis from the line of 45∘ slope as the atomic number is increased.
View SolutionA plot of the number of neutrons (n) against the number of protons (p) of stable nuclei exhibits upward deviation from linearity for atomic number, Z > 20. For an unstable nucleus having n, p ratio less than 1, the possible mode(s) of decay is(are)
View SolutionA plot of the number of neutrons (n) against the number of protons (p) of stable nuclei exhibits upward deviation from linearity for atomic number, Z>20. For an unstable nucleus having n/p ratio less than 1, the possible mode (s) of decay is (are)
View SolutionA plot of the number of neutrons (n) against the number of protons (p) of stable nuclei exhibits upward deviation from linearity for atomic number, Z>20. For an unstable nucleus having n/p ratio less than 1, the possible mode (s) of decay is (are)
View SolutionA plot of the number of neutrons (n) against the number of protons (p) of stable nuclei exhibits upward deviation from linearity for atomic number, Z>20. For an unstable nucleus having n/p ratio less than 1, the possible mode (s) of decay is (are)
View Solution
