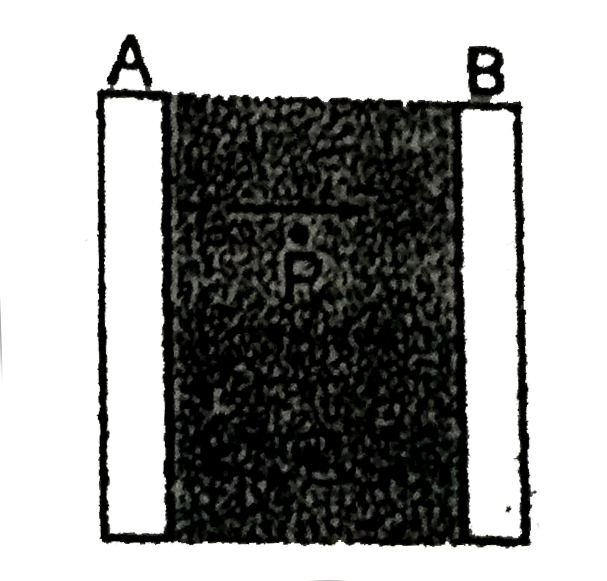
The figure shown represents the electric field between two large metal plates. Which of the graphs given in figure represents the force on a positve charge as it moves from point P towards plate B?
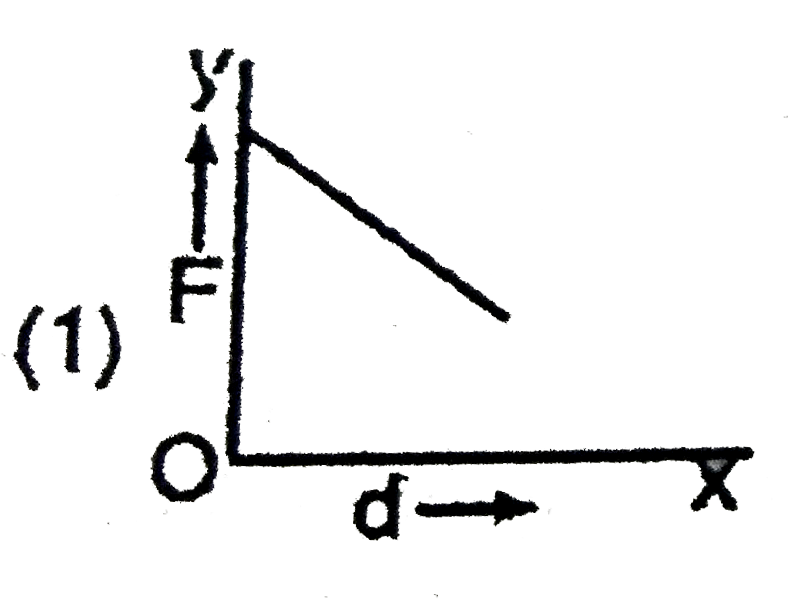
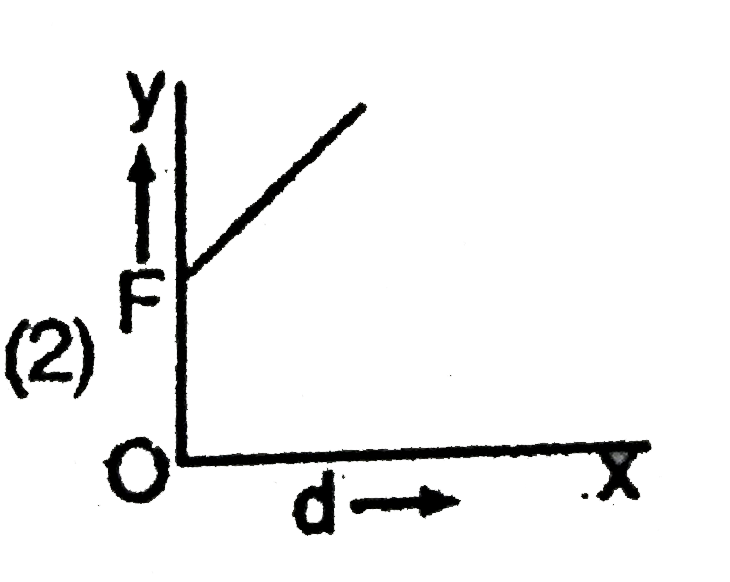
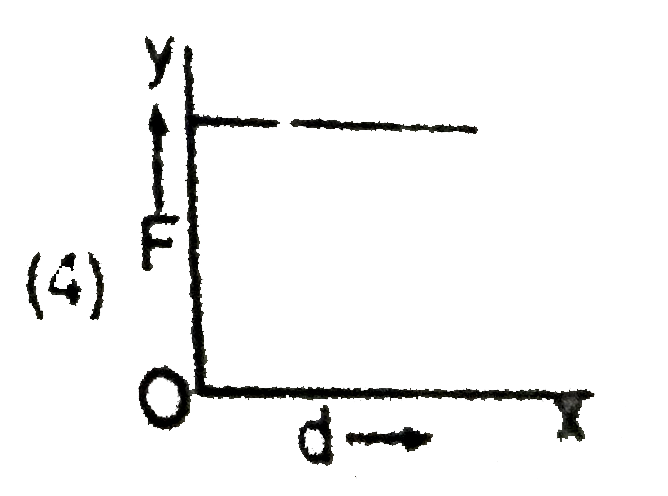
The correct Answer is:D
Electric field produced by large metal plate does not vary with distance so force on charge will be constant.
Topper's Solved these Questions
Similar Questions
Knowledge Check
- Question 1 - Select One
Figure shows the electric field lines around an electric dipole. Which of the arrows best represents the electric field at point P ?
 A
A B
B C
C D
D
- Question 2 - Select One
If metal section of shape H is inserted in between two parallel plates as shown in figure and A is the area of each plate then the equivalent capacitance is.
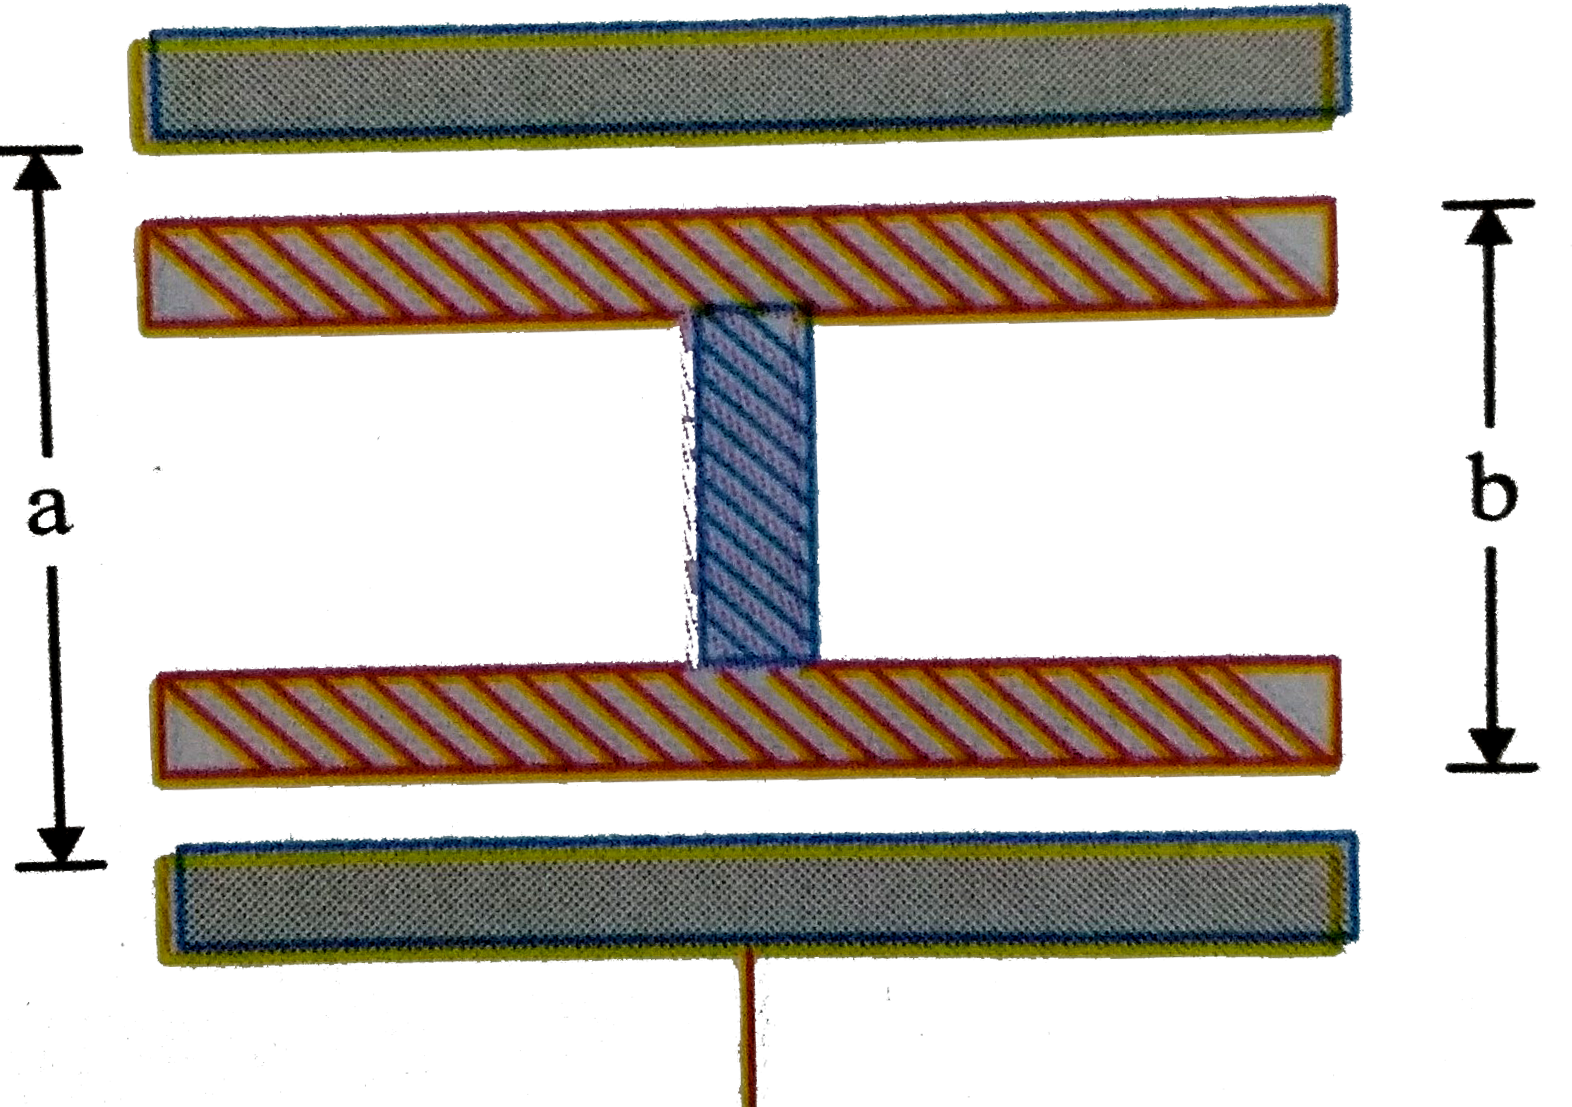 .AA∈0a−A∈0bBA∈0a+bCA∈0a+A∈0bDA∈0a−b
 - Question 3 - Select One
At which point (or points) in the given figure is the electric field zero N/C for the two point charges shown on the x axis ?
 AThe electric field is never zero in the vicinity of these charges.BThe electric field is zero somewhere on the x axis to the left of the +4q charge.CThe electric field is zero somewhere on the x axis to the right of the -2q charge.DThe electric field is zero somewhere on the x axis between the two charges, but this point is nearer to the -2q charge.
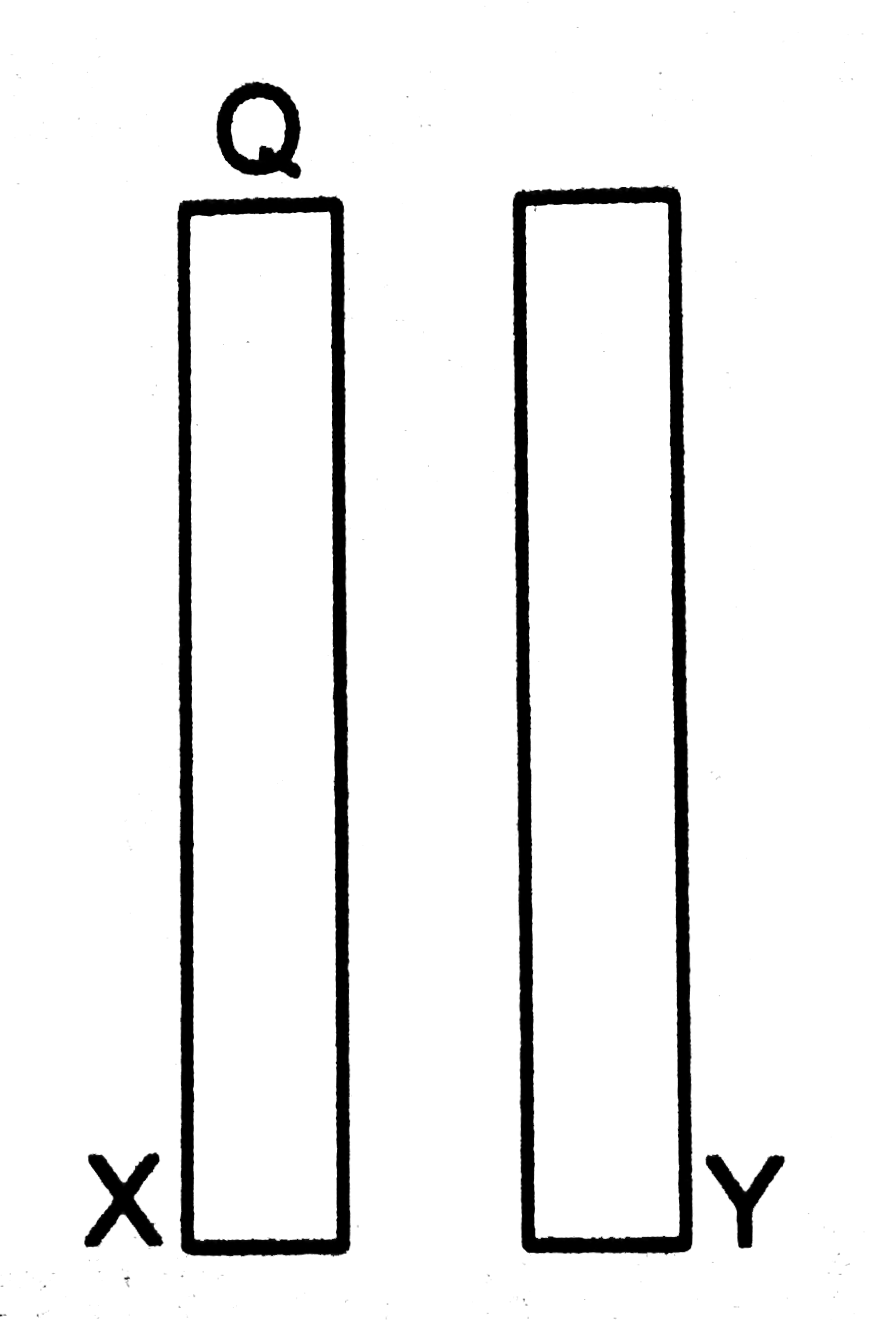
Two large conducting plates X and Y. each having large surface area A (on one side), are placed parallel to each other as shown in figure (30-E7). The plate X ia given a charge Q whereas the other is neutral. Find (a) the surface charge dendity at the inner surface of the plates X, (b) the electric field at a point to the left of the plates, (c) the electric field at a point in between the plates and (d) the electric field at a point to the right of the plates.
 View Solution
Two square metal plates have sides of length L and thickness t(<<<L). They are arranged parallel to each other with their inner faces at a separation of 52t. One of the plates is given a charge −Q and the other one is given a charge +Q . A third rectangular metal plate of sides L and x, having thickness t2 is inserted between the plates as shown. The third plate is equidistant from the two plates and parallel to them. Neglect edge effects.
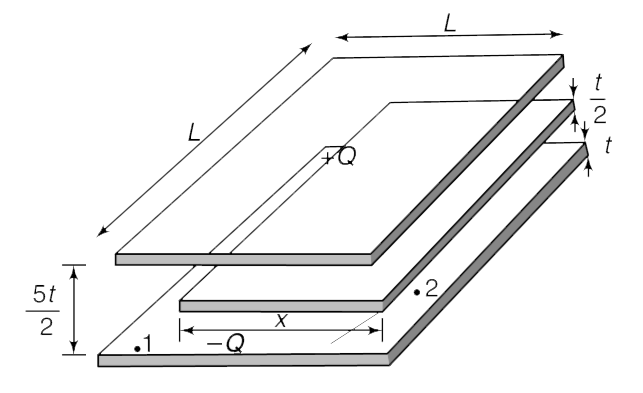
(a) Find the charge density on lower plate at points 1 and 2 shown in Figure.
(b) Find potential difference between the upper plate and the middle plate.
(c) Find electric field between the two outer plates in space where the third plate is not present (i.e., at a point above point 1.)
(d) Find the capacitance of the system across two outer plates.View SolutionA uniform electric field of magnitude E exists in between two parallel metal plates , as shown in the figure given below. One particle of mass m and charge q is projected along the central line between the plates. Particle just missed to strike upper plate , while coming out of plates. Find :
(a)Time taken by the particle to come out of plates.
(b)Speed of the particle as it comes out of plates.
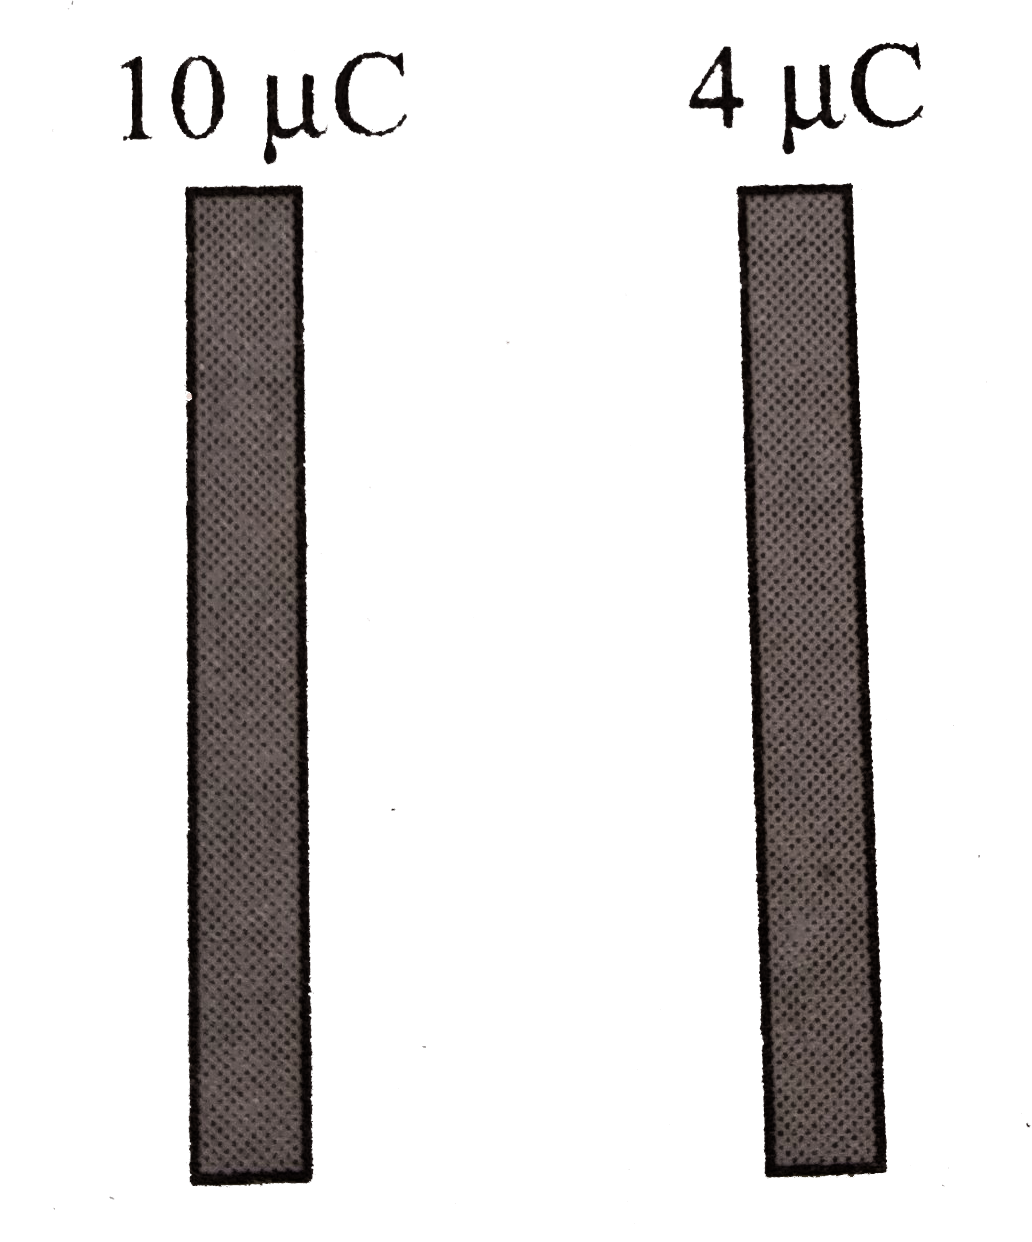
(c) Angle of deviation suffered by particle. The length of the plates is L and the distance between the plates is d. Ignore gravity .View SolutionTwo large plates are given the charges as shown in figure. Now, the left plane is earthed. Find the amount of charge that will flow from the earth to the plate.
 View Solution
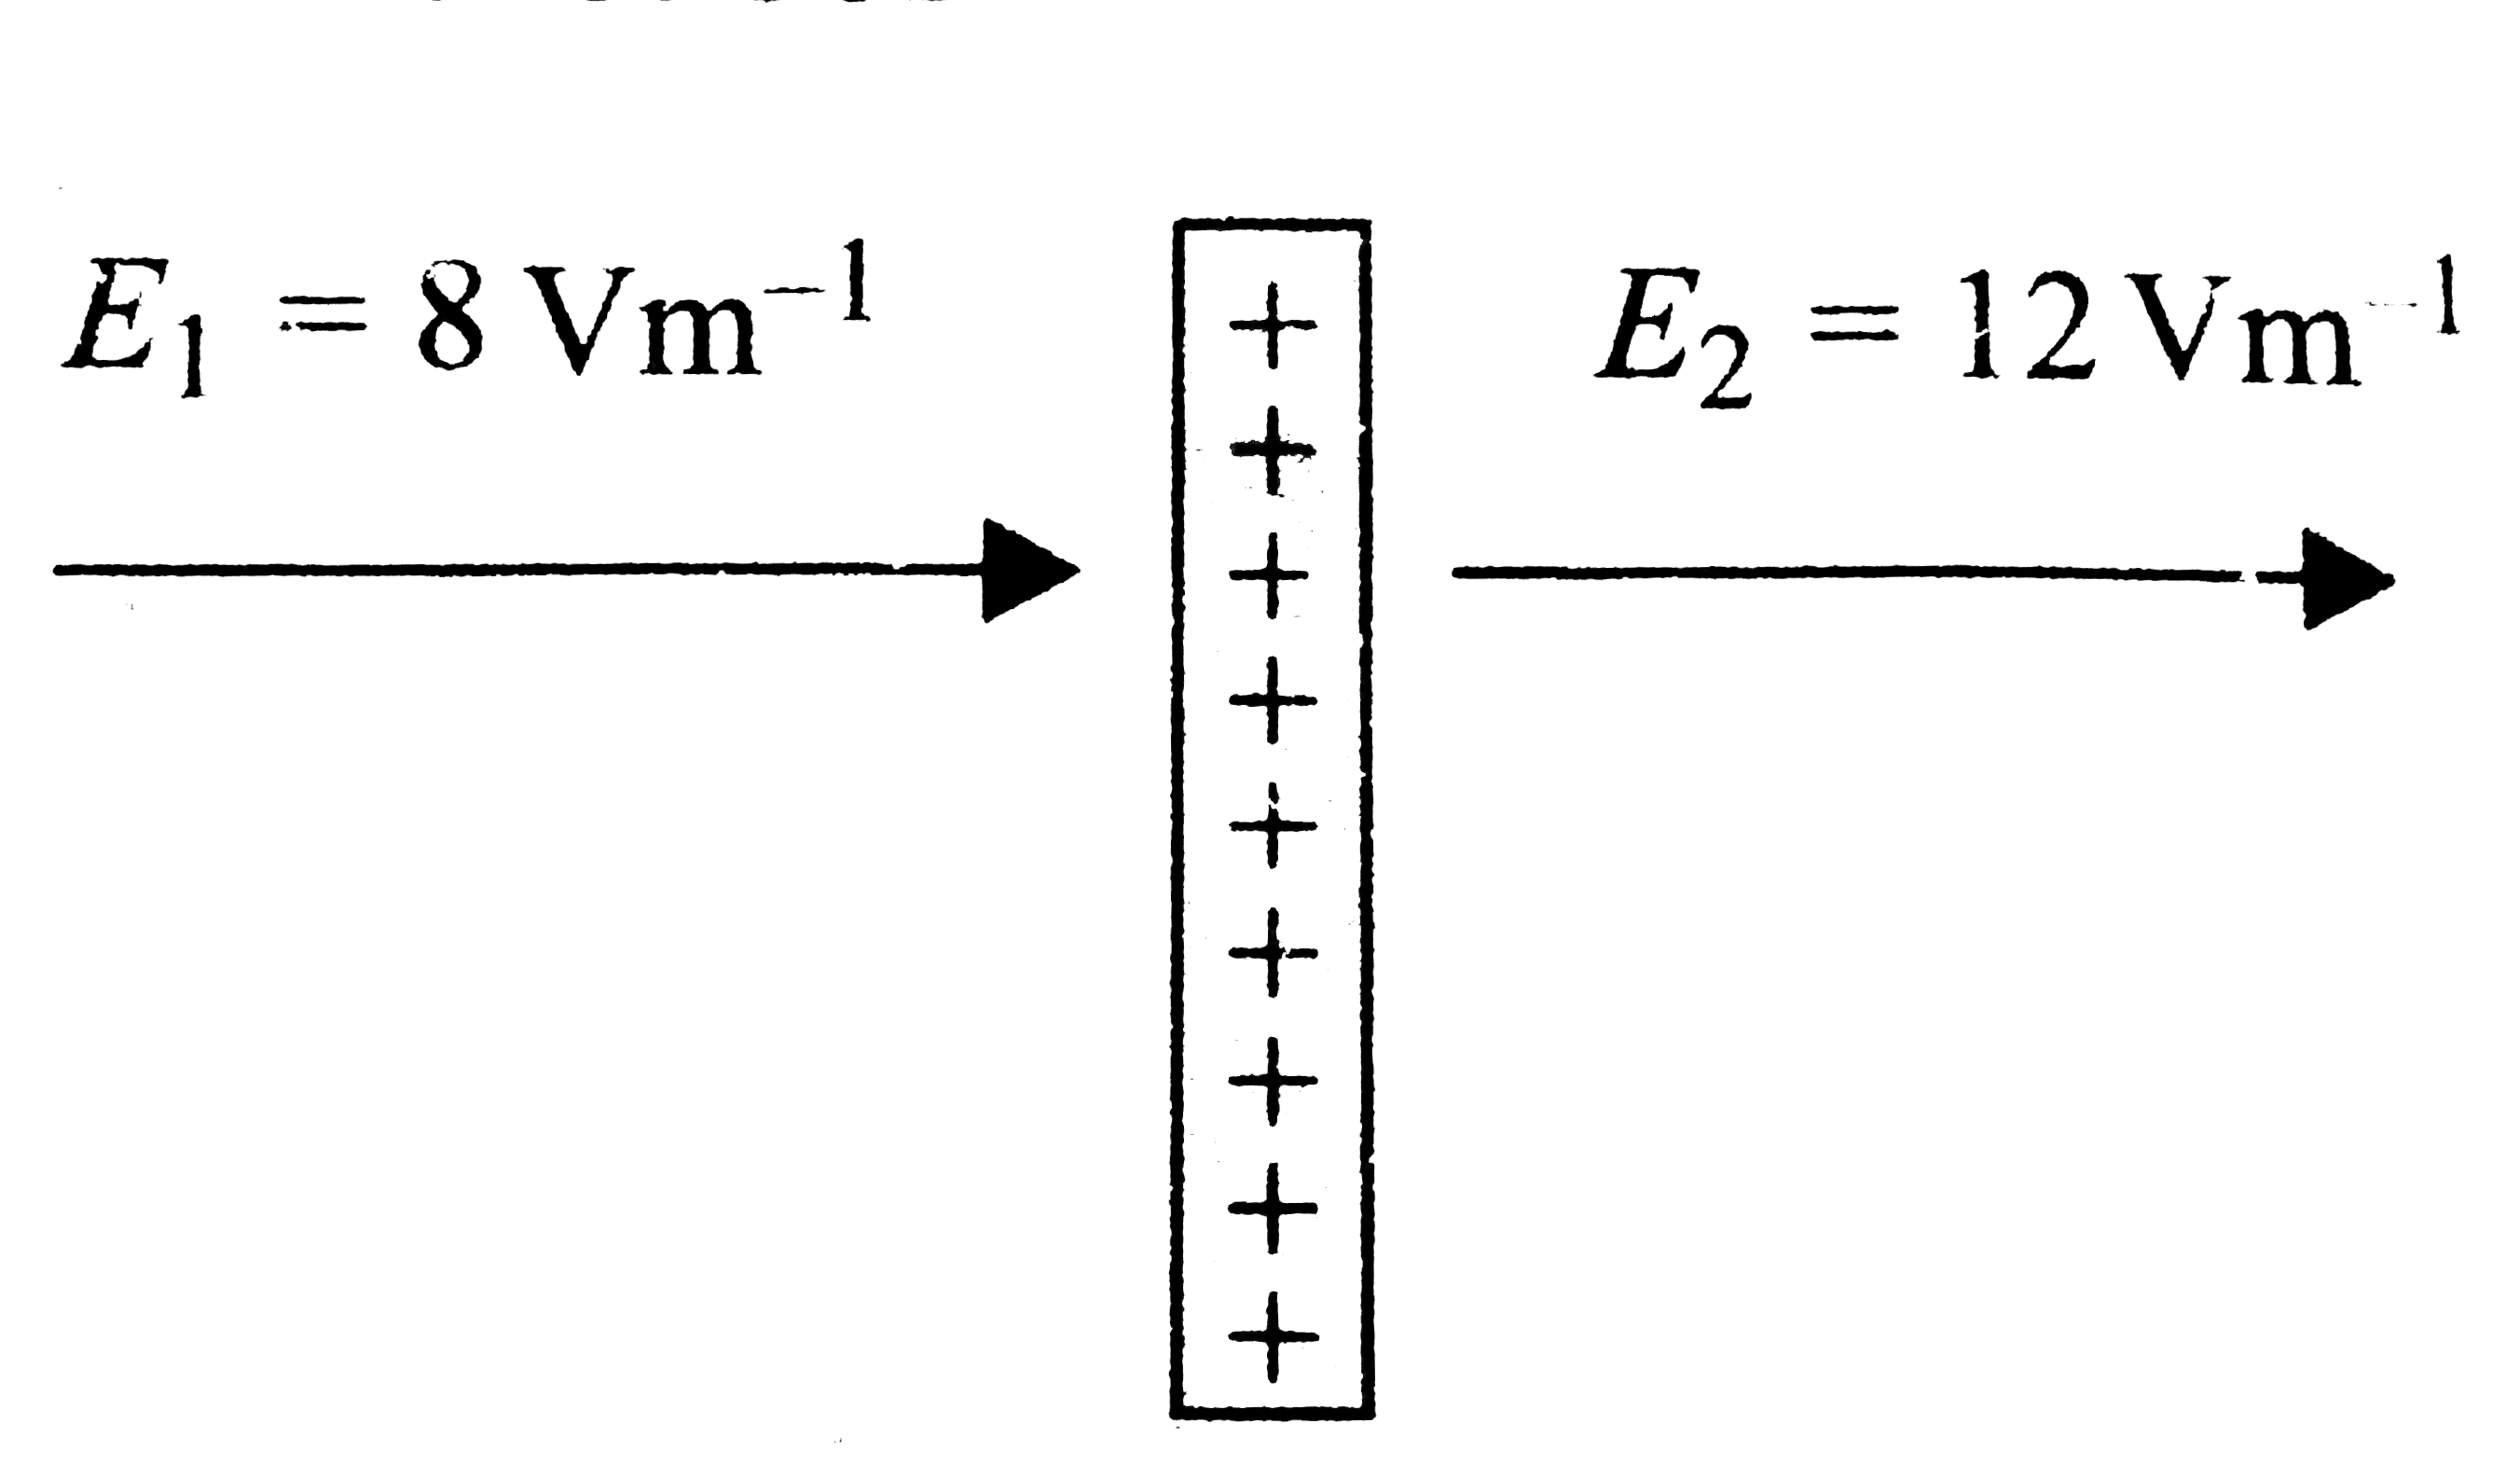
The electric field on two sides of a large charged plate is shown in figure. The charge density on the plate in SI units is given by (ε0 is the permittivity of free space in SI units).
 View Solution

_PHY_E01_022_Q01.png)